Utilizing LC/UV and LC/MS for the Characterization, Isolation, and Quantitation of Capsaicinoids in Chili Peppers and Hot Sauces
PO14400613_W_2
PO19040114_W_2
J Preston, Seyed Sadjadi, Zeshan Aqeel, and Sky Countryman Phenomenex, Inc., 411 Madrid Ave., Torrance, CA 90501 USA
Abstract Hot and spicy food has dramatically increased in popularity over the past 10-20 years. Capsaicin is the most abundant compound found in chili peppers giving them their fiery flavor. Capsaicin is formed when vanillylamine is coupled to a 10 carbon fatty acid through an amide linkage. However, there are other related compounds often called capsaicinoids. These compounds have the same vanillylamine group but differ by the associated fatty acid chain and are responsible for the perception of different heat profiles for different chili peppers. Some peppers are described as having a high initial flash of heat while other peppers are described by a long and late burning profile. The work presented here, initially uses HPLC with UV detection to profile capsaicinoids extracted from sever-
al different chili peppers and commercially available hot sauces. Prep HPLC is then used to isolate individual capsaicinoids from the pepper extracts. Finally, a triple quadruple MS system is employed to identify and quantitate the observed capsaicinoids. Capsaicin was found to be the most prevalent capsaicinoid species in all of the studied matrices. Significant amounts of Nordihydrocapsaicin were found in a cayenne hot sauce and in Thai chili pepper extract. Dihydrocapsaicin and Homodihydrocapsaicin were also identified in many of the investigated chili extracts and hot sauces but at lower levels. The typical concentration of these compounds were found to be in the µg/g range but varied widely among the different chili peppers and hot sauces.
Introduction Capsaicin is an amide derived from vanillylamine and a short chain fatty acid. A variety of capsaicin related compounds are formed when different fatty acid chains form this amide. This group of compounds are responsible for the pungency of chili peppers. Wilber Scoville established a scale to demonstrate the pungency of chili peppers based on taste-tests1 . This scale was later named in his honor. The pungency of chili peppers and hot sauces (or any other food) are currently determining the combined concentration of the three major capsaicinoids; capsaicin, dihydrocapsaicin and nordihydrocapsaicin. This determination is typically accomplished by a reversed phase chromatographic method (RP-HPLC). After this combined concentration value is determined by the chromatographic method (in ppm), it is then multiplied by a conversion factor of 15 to arrive at a corresponding Scoville Heat Unit (SHU) value. Although in high concentrations, all capsaicinoids produce burning sensations throughout the mouth and throat (and mucous membrane), in low concentrations they affect different areas of the mouth and throat. It is unknown how
the low level addition of these pungent compounds can enhance the food flavor profile1-3. The work presented here has 3 distinct parts. Initially a 3 minute analytical scale HPLC-UV method was developed utilizing a Kinetex® 5 µm C18 50 x 4.6 mm column. This methodology was employed to profile capsaicinoids from several different chili peppers and commercially available hot sauces. A fixed amount of ethanol and one whole pepper was used for the pepper extractions except for the Ghost Chilis, where only ½ of the pepper was used. This allows for a direct comparison of the amount of capsaicin related components on a per pepper basis. This analytical methodology was then scaled to Prep HPLC on a Kinetex 5 µm C18 100 x 21.2 mm AXIA™ packed column and utilized to isolate individual capsaicinoids from pepper extracts. Finally, a triple quadruple LC/MS system is employed to identify and quantitate the observed capsaicinoids.
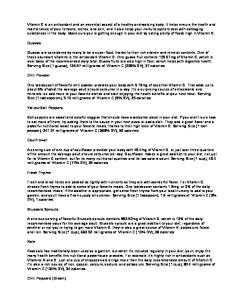
Figure 1. Pepper Identification 3.
4.
2. 1.
5. 6.
7.
8.
Materials and Methods Pepper samples and salsa samples were home grown and homemade. Hot sauce samples were purchased at stores within the Los Angeles area. Reagents were purchased from Sigma Aldrich, including Acetonitrile (ACN), Ethanol (EtOH), Formic Acid, Methanol (MeOH), Perchloric Acid, Trifluoroacetic Acetic Acid (TFA) Capsaicin, Dihydrocapsaicin and Novanimide were purchased (ChromaDex®, Irvine, CA)
Sample Preparation Bulk Chili Pepper Extraction (used for capsaicinoid profiling and LC/MS analyses) 1. 250 g of fresh chili peppers were blended for an extended period of time with DI water and EtOH to contain approximately 65 % alcohol 2. An aliquot of the puree was removed and filtered prior to analysis. Single Chili Pepper Extraction (used only for capsaicinoid profiling) 1. An entire pepper (except for the stem) was finely chopped (for Ghost Peppers, ½ a pepper was used) 2. The chopped pepper was placed in a 20 mL scintillation vial with 10 mL EtOH 3. The vial was capped and the contents were sonicated for 20 min 4. The remaining solids were allowed to settle and a portion of the liquid was filtered and used directly Chili Pepper Sauce Extraction 1. Various national and local brand chili pepper sauces (picante form) were obtained and 0.5 g were placed in separate 20 mL scintillation vials 2. To each vial, 3 mL DI water and 7 mL EtOH were added 3. The vials were capped and sonicated for 20 min at room temp 4. The mixture is then centrifuged and an aliquot of supernatant is collected 5. For HPLC-UV, the supernatant is used directly 6. For LC/MS/MS the supernatant is diluted with 30 % MeOH containing 0.1 % formic acid
Capsaicinoids Profiling/Characterization LC/UV Conditions Column: Dimensions: Part No.: Mobile Phase: Gradient:
Kinetex 2.6 µm C18 50 x 4.6 mm 00B-4462-EO A: 0.1 % Perchloric Acid in Water B: Acetonitrile Time (min)
B (%)
0.0
40
2.25
60
2.50
70
2.65
90
2.85
40
3.00
40
Flow Rate: Temperature: Detection: System: Detector:
2.0 mL/min 30° C UV @ 228 nm Agilent® 1100 Quaternary Agilent 1100 PDA
Figure 2. LC/UV example chromatograms of representative chilies and sauces B. Jalapeno
0
2
min
App ID 22114
App ID 22112
A. ½ Chocolate Ghost pepper
0
mAU
C. Habanero
2
min
D. Salsa
300
250
150
100
50
0
0
2
min
App ID 22118
App ID 22113
200
0
0.5
1
1.5
2
2.5
3
3.5
min
Capsaicinoid Individual Isolation LC/UV Preparative Chromatography Conditions Column: Dimensions: Part No.: Mobile Phase: Gradient:
Flow Rate: Temperature: System: Detection:
Kinetex 5 µm C18 Axia Packed 100 x 21.2 mm 00F-4601-P0-AX A: 0.1 % TFA in Water B: 0.1 % TFA in Acetonitrile Time (min)
B (%)
0.0
40
4.5
60
5
70
6
40
2.0 mL/min Ambient Shimadzu® LC20 UV @ 228 nm
Figure 3. Analytical and Corresponding Preparative Chromatogram mAU
Kinetex 5 µm C18 50 x 4.6 mm
150
125
100
75
App ID 22117
50
25
0
-25 1
2
3
4
5
min
mV
2
Kinetex 5 µm C18 100 x 21.2 mm
22.5
1) Nordihydrocapsaicin 2) Capsaicin 3) Dihydrocapsaicin 4) Homocapsaicin
20.0 17.5 15.0 12.5 10.0
1
3
4
App ID 22116
7.5 5.0 2.5 0.0 0.0
0.5
1.0
1.5
2.0
2.5
3.0
3.5
4.0
4.5
5.0
5.5
min
Identification and Quantification of Major Capsaicinoids LC/MS Conditions Column: Dimensions: Part No.: Mobile Phase: Gradient:
Kinetex 5 µm C18 100 x 2.1 mm 00D-4601-AN A: 0.1 % Formic in Water B: 0.1 % Formic Acid in Methanol Time (min)
B (%)
0.0
30
7.0
90
9.0
90
9.1
30
12.0
30
Flow Rate: Temperature: System: Detection System: Ionization Source:
0.6 mL/min Ambient Agilent® 1200SL (binary pump) AB Sciex API 4000™ LC/MS/MS ESI in Positive Polarity
MS/MS Conditions Precursor Method Precursor mass: 136.9 amu Q1 Mass Range: 150 to 350 amu Scan time: 2 sec Scan mode: Profile @ 0.25 amu step size
Ionization Source Parameters Gas 1 & Gas 2 CAD Cur IS Temp
50 5 35 3500 600
IDA Parameters: 1 to 2 most intense peaks exceeding 49000 cps MS/MS scan at 20 and 30 V from 100-350 Da
Table 2. MRM Transitions and Ionization Source Parameters Compound
Q1, Da
Q3, Da
DP, V
CE, V
Capsaicin
306.1
136.9
75
40
Dihydrocapsaicin
308.1
136.9
42
25
Nordihydrocapsaicin
294.1
136.9
45
18
Homodihydrocapsaicin
322.2
136.9
70
20
Homocapsaicin
320.2
136.9
47
20
Figure 4. Fragmentation Comparison of Capsaicin and Dihydrocapsaicin at Collision Energy (CE) of 15 V 181.9
H3C
80%
CH3 NH
O 136.9
60% 40% 20% 0% 100
138.3 110
120
130
151.0 140
153.1 150
80%
160
170.0 170
306.1
181.9
180
190
200
210
220
230
240
250
260
270
280
290
300
310
183.9
136.9
100%
Rel. Int (%)
Capsaicin
CH3 O
HO H3C
CH3 NH
O
60%
Dihydrocapsaicin
CH3 O
136.9
40% 308.1
20% 0% 100
183.9 155.0 110
120
130
140
150
160
309.2
172.0 170
180
190
200
210 220 mz/, Da
230
240
250
260
270
280
290
300
310
App ID 21863
Rel. Int (%)
HO
136.9
100%
Figure 5. Precursor Scan of Nordihydrocapsaicin in Serrano Chili Pepper and MS/MS Spectrum of Nordihydrocapsaicin at CE = 20 V 5.74
5.3e7 4.0e7
6.22
2.0e7 6.69 0.0 1.0 27
2.0 56
3.0 85
4.0 114
5.0 142
6.0 168
7.0 196
8.0 225
9.0 254
10.0 284
12.0 min 342
11.0 313
294.3
9.5e4 5.0e4 0.0 160
170
180
190
200
210
220
230
240
260
270
280
290
2.0e5
H3C
1.5e5
100
120
140
320
330
340
CH3 O
5.0e4 141.0
310
NH
O
1.0e5
0.0
300
350
HO
137.0
2.3e5
250
158.0 160
170.0
247.5 180
200
220
240 mz/, Da
App ID 21864
150
262.0 260
H3C 276.8 280
294.0 300
320
340
Results and Discussion Analysis - Bulk Chili Pepper Extract Comparison Extracts from Habanero, Serrano, Jalapeno and Thai chili peppers were analyzed by a precursor scan method. MS/ MS spectra of suitable candidate peaks were collected as a further measure of identification of the capsaicinoids (Table 3). The possible capsaicinoids are listed in Table 1. Surprisingly, based on ion intensities, Thai chili peppers had a large overall concentration of capsaicinoids. In addition, the ratio these other capsaicinoids to capsaicin was higher than the rest of the chili peppers we investigated, see Table 3. The presence of multiple peaks for some of these compounds, most noteworthy nordihydrocapsaicin, suggests the presence of isomers, possibly on the fatty acid tail side. The presence of branched (e.g. isopropyl tail) and straight chain acid could be one of the possible isomeric forms (Figure 5). Due to poor fragmentation pattern of these molecules, a confirmation will require additional techniques such as H-NMR. Such an endeavor might be pursued in the future work. Capsaicins Fragmentation Profile Capsaicin, dihydrocapsaicin, and novanimide were purchased and analyzed to determine their ionization properties and fragmentation patterns. The fragmentation pattern indicated the amide bond breaks to form a predominant fragment for all of these related compounds (Figure 4). The most abundant fragment has a mass of 136.9 and is displayed below. This mass was used in the MRM and Precursor scan analysis, see below. HO
O
Quantitation of Capsaicinoids in Hot Sauces Following the extraction and purification of the various capsaicinoids from Thai chili peppers, 0.1 to 7 mg of various species were obtained (Figure 3). After a quick infusion study and MS analysis, the material purity deemed sufficient to setup a semi-quantitative method with an external calibration. An MRM method was quickly established with the various precursor masses established earlier and the common fragment as the Q3 mass (Table 2). Furthermore, due to high concentration of these compounds, some of the ion source and mass-dependent parameters were detuned to reduce overall signal intensities. The identity of the specific octanoic acid vanillinamide were not known at this time and these peaks were only monitored (Table 1). The extracts from the chili sauces were analyzed with a faster LC gradient under the MRM method (Table 4). Evaluation of Capsaicinoids from Single Peppers Bulk extracts are a fair way to compare different types of peppers but it is not very practical from a consumer perspective. When purchasing peppers to prepare a dish, it would be useful to know the typical amount of capsaicinoids each pepper would contribute to that dish. Table 3 summarizes the capsaicinoid results for individual peppers. From the Peak Area data, the total amount of capsaicinoids can be evaluated. From the Peak Area % data, the relative amount of each capsaicinoid in that pepper is described.
Table 3. HPLC-UV Individual Pepper Results Peak Area
1
2
3
4
Nordihydrocapsaicin
Capsaicin
Dihydrocapsaicin
Homocapsaicin
1/2 Chocolate Ghost
7.71
638.91
106.14
7.56
1/2 Ghost
9.29
280.06
162.14
8.02
Pequin
12.75
262.14
53.34
2.87
Habanero
14.68
217.2
126.97
14.05
Jalapeno
73.42
170.89
170.22
19.84 2.13
Serrano
11.18
53.85
38.36
Cayenne
19.56
39.91
47.7
26.81
Thai chili
5.63
9.5
11.77
3.42
1
2
3
4
Nordihydrocapsaicin
Capsaicin
Dihydrocapsaicin
Homocapsaicin
1/2 Chocolate Ghost
1.0
84.0
14.0
1.0
1/2 Ghost
2.0
60.9
35.3
1.7
Pequin
3.9
79.2
16.1
0.9
Habanero
3.9
58.2
34.0
3.8
Jalapeno
16.9
39.3
39.2
4.6
Serrano
10.6
51.0
36.4
2.0
Cayenne
14.6
29.8
35.6
20.0
Thai chili
18.6
31.3
38.8
11.3
Peak Area %
Table 4. Concentration of Various Capsaicinoids in Hot Sauces, Reported in PPM Levels and Subsequent Scoville Heat Unit Calculations Compound
Sauce M
Sauce T
Sauce H
Sauce S
Sauce C
Nordihydrocapsaicin (1)
1600
40
60
60
20
Capsaicin (2)
14000
140
600
140
80
Dihydrocapsaicin (3)
12000
200
400
200
80
Homocapsaicin
6000
60
0
60
40