Hu_ch02v3.fm Page 35 Thursday, February 12, 2009 12:22 PM
2 Motion and Recombination of Electrons and Holes CHAPTER OBJECTIVES The first chapter builds the necessary model for understanding semiconductors at equilibrium. This chapter will consider how the electrons and holes respond to an electric field and to a gradient in the carrier concentration. It is the response of charge carriers to these disturbances that gives life to the myriad of semiconductor devices. This chapter also introduces recombination and its opposite, generation. They are nature’s ways of restoring the carrier concentrations to the equilibrium value by annihilating and creating electron–hole pairs.
2.1 ● THERMAL MOTION ● Even without an applied electric field, carriers are not at rest but possess finite kinetic energies. The average kinetic energy of electrons, E – Ec, can be calculated in the following manner: total kinetic energy Average electron kinetic energy = ----------------------------------------------------number of electrons f ( E ) D ( E ) ( E – E c ) dE = ∫----------------------------------------------------------∫ f ( E ) D ( E ) dE
(2.1.1)
The integration in Eq. (2.1.1) is to be carried out over the conduction band, and the same approximations used in the derivation of Eq. (1.8.5) can be used here. The result is 3 Average kinetic energy = --- kT (2.1.2) 2
35
Hu_ch02v3.fm Page 36 Thursday, February 12, 2009 12:22 PM
36
Chapter 2
●
Motion and Recombination of Electrons and Holes
It can be shown that Eq. (2.1.2) is true for both electrons and holes.1 The kinetic energy in Eq. (2.1.2) may be used to estimate the thermal velocity, vth , of electrons 2 2 and holes by equating the energy with m n v th ⁄ 2 or m p v th ⁄ 2 . v th =
EXAMPLE 2–1
3kT ----------m
(2.1.3)
Thermal Velocity
What are the approximate thermal velocities of electrons and holes in silicon at room temperature? SOLUTION:
Assume T = 300 K and recall mn = 0.26 m0. 2 1 3 Kinetic energy = --- m n v th = --- kT 2 2
v th =
3kT ----------m
(2.1.3)
= ( 3 × 1.38 × 10 5
–23
J/K × ( 300 K ⁄ 0.26 × 9.1 × 10
–31
kg ) )
1⁄2
7
= 2.3 × 10 m/s = 2.3 × 10 cm/s Note that 1 J = 1 kg·m2/s2. Using mp = 0.39 m0 instead of mn , one would find the hole thermal velocity to be 2.2 × 107cm/s. So, the typical thermal velocity of electrons and holes is 2.5 × 107cm/s, which is about 1000 times slower than the speed of light and 100 times faster than the sonic speed.
Electrons and holes move at the thermal velocity but not in a simple straight-line fashion. Their directions of motion change frequently due to collisions or scattering with imperfections in the crystal, more about which will be said in Section 2.2. The carriers move in a zigzag fashion as shown in Fig. 2–1. The mean free time between collisions is typically 10–13s or 0.1 ps (picosecond), and the distance between collisions is a few tens of nanometers or a few hundred angstroms. The net thermal velocity (averaged over time or over a large number of carriers at any given time) is zero. Thus, thermal motion does not create a steady electric current, but it does introduce a thermal noise.
1 In fact, Eq. (2.1.2) is applicable to many kinds of particles and is known as the equal-partition principle
because the kinetic energy of motion is equally partitioned among the three dimensions (x, y, z) – kT/2 for each direction.
Hu_ch02v3.fm Page 37 Thursday, February 12, 2009 12:22 PM
2.1
●
Thermal Motion
⫹
⫹
FIGURE 2–1 The thermal motion of an electron or a hole changes direction frequently by scattering off imperfections in the semiconductor crystal.
● Hot-Point Probe, Thermoelectric Generator and Cooler ● ⫹
v
⫺
Hot
⫺ Cold
v
⫹
Hot
⫺
Cold ⫹
N
P (a)
(b) Hot
⫺
⫹
⫹
P ⫹ Cold
Hot ⫺
⫺
N ⫺
⫹
⫹
P ⫹ Cold
⫹
⫺
N ⫺ Cold ⫺
(c)
FIGURE 2–2 (a, b) Hot-point probe test can determine the doping type of a sample. (c) A thermoelectric generator converts heat into electric power.
Thermal motion can create a net current flow when there is a temperature difference. Figure 2–2a shows an N-type semiconductor sample. A cold (roomtemperature) metal probe is placed on the sample close to a hot probe, perhaps a soldering iron. The electrons around the hot probe have higher thermal velocity and therefore on average move toward the cold side at a higher rate than the electrons on the cold side move to the hot side. The imbalance causes the electrons to accumulate on the cold side and build up a negative voltage, which is detected with a voltmeter.
37
Hu_ch02v3.fm Page 38 Thursday, February 12, 2009 12:22 PM
pp
38
Chapter 2
●
Motion and Recombination of Electrons and Holes
Figure 2–2b shows that a positive voltage would be registered on the cold side if the sample is P-type. This is a practical and simple technique of testing the doping type of a semiconductor sample. It is called the hot-point probe test. With engineering optimization, not only voltage but also significant electric power can be created with a temperature difference across P- and N-type semiconductor elements. Figure 2–2c is a schematic drawing of a thermoelectric generator. It powered some early space satellites using the radioactive decay of radioactive materials as the heat source. If, instead of extracting power from the device, current is fed into it, one set of the junctions become cooler than the other. The device is then a thermoelectric cooler. It can be used to cool a hot IC in a circuit board or beverages in a batterypowered portable cooler.
2.2 ● DRIFT ● Drift is the motion of charge carriers caused by an electric field. Clearly, drift is usually at play when voltages are applied to a semiconductor device. 2.2.1 Electron and Hole Mobilities The average velocity of the carriers is no longer zero when an electric field Ᏹ is applied to the semiconductor. This nonzero velocity is called the drift velocity. The drift velocity is superimposed on the thermal motion as illustrated in Fig. 2–3. The drift velocity is so much more important than the thermal velocity in semiconductor devices that the term velocity usually means the drift velocity. A faster carrier velocity is desirable, for it allows a semiconductor device or circuit to operate at a higher speed. We can develop a model for the drift velocity using Fig. 2–3. Consider the case for holes. Assume that the mean free time between collisions is τmp and that the carrier loses its entire drift momentum, mpv, after each collision.2 The drift momentum gained between collisions is equal to the force, qᏱ, times the mean free time. Equating the loss to the gain, we can find the steady state drift velocity, v. m p v = qᏱ τ mp
(2.2.1)
qᏱ τ mp v = --------------mp
(2.2.2)
Equation (2.2.2) is usually written as v = µpᏱ q τ mp
µ p = -----------mp
(2.2.3a) (2.2.4a)
2 Actually, it may take more than one collision for the carrier to lose its drift momentum. Another name
for τmp, the mean time for momentum relaxation, is therefore more accurate. Although we will study a simplified analysis, be assured that a full analysis does lead to the same results as presented here.
Hu_ch02v3.fm Page 39 Thursday, February 12, 2009 12:22 PM
2.2
●
Drift
⫹
⫹
Ᏹ
FIGURE 2–3 An electric field creates a drift velocity that is superimposed on the thermal velocity.
Equation (2.2.3a) simply says that the drift velocity is proportional to Ᏹ. The proportionality constant µp is the hole mobility, a metric of how mobile the holes are. Similarly, electron drift velocity and electron mobility are
v = –µ nᏱ
(2.2.3b)
q τ mn
µ n = -----------mn
(2.2.4b)
The negative sign in Eq. (2.2.3b) means that the electrons drift in a direction opposite to the field Ᏹ. They do so because the electron is negatively charged. We should memorize these statements rather than the negative sign. Carrier mobility has the same dimension as v/Ᏹ, i.e., cm2/V·s. Table 2–1 shows some mobility values. Notice that GaAs has a much higher µn than Si (due to a smaller mn ). Thus, higher-speed transistors can be made with GaAs, which are typically used in communications equipment. InAs has an even higher µn, but the technology of fabricating InAs devices has not yet been fully developed. TABLE 2–1 • Electron and hole mobilities at room temperature of selected lightly doped semiconductors. Si
Ge
GaAs
InAs
µn
(cm2/V·s)
1400
3900
8500
30, 000
µp
(cm2/V·s)
470
1900
400
500
39
Hu_ch02v3.fm Page 40 Thursday, February 12, 2009 12:22 PM
40
Chapter 2
Motion and Recombination of Electrons and Holes
●
EXAMPLE 2–2
Drift Velocity, Mean Free Time, and Mean Free Path
Given µp = 470 cm2/V·s for Si, what is the hole drift velocity at Ᏹ = 103 V/cm? What is τmp and what is the average distance traveled between collisions, i.e., the mean free path? v = µpᏱ = 470 cm2/V·s × 103 V/cm = 4.7 × 105cm/s This is much lower than the thermal velocity, ~2.1 × 107cm/s. From Eq. (2.2.4b), SOLUTION:
τmp = µpmp/q = 470 cm2 × 0.39 × 9.1 × 10–31kg/1.6 × 10–19C = 0.047 m2 × 2.2 × 10–12 kg/C = 1 × 10–13s = 0.1 ps Mean free path = τmp νth ~ 1 × 10–13s × 2.2 × 107cm/s = 2.2 × 10⁻⁶cm = 220 Å = 22 nm 2.2.2 Mechanisms of Carrier Scattering We will now present a more detailed description of carrier collisions and show that τmn and τmp in Eq. (2.2.4) can vary significantly with temperature and the doping concentration. What are the imperfections in the crystal that cause carrier collisions or scattering? There are two main causes: phonon scattering and ionized impurity scattering. Phonons are the particle representation of the vibration of the atoms in the crystal—the same sort of vibration that carries sound, hence the term phonons. Crystal vibration distorts the periodic crystal structure and thus scatters the electron waves. Instead of electron waves and vibration waves, it is more intuitive to think of electron particles scattering off phonon particles. The mobility due to phonon scattering alone, µphonon = qτph/m, is proportional to τph, the mean free time of phonon scattering. But, what determines the phonon scattering mean free time? Let us use the pinball machine for analogy. In a pinball machine, the mean time of collisions between the ball and the pins is inversely proportional to the density of the pins and the speed of the ball. Similarly, the mean free time of phonon scattering is inversely proportional to the phonon density and the electron speed, which is basically the thermal velocity. In addition, the phonon density is known to be proportional to the absolute temperature, T.
µ phonon ∝ τ ph –3 ⁄ 2 1 1 ∝ ----------------------------------------------------------------------------------------------------------- ∝ -------------------- ∝ T phonon density × carrier thermal velocity T ⋅ T 1 ⁄ 2
(2.2.5)
So, the phonon scattering mobility decreases when temperature rises. What about the impurity scattering mobility? The dopant ions are fixed charge in the semiconductor crystal. They can make electrons and holes change the direction of motion through the coulombic force. An electron can be scattered by either a donor (positive) ion or an acceptor (negative) ion as shown in Fig. 2–4. The same is true for a hole.
Hu_ch02v3.fm Page 41 Thursday, February 12, 2009 12:22 PM
2.2
Boron ion ⫺
⫺
●
Drift
Electron ⫺
⫹
Electron
Arsenic ion
(a)
(b)
FIGURE 2–4 An electron can be scattered by an acceptor ion (a) and a donor ion (b) in a strikingly similar manner, even though the ions carry opposite types of charge. The same is true for a hole (not shown).
In Fig. 2–4a, the repulsive coulombic force between the electron and the negative ion deflects the motion of the electron. Figure 2–4b shows that an attractive coulombic force can induce the same effect on the electron trajectory.3 The mobility due to impurity scattering is therefore inversely proportional to the sum of the donor and acceptor ion concentrations. It is also proportional to T 3/2. Why is the mobility higher, i.e., the scattering weaker, at a higher T? At a higher temperature, the electron in Fig. 2–4 has a higher thermal velocity and flies by the ion in a shorter time, and its direction of motion is thus less affected by the ion. A sports analogy: a ball carrier that charges by a blocker at high speed gives the blocker less of a chance to stop him. 3⁄2
T µ impurity ∝ ------------------Na + Nd
(2.2.6)
When there is more than one scattering mechanism, the total scattering rate (1/τ) and therefore the total mobility are determined by the sum of the inverses. 1--1 1 = ----------------- + ------------------τ τ phonon τ impurity
(2.2.7a)
1 - + ------------------1 --1- = ----------------µ µ phonon µ impurity
(2.2.7b)
Figure 2–5 shows that the silicon hole mobility is about one-third of the electron mobility. Part of this difference in mobility can be explained by the difference in the effective mass (see Eq. (2.2.4)). The rest is attributable to the difference in the scattering mean free time. The mobilities may be expressed as (with Na and Nd in per cubic centimeter) [1, 2]. 2 420 + 50 µ p( cm ⁄ V ⋅ s ) = -------------------------------------------------------------------------17 0.7 1 + [ ( N a + N d ) ⁄ 1.6 × 10 ]
(2.2.8)
3 This is how a space probe uses the attractive gravitational force of a planet to change its course in a “slingshot” manner.
41
Hu_ch02v3.fm Page 42 Thursday, February 12, 2009 12:22 PM
Chapter 2
●
Motion and Recombination of Electrons and Holes
1600 mn mp
1400 1200 Mobility (cm2/ V⭈s)
42
1000 800 600 400 200 0 1014
1015
1016 1017 1018 3 Na ⫹ Nd (ions/cm )
1019
1020
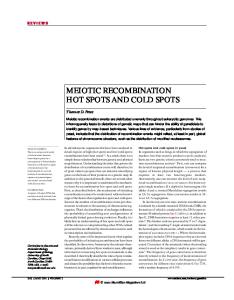
FIGURE 2–5 The electron and hole mobilities of silicon at 300 K. At low dopant concentration, the electron mobility is dominated by phonon scattering; at high dopant concentration, it is dominated by impurity ion scattering. (After [3].)
2 1318 - + 92 µ n( cm ⁄ V ⋅ s ) = ----------------------------------------------------------------------17 0.85 1 + [ ( N a + N d ) ⁄ 1 × 10 ]
(2.2.9)
You may notice that the inverse proportionality to dopant density (Eq. (2.2.6)) is not followed in Eqs. (2.2.8) and (2.2.9) at the limit of very large Na or Nd . The reason is free-carrier screening. When the carrier concentration is large, the carriers can distribute themselves to partially screen out the coulombic field of the dopant ions. The electron mobility of an N-type silicon sample at room temperature is measured to be 600 cm2/V·s. Independent measurement shows that the electron concentration is n = 5 × 1016 cm–3. According to Fig. 2–5, µn should be significantly larger than 600 cm2/V·s if Nd = 5 × 1016 cm–3. What do you think may be responsible for the discrepancy? Be as quantitative as you can. Hint: Consider possible dopant compensation (Section 1.9). QUESTION
●
Figure 2–6 shows a schematic plot of the temperature dependence of µn. At small dopant concentrations, µ decreases with increasing T, indicative of the dominance of phonon scattering (Eq. (2.2.5)). At very high dopant concentration and low temperature, where impurity scattering is expected to dominate, µ indeed increases with increasing T (Eq. (2.2.6)). The mobility data in Figs. 2–5 and 2–6 (and Fig. 2–8) do not agree perfectly. This goes to show that it is not easy to measure mobility accurately and that we should presume the existence of uncertainties in experimental data in general.
Hu_ch02v3.fm Page 43 Thursday, February 12, 2009 12:22 PM
2.2
104
●
Drift
Nd ⫽ 1014 cm⫺3
Ân (cm2/(V⭈s))
1016
103
1017
1018 1019
102 50 100
500
200
1000
T (K)
FIGURE 2–6 Temperature dependence of the electron mobility in Si. (After [4], reprinted by permission of John Wiley & Sons, Inc.)
● Velocity Saturation and Ballistic Transport ●
In small devices, the electric field can easily reach 105V/cm. If the electron mobility is 103 cm2/V·s, the drift velocity, according to v = Ᏹµ, should be 108 cm/s. In reality, electron and hole velocities saturate at around 107cm/s and do not increase beyond that, no matter how large Ᏹ is (as shown in Figs. 6–20 and 6–21). The culprit is optical phonon scattering. Optical phonons are high-energy phonons that interact strongly with the electrons and holes. When the kinetic energy of a carrier exceeds the optical phonon energy, Eopt , it generates an optical phonon and loses the kinetic energy. Therefore, the velocity does not rise above saturation velocity, vsat. Mobility and even velocity saturation (see Section 2.2.2) are concepts that describe the carrier motion averaged over many scattering events. These concepts become fuzzy when we deal with devices whose sizes are smaller than the mean free path. The motion of carriers in a nearly scattering-free environment is called ballistic transport. Section 6.12 presents an example of this situation. 2 1 --- mv sat ≈ E opt 2
v sat ≈ 2 E opt ⁄ m Eopt is about 40 meV, which puts vsat at around 107cm/s. Velocity saturation has a deleterious effect on device speed as shown in Chapter 6.
43
Hu_ch02v3.fm Page 44 Thursday, February 12, 2009 12:22 PM
44
Chapter 2
●
Motion and Recombination of Electrons and Holes
2.2.3 Drift Current and Conductivity Let us turn our attention to the current that flows in a semiconductor as a result of carrier drift. The current density, J, is the charge per second crossing a unit area plane normal to the direction of current flow. In the P-type semiconductor bar of unit area shown in Fig. 2–7, the hole current density is (2.2.10)
J p, drift = qpv
For example, if p = 1015 cm–3 and v = 104cm/s, then Jp,drift = 1.6 × 10–19C × 10 cm–3 × 104cm/s = 1.6 C/s·cm2 = 1.6 A/cm2. Employing Eq. (2.2.3a), Eq. (2.2.10) can be written as 15
J p, drift = qp µ p Ᏹ
(2.2.11)
Similarly, the electron current density can be expressed as J n, drift = – q nv = qn µ n Ᏹ
(2.2.12)
The total drift current density is the sum of the electron and the hole components: Jdrift = J n, drift + J p, drift = ( qn µ n + qp µ p ) Ᏹ
(2.2.13)
The quantity in the parentheses is the conductivity, σ, of the semiconductor
σ = qn µ n + qp µ p
(2.2.14)
Usually only one of the components in Eq. (2.2.14) is significant because of the large ratio between the majority and minority carrier densities. The resistivity, ρ, is the reciprocal of the conductivity. The standard units of σ and ρ are A/V·cm (or S/cm, S being siemens) and Ω·cm, respectively. ρ is shown as a function of the dopant density in Fig. 2–8. Ᏹ
Jp
Unit area
⫹ ⫹
v
FIGURE 2–7 A P-type semiconductor bar of unit area is used to demonstrate the concept of current density.
Hu_ch02v3.fm Page 45 Thursday, February 12, 2009 12:22 PM
2.2
●
Drift
1021
1020
1019
Dopant density (cm⫺3)
1018
1017 P type 1016
1015
N type
1014
1013
101210⫺4
10⫺3
10⫺2
10⫺1 100 101 Resistivity (ohm⭈cm)
102
103
104
FIGURE 2–8 Conversion between resistivity and dopant density of silicon at room temperature. (After [3].)
EXAMPLE 2–3
Temperature Dependence of Resistance
a. What is the resistivity, ρ, of silicon doped with 1017cm–3 of arsenic? b. What is the resistance, R, of a piece of this silicon material 1 µm long and 0.1 µm2 in cross-sectional area? c. By what factor will R increase (or decrease) from T = 300 K to T = 400 K? d. What As concentration should one choose if she wishes to minimize the change in (c)? SOLUTION:
a. Using the N-type curve in Fig. 2–8, we find that ρ = 0.084 Ω·cm. You can also answer this question using Fig. 2–5 and Eq. (2.2.14). b. R = ρ × length/area = 0.084 Ω·cm × 1 µm / 0.1 µm2 = 0.084 Ω·cm × 10–4cm /10–9cm–2 = 8.4 × 10³Ω.
45
Hu_ch02v3.fm Page 46 Thursday, February 12, 2009 12:22 PM
46
Chapter 2
●
Motion and Recombination of Electrons and Holes
c. The temperature dependent factor in σ (Eq. (2.2.14)) (and therefore in ρ) is µn. Figure 2–6 (1017cm–3 curve) shows µn to decrease from 770 at 300 K to 400 at 400K. We conclude that R increases by 770 --------- = 1.93 400 d. The 1019cm–3 curve indicates nearly equal mobilities at 300 and 400K. Therefore, that Nd would be a good choice. 1.1 × 1019 cm–3 would be an even better choice.
2.3 ● DIFFUSION CURRENT ● In addition to the drift current, there is a second component of current called the diffusion current. Diffusion current is generally not an important consideration in metals because of their high conductivities. The low conductivity and the ease of creating nonuniform carrier densities make diffusion an important process in semiconductors. Diffusion is the result of particles undergoing thermal motion as depicted in Fig. 2–1. It is the familiar process by which particles move from a point of higher particle density toward a point of lower density, as shown in Fig. 2–9. The aroma of a cup of coffee travels across a room by the diffusion of flavor molecules through the air. A drop of soy sauce spreads in a bowl of clear soup by diffusion, too. It is known that the rate of particle movement by diffusion is proportional to the concentration gradient. If the electron concentration is not uniform, there will be an electron diffusion current, which is proportional to the gradient of the electron concentration.
J n, diffusion ∝ dn ------
(2.3.1)
dn J n, diffusion = qDn ------dx
(2.3.2)
dx
We have introduced the proportional constant qDn. q is the elementary charge (+1.6 × 10⁻¹⁹ C), and Dn is called the electron diffusion constant. The larger the Dn Higher particle concentration
Lower particle concentration
Direction of diffusion
FIGURE 2–9 Particles diffuse from high-concentration locations toward low-concentration locations.
Hu_ch02v3.fm Page 47 Thursday, February 12, 2009 12:22 PM
2.4
●
Relation Between the Energy Diagram and V, Ᏹ
p
n
x
x
Electron flow
Hole flow
Current flow (a)
Current flow (b)
FIGURE 2–10 A positive slope of carrier concentration produces a positive electron diffusion current (a), but a negative hole diffusion current (b).
is, the faster the electrons diffuse. In Section 2.4, we will see what determines Dn. For holes, dp (2.3.3) J p, diffusion = – q D p ------dx Equation (2.3.3) has a negative sign, while Eq. (2.3.2) has a positive sign. Instead of memorizing the signs, memorize Fig. 2–10. In Fig. 2–10, (a) shows a positive dn/dx (n increases as x increases) and (b) shows a positive dp/dx. In (a), electrons diffuse to the left (toward the lower concentration point). Because electrons carry negative charge, the diffusion current flows to the right. In (b), holes diffuse to the left, too. Because holes are positively charged, the hole current flows to the left, i.e., the current is negative. In general, both drift and diffusion may contribute to the current. Therefore, dn J n = J n, drift + J n, diffusion = qn µ n Ᏹ + qDn ------dx dp J p = J p, drift + J p, diffusion = qp µ p Ᏹ – qD p ------dx J = Jn + Jp
(2.3.4) (2.3.5) (2.3.6)
2.4 ● RELATION BETWEEN THE ENERGY DIAGRAM AND V, Ᏹ ● When a voltage is applied across a piece of semiconductor as shown in Fig. 2–11a, it alters the band diagram. By definition, a positive voltage raises the potential energy of a positive charge and lowers the energy of a negative charge. It therefore lowers the energy diagrams since the energy diagram plots the energy of an electron (a negative charge). Figure 2–11c shows that the energy diagram is lower (at the left) where the voltage is higher. The band diagram is higher where the voltage is lower. (Ec and Ev are always separated by a constant, Eg .) The point to remember is that Ec and Ev vary in the opposite direction from the voltage. Ec and Ev are higher where the voltage is lower. That is to say E c ( x ) = cons tan t – qV ( x )
(2.4.1)
47
Hu_ch02v3.fm Page 48 Thursday, February 12, 2009 12:22 PM
48
Chapter 2
●
Motion and Recombination of Electrons and Holes
0.7 V
Ᏹ ⫹
⫺
Si (a)
V(x)
0.7 V x 0 (b)
⫺
Ec(x) EF(x)
Ev(x) 0.7 V
⫹
x (c)
FIGURE 2–11 Energy band diagram of a semiconductor under an applied voltage. 0.7 eV is an arbitrary value.
The q takes care of the difference between the units, eV and V. The “constant” takes care of the unspecified and inconsequential zero references for Ec and V. The “constant” drops out when one considers the electric field. 1 dE 1 dE dV Ᏹ ( x ) ≡ – -------- = --- ---------c- = --- ---------vq dx q dx dx
(2.4.2)
In other words, the slope of Ec and Ev indicates the electric field. The direction of Ᏹ in Fig. 2–11c is consistent with Eq. (2.4.2). Figure 2–11c suggests the following analogies: the electrons roll downhill like stones in the energy band diagram and the holes float up like bubbles.
2.5 ● EINSTEIN RELATIONSHIP BETWEEN D AND µ ● Consider a bar of semiconductor, whose band diagram is shown in Fig. 2–12. The semiconductor is at equilibrium, and therefore the Fermi level EF is constant (Section 1.7). The left side is more heavily doped than the right side, and so Ec is
Hu_ch02v3.fm Page 49 Thursday, February 12, 2009 12:22 PM
2.5
●
Einstein Relationship Between D and µ
Ec(x) EF
Ev(x)
N-type semiconductor bar Decreasing donor concentration
FIGURE 2–12 A piece of N-type semiconductor in which the dopant density decreases toward the right.
closer to EF on the left side. Because Ec is not a constant, there is an electric field equal to (1/q) dEc/dx, according to Eq. (2.4.2). This field is internally created and is as real as a field created by an external voltage. Because the semiconductor is at equilibrium, there cannot be any Jn (or Jp). From Eq. (2.3.4), dn J n = 0 = qn µ n Ᏹ + qD n ------dx
(2.5.1)
Recall Eq. (1.8.5) n = Nc e
–( Ec – EF ) ⁄ kT
– N –( Ec– EF ) ⁄ kT dE c dn ---------------- = ----------c e dx kT dx
(1.8.5) (2.5.2)
– n dE = ------- ---------ckT dx
(Eq.(1.8.5) is used)
(2.5.3)
–n = -------qᏱ kT
(Eq.(2.4.2) is used)
(2.5.4)
dn/dx in Eq. (2.5.1) will now be substituted with Eq. (2.5.4) qD 0 = qn µ n Ᏹ – qn ----------n- Ᏹ kT
∴
kT D n = ------- µ n q
(2.5.5)
(2.5.6a)
The electron drift and diffusion currents will perfectly cancel each other out for an arbitrary doping profile, if and only if Eq.(2.5.6a) is satisfied. This remarkably simple relationship between the diffusion constant, Dn, and mobility was derived by Albert Einstein. A close relationship between µ and D becomes plausible when one realizes that all scattering mechanisms (e.g. phonon and
49
Hu_ch02v3.fm Page 50 Thursday, February 12, 2009 12:22 PM
50
Chapter 2
●
Motion and Recombination of Electrons and Holes
impurity scatterings) that impede electron drift would also impede electron diffusion. Equation (2.5.6a) and its counterpart for holes kT D p = ------- µ p q
(2.5.6b)
are known as the Einstein relationship. EXAMPLE 2–4
Diffusion Constant
What is the hole diffusion constant in a piece of silicon doped with 3 × 1015cm–3 of donors and 7 × 1015cm–3 of acceptors at 300 K? at 400 K? that, for Nd + Nd = 3 × 10¹⁵ + 7 × 1015 = 1 × cm2/V·s at 300 K. Dp = (kT/q)µ p = 26 mV × 410cm /V·s = 11cm /s. Do you remember kT/q = 26 mV at room temperature? For the 400 K case, we turn to Fig. 2–6, which shows for N =1016cm–3 and T = 127oC, µp = 220 cm2/V·s. SOLUTION: Figure 2–5 shows 1016cm–3, µp is about 410 2 2
Dp = µp(kT/q) = 220cm2/V·s × 26 mV × (400 K/300 K) = 7.6cm2/V·s.
2.6 ● ELECTRON–HOLE RECOMBINATION ● The electron and hole concentrations introduced in Chapter 1 (for example, n = Nd and p = ni2 /Nd for an N-type sample) are the equilibrium carrier concentrations and they will be denoted with n0 and p0 from now on. The electron and hole concentrations can be different from n0 and p0, for example, when light shines on the sample and generates electrons and holes (as shown in Fig. 1–12). The differences are known as the excess carrier concentrations denoted by n ′ and p ′ . n ≡ n0 + n ′
(2.6.1a)
p ≡ p0 + p ′
(2.6.1b)
If n ′ and p ′ are created by light, n ′ and p ′ are equal because the electrons and holes are created in pairs. If n ′ and p ′ are introduced by other means, they will still be equal to each other because of charge neutrality (Eq. (1.9.1)). Since charge neutrality is satisfied at equilibrium when n ′ = p ′ = 0, any time a non-zero n ′ is present, an equal p ′ must be present to maintain the charge neutrality, and vice versa. Otherwise, the net charge will attract or repel the abundant majority carriers until neutrality is restored. This conclusion for a charge neutral sample can be written as n′ ≡ p′
(2.6.2)
If the light is suddenly turned off, n ′ and p ′ will decay with time until they become zero and n and p return to their equilibrium values, n0 and p0 . The process of decay is recombination, whereby an electron and a hole recombine and annihilate each other. The time constant of the decay is called the recombination time or carrier lifetime, τ.
Hu_ch02v3.fm Page 51 Thursday, February 12, 2009 12:22 PM
2.6
●
Electron–Hole Recombination
dn ′ ′ p′ -------- = – n ----- = – ----dt τ τ
(2.6.3)
The recombination rate (per cubic centimeter n ′ and p ′ . n′ Recombination rate = ----- = τ
per second) is proportional to p′ ----τ
(2.6.4)
τ has the dimension of time and is typically around 1µs in Si. It may range from 1 ns to 1 ms, depending on the density of trace metal impurities such as Au and Pt, which form traps in the band gap with several energy levels deep in the band gap. These deep traps can capture electrons or holes to facilitate recombination (as shown in Fig. 2–13) and thus shorten the recombination time (they are also called recombination centers). Too small a τ is bad for device leakage current, and hence extreme cleanliness is maintained in the semiconductor fabrication plants partly to avoid these metallic contaminants. The other recombination process shown in Fig. 2–13, direct recombination, or radiative recombination, is very inefficient and unimportant in silicon because the electrons and holes at the edges of the band gap do not have the same wave vectors (see Section 1.5.1 and Figure 4–27b). These types of semiconductors are called indirect gap semiconductors. The radiative recombination process is very efficient in direct gap semiconductors such as GaAs because the electrons and holes have the same wave vectors (see Figure 4–27a) and is responsible for light emission in light-emitting diodes and lasers, which will be presented in Chapter 4. Echoes in a canyon eventually die out. So do ripples produced by a cast stone. Nature provides ways to restore equilibrium. Recombination is nature’s way of restoring n ′ and p ′ to zero. Ec Direct recombination
Recombination through traps
Ev
FIGURE 2–13 An electron–hole pair recombines when an electron drops from the conduction band into the valence band. In silicon, direct recombination is unimportant and the lifetime is highly variable and determined by the density of recombination centers. EXAMPLE 2–5
Photoconductors
A bar of Si is doped with boron at 1015cm–3. It is exposed to light such that electron–hole pairs are generated throughout the volume of the bar at the rate of 1020/s·cm3. The recombination lifetime is 10 µs. What are (a) p0, (b) n0, (c) p ′ , (d) n ′ , (e) p, (f) n, and (g) the np product? (h) If the light is suddenly turned off at t = 0, find n ′ ( t ) for t > 0. SOLUTION:
a. p0 = Na = 1015cm–3 is the equilibrium hole concentration. b. n0 = ni2/p0 ≈ 105cm–3 is the equilibrium electron concentration.
51
Hu_ch02v3.fm Page 52 Thursday, February 12, 2009 12:22 PM
52
Chapter 2
●
Motion and Recombination of Electrons and Holes
c. In steady state, the rate of generation is equal to the rate of recombination (Eq. (2.6.4)). 1020/s·cm3 = p ′ /τ
∴ p ′ = 1020/s·cm3·t = 1020/s·cm3·10–5s = 1015cm–3 d. n ′ = p ′ = 1015cm–3 (Eq. (2.6.2)) e. p = p0 + p ′ = 1015cm–3 + 1015cm–3 = 2 × 1015cm–3 f. n = n0 + n ′ = 105cm–3 + 1015cm–3 ≈ 1015cm–3. The non-equilibrium minority carrier concentration is often much much larger than the small equilibrium concentration. g. np ≈ 2 × 1015cm–3 × 1015cm–3 = 2 × 1030cm–6 >> ni2 = 1020cm–6. The np product can be very different from ni2. h. The solution to Eq. (2.6.4) is n′(t) = n′(0)e
–t ⁄ τ
15
–3 –t ⁄ τ
= 10 cm e
Therefore, n ′ decays exponentially toward its equilibrium value of zero. The characteristic time of the exponential decay is the carrier lifetime, τ.
2.7 ● THERMAL GENERATION ● The reverse process of recombination is called thermal generation. At any nonzero temperature, electron–hole pairs are constantly being generated and lost (by recombination). If n ′ = p ′ = 0, the rate of recombination equals the rate of generation and the net rate of change is zero. If n ′ is positive, there is a net recombination rate as shown in Eq. (2.6.4). If n ′ is negative, i.e., there are fewer electrons than the equilibrium concentration, nature sees to it that there is a net rate of thermal generation rather than recombination. Equation (2.6.3) confirms this fact by predicting a positive d n ′ /dt. Later we will see that thermal generation is responsible for the leakage current in diodes. When the np product is equal to ni2, the rate of thermal generation is equal to the rate of recombination. Under this condition, n and p are said to be at thermal equilibrium. When np > ni2, there is net recombination; when np < ni2, there is net generation. The terms recombination and generation rates generally refer to the net rates of recombination and generation.
2.8 ● QUASI-EQUILIBRIUM AND QUASI-FERMI LEVELS ● 2
Whenever np ≠ n i , the semiconductor is not at equilibrium. More precisely, the electrons and holes are not at equilibrium with each other. Nonetheless, we would like to preserve and use, as much as possible, the following equilibrium relationships, which we have found to be very useful.
Hu_ch02v3.fm Page 53 Thursday, February 12, 2009 12:22 PM
2.8
n = Nce p = Nve
●
Quasi-Equilibrium and Quasi-Fermi Levels
–( Ec – EF ) ⁄ kT
(1.8.5)
–( EF – Ev ) ⁄ kT
(1.8.8)
The problem is that the above equations, when multiplied together, lead to np = ni2. We saw in Example 2-5(g) that the presence of excess carriers can easily make the np product much larger than ni2. This problem can be addressed by introducing two quasi-Fermi levels, EFn and EFp , such that n = Nc e p = Nve
–( Ec – EFn ) ⁄ kT –( EFp – Ev ) ⁄ kT
(2.8.1) (2.8.2)
EFn and EFp are the electron and hole quasi-Fermi levels. When electrons and holes are at equilibrium, i.e., when np = ni2, EFn and EFp coincide and this is known as EF. Otherwise, EFn ≠ EFp. Equations (2.8.1) and (2.8.2) indicate that even when electrons and holes, as two groups, are not at equilibrium with each other, the electrons (and holes) can still be at equilibrium among themselves. Electrons and holes, as two groups of particles, can get out of equilibrium easily because they are only loosely coupled by the recombination/generation mechanism, which is a slow process (has a long time constant around 1 µs). In contrast, the electrons (or holes) are strongly coupled among themselves by exchanging positions and energy through thermal motion at high speed and by scattering with 0.1 ps mean free time. The usefulness of this quasi-equilibrium concept will become clear in later applications. EXAMPLE 2–6
Quasi-Fermi Levels and Low-Level Injection
Consider an Si sample with Nd = 1017cm–3. a. Find the location of EF. b. Find the location of EFn and EFp when excess carriers are introduced such that n ′ = p ′ = 1015cm–3. Notice that n ′ and p ′ are much less than the majority carrier concentration. This condition is commonly assumed and is called low-level injection. The opposite condition, high-level injection, is often encountered in bipolar transistors (Section 8.4.4). SOLUTION:
a. Using Eq. (1.8.5) 17
n = N d = 10 cm
–3
= Nce
–( Ec – EF) ⁄ kT
19 –3 Nc 2.8 × 10 cm - = 26 meV ⋅ ln ------------------------------------- = 0.15 eV E c – E F = kT ln ----------------------17 –3 17 –3 10 cm 10 cm
EF is below Ec by 0.15 eV.
53
Hu_ch02v3.fm Page 54 Thursday, February 12, 2009 12:22 PM
54
Chapter 2
●
Motion and Recombination of Electrons and Holes
17
b. n = n 0 + n ′ = N d + n ′ = 1.01 × 10 cm Using Eq. (2.8.1), 17
1.01 × 10 cm
–3
= Nce
–3
–( Ec – EFn ) ⁄ kT
19 –3 Nc 2.8 × 10 cm = 26 meV ⋅ ln ---------------------------------------- = 0.15 eV E c – E Fn = kT ln ---------------------------------------17 –3 17 –3 1.01 × 10 cm 1.01 × 10 cm
EFn is basically unchanged from the EF in (a) as illustrated in Fig. 2–14. 2
ni 3 –3 15 –3 15 –3 - + p ′ = 10 cm + 10 cm = 10 cm p = p 0 + p ′ = -----Nd Using Eq. (2.8.2) 15
10 cm
–3
= Nve
–( EFp – Ev ) ⁄ kT
19 –3 Nv 1.04 × 10 cm - = 26 meV ⋅ ln ---------------------------------------- = 0.24 eV E Fp – E v = kT ln ----------------------15 –3 15 –3 10 cm 10 cm
0.15 eV Ec EF EFn EFp
0.24 eV Ev
FIGURE 2–14 Location of EF, EFn, and EFp.
2.9 ● CHAPTER SUMMARY ● In the presence of an electric field, charge carriers gain a drift velocity and produce a drift current density in proportion to Ᏹ; vp = µpᏱ
(2.2.3a)
vn = –µnᏱ
(2.2.3b)
J p, drift = qp µ p Ᏹ
(2.2.11)
J n, drift = qn µ n Ᏹ
(2.2.12)
µp and µ n are called the hole and electron mobility. They are determined by how frequently the carriers collide with phonons or dopant ions and lose their drift
Hu_ch02v3.fm Page 55 Thursday, February 12, 2009 12:22 PM
2.9
●
Chapter Summary
momentum. Mobilities are functions of temperature and the total dopant concentration. Measured mobility data are routinely presented in figures. The second important transport mechanism is diffusion. Diffusion current density is proportional to the gradient of the carrier concentration. dn J n, diffusion = qDn ------dx dp J p, diffusion = – q D p ------dx
(2.3.2) (2.3.3)
Dn and Dp are the electron and hole diffusion constants. Both drift and diffusion are perturbations to the same thermal motion, and both are slowed down by the same collisions that are responsible for the zigzag paths of the thermal motion. As a result, D and µ are related by the Einstein relationship: kT D n = ------- µ n q kT D p = ------- µ p q
(2.5.6a) (2.5.6b)
The sum of Jdrift and Jdiffusion is the total current density. The minority carrier concentration, e.g., p in an N-type semiconductor, can easily be increased from its equilibrium concentration p0 by orders of magnitude with light or by another means to be presented in Chapter 4, so that p ≡ p 0 + p ′ >> p 0
(2.6.1b)
p ′ is the excess hole concentration. In a charge neutral region, n′ ≡ p′
(2.6.2)
Charge nonneutrality will generate an electric field that causes the majority carriers to redistribute until neutrality is achieved. The electron–hole recombination rate is proportional to n ′ (= p ′ ): n′ p′ Recombination rate = ----- = ----τ τ
τ is the recombination lifetime and ranges from nanoseconds to milliseconds for Si, depending on the density of trace metal impurities that form deep traps. When excess minority carriers are present, the pn product can be orders of magnitude larger than ni2. Clearly, electrons and holes as two groups of particles are not at equilibrium with each other. Within each group, however, the carriers are still at equilibrium among themselves and share one common (quasi) Fermi level at different locations. This situation is called quasi-equilibrium and the following relationships are useful: n = Nce p = Nve
–( Ec – EFn ) ⁄ kT –( EFp – Ev ) ⁄ kT
EFn and EFp are the quasi-Fermi levels of electrons and holes.
(2.8.1) (2.8.2)
55
Hu_ch02v3.fm Page 56 Thursday, February 12, 2009 12:22 PM
56
Chapter 2
●
Motion and Recombination of Electrons and Holes
● PROBLEMS ● ● Mobility ●
2.1
(a) For an electron mobility of 500 cm²/V·s, calculate the time between collisions. (Take mn = m0 in these calculations.) (b) For an electric field 100 V/cm, calculate the distance an electron travels by drift between collisions.
2.2
An electron is moving in a piece of very lightly doped silicon under an applied field such that its drift velocity is one-tenth of its thermal velocity. Calculate the average number of collisions it will experience in traversing by drift a region 1 µm long. What is the voltage across this region?
2.3
The electron mobility is determined by collisions that come in two flavors: (1) scattering due to phonons (lattice vibrations) and (2) scattering due to ionized impurities. The mobilities from phonon interactions alone, µ1, and from ionized impurities alone µ2, depend on the electron effective mass mn, ionized impurity density Ni, and temperature as follows: –70
2 5⁄2 3⁄2 2.2 × 10 µ 1 = -------------------------- k g K cm ⁄ ( V ⋅ s ) 5⁄2 3⁄2 mn T 3⁄2
3⁄2 1⁄2 7.45T µ 2 = ----------------------- k g ⁄ ( cm ⋅ K ⋅ V ⋅ s) 1⁄2 mn Ni
Consider a uniformly doped N-type semiconductor with Nd = 1017cm–3 and mn = 0.27m0. (a) Make a plot of log( µ 1 ) and log( µ 2 ) versus temperature from 100 to 700 K. (b) What is the total electron mobility at 300 K? (c) Calculate the electron drift current density if the sample is biased as shown in Fig. 2–15 (T = 300 K): 1 nm N
1V
FIGURE 2–15 ● Drift ●
2.4
Phosphorus donor atoms at a concentration of 1016cm–3 are distributed uniformly throughout a silicon sample. (a) What is the sample resistivity at 300 K? (b) If 1017cm–3 of boron is included in addition to the phosphorus, what is the resulting resistivity and conductivity type (N-type or P-type material)? (c) Sketch the energy band diagram for part (a) and for part (b) and show the position of the Fermi level.
Hu_ch02v3.fm Page 57 Thursday, February 12, 2009 12:22 PM
Problems
2.5
An N-type silicon sample has a uniform density Nd = 1017cm–3 of arsenic, and a P-type sample has Na = 1015cm–3. A third sample has both impurities present at the same time. (a) Find the equilibrium minority carrier concentrations at 300 K in each sample. (b) Find the conductivity of each sample at 300 K. (c) Find the Fermi level in each material at 300 K with respect to either the conduction band edge (Ec) or the valence band edge (Ev).
2.6
(a) A silicon sample maintained at T = 300 K is uniformly doped with Nd = 1016cm–3 donors. Calculate the resistivity of the sample. (b) The silicon sample of part (a) is “compensated” by adding Na = 1016cm–3 acceptors. Calculate the resistivity of the compensated sample. (Exercise caution in choosing the mobility values to be employed in this part of the problem.) (c) Compute the resistivity of intrinsic (Na = 0, Nd = 0) silicon at T = 300 K. Compare it with the result of part (b) and comment.
2.7
A sample of N-type silicon is at the room temperature. When an electric field with a strength of 1000 V/cm is applied to the sample, the hole velocity is measured and found to be 2 × 105 cm/sec. (a) Estimate the thermal equilibrium electron and hole densities, indicating which is the minority carrier. (b) Find the position of EF with respect to Ec and Ev. (c) The sample is used to make an integrated circuit resistor. The width and height of the sample are 10 µm and 1.5 µm, respectively, and the length of the sample is 20 µm. Calculate the resistance of the sample.
● Diffusion ●
2.8
A general relationship for the current density carried by electrons of density n is J = qnv, where q is the electronic charge and v is the electron velocity. (a) Find the velocity of electrons, v(x), that are moving only by diffusion if they have a density distribution of n ( x ) = n 0 exp ( – x ⁄ λ ) . The electric field is zero.
(b) What would be the electric field, Ᏹ(x), that would lead to an electron drift velocity equal to that of the diffusion velocity in part (a)?
(c) At 300 K, what value of λ would make the field in part (b) to be 1000 V/cm? 2.9
Figure 2–16 is a part of the energy band diagram of a P-type semiconductor bar under equilibrium conditions (i.e., EF is constant). The valence band edge is sloped because doping is nonuniform along the bar. Assume that Ev rises with a slope of ∆ ⁄ L . EF Ev ⌬
0
L
x
FIGURE 2–16 (a) Write an expression for the electric field inside this semiconductor bar. (b) Within the Boltzmann approximation, what is the electron concentration n(x) along the bar? Assume that n(x = 0) is n0. Express your answer in terms of n0, ∆ , and L.
57
Hu_ch02v3.fm Page 58 Thursday, February 12, 2009 12:22 PM
58
Chapter 2
●
Motion and Recombination of Electrons and Holes
(c) Given that the semiconductor bar is under equilibrium, the total electron and hole currents are individually zero. Use this fact and your answers to parts (a) and (b) to derive the Einstein relation (Dn/µn = kT/q) relating electron mobility and diffusion constant.
● REFERENCES ● 1. Baccarani, G., and P. Ostoja. “Electron Mobility Empirically Related to the Phosphorus Concentration in Silicon.” Solid State Electronics, 18, 1975, 579. 2. Antoniadis, D. A., A. G. Gonzalez, and R. W. Dutton. “Boron in Near-Intrinsic and Silicon Under Inert and Oxidizing Ambients—Diffusion and Segregation,” J. Electrochem. Soc.: Solid-State Science and Technology, 5, 1978, 813. 3. Beadle, W. E., J. C. C. Tsai, and R. D. Plummer. Quick Reference Manual for Silicon Integrated Circuit Technology. New York: John Wiley & Sons, 1985. 2–22, 2–23, 2–27. 4. Sze, S. M. Semiconductor Devices. New York: Wiley, 1985, 33.
● GENERAL REFERENCES ● 1. Neamen, D. A. Semiconductor Physics and Devices, 3rd ed. New York: McGraw-Hill, 2003. 2. Pierret, R. F. Semiconductor Device Fundamentals. Reading, MA: Addison-Wesley, 1996. 3. Sze, S. M. Semiconductor Devices. New York: Wiley, 1985.