MONTENEGRIN JOURNAL OF ECONOMICS Volume 10 Number 1 July 2014 UDC 33 (51) Print edition ISSN 1800-5845 Web edition ISSN 1800-6698 COBISS.CG-ID 9275920
Publishers ELIT - Economic Laboratory for Transition Research Dz. Vashington 4/5, Podgorica, Montenegro
Faculty of Economics, Podgorica, Montenegro
Indexing Papers published in journal Montenegrin Journal of Economics since September 2006 are abstracted in the Journal of Economics Literature, Pittsburgh, the AEA (American Economic Association) electronic index, involved in JEL CD, e-JEL, http://www.EconLit.org and WWW.AEAweb.org http://www.aeaweb.org/econlit/journal_list.php?full=true#M Since April 2011 Papers are abstracted in the EBSCO Publishing, Inc. http://www.ebscohost.com Since December 2011 Montenegrin Journal of Economics has been included in Index Copernicus International S.A. database http://journals.indexcopernicus.com/karta.php?action=masterlist&id=7325 Since February 2012 Montenegrin Journal of Economics has been included in databases: Ulrich's Periodicals Directory http://ulrichsweb.serialssolutions.com/ RePEc http://repec.org/ World-Wide Web Virtual Library http://www.e-journals.org/ Genamics JournalSeek http://journalseek.net Since April 2012 Journal has been included in databases: Cabell's http://www.cabells.com ECONIS Datenbank http://www.econis.eu NewJour http://old.library.georgetown.edu/newjour//nj2/msg29741.html Since September 2012 Journal has been included in databases: DOAJ Directory of Open Access Journals http://www.doaj.org ProQuest ( ABI/Inform, Research Library, Social Sciences ) http://www.proquest.co.uk Scirus http://www.scirus.com/srsapp/search?q=%22montenegrin+journal+of+economics%22+&t=all&sort=0&g=s
2
MONTENEGRINJOURNAL JOURNALOFOFECONOMICS, ECONOMICS,Vol. Vol.9,10, 1 (July 2014) MONTENEGRIN No.No. 4 (December 2013)
Editor in Chief Professor Veselin Draskovic
University of Montenegro, Faculty of Maritime Studies Kotor, Montenegro
Associate Editors Professor Yochanan Shachmurove
The City College of the City University of New York, Department of Economics and Business, USA
Professor Lloyd Blenman
University of North Carolina-Charlotte, President at Midwest Finance Education Foundation, USA
Professor Radislav Jovovic
University Mediterranean, Faculty of Business Studies, Montenegro
Associate Editor and Journal Administrator Associate Professor Oleksandr Dorokhov Kharkiv National University of Economics, Faculty of Economic Informatics, Ukraine Advisory Board Professor Harry M. Markowitz Nobel Laureate Professor Oliver E. Williamson, Nobel Laureate
Rady School of Management at the University of California, USA University of California, Berkeley, USA
Professor Shachmurove Yochanan
The City College of the City University of New York, Department of Economics and Business, USA
Professor Polterovich Victor
Central Economics and Mathematics Institute, Russian Academy of Science and Moscow School of Economics / Lomonosov's Moskow State University, Russia
International Editorial Board Professor Serguei Aivazian
Central Economics and Mathematics Institute of the Russian Academy of Sciences / Lomonosov's Moscow State University, Russia
Associate Professor István Benczes
Corvinus University of Budapest, Faculty of Economics, Hungary
Professor Bolesław Borkowski
SGGW Warsaw, Faculty of Applied Informatics and Mathematics, Department of Econometrics and Statistics, Poland
Professor Laszlo Csaba
Central European University, Department of International Relations and European Studies, Budapest / Budapest University of Economic Sciences and Public Administration, Hungary
Professor Michael Doubrovsky
Odessa National Maritime University, Ukraine
Professor Fan Gang
Graduate School of Chinese Academy of Social Sciences (CASS) / China's National Economic Research Institute (NERI), China
Professor Yuriy Gavrilec
Central Economics and Mathematics Institute of the Russian Academy of Sciences, Russia
Professor Wei Ge
Bucknell University, Department of Economics, Lewisburg, USA
Professor Balazs Hamori
Corvinus University of Budapest, Hungary
Professor Yu Hsing
Southeastern Louisiana University, College of Business, Hammond, LA, USA
Professor Wen-jen Hsieh
University Road, Tainan / Art Center National Cheng Kung University, Taiwan
Professor Salih Kaya
Ankara University, Turkey
Professor Svetlana Kirdina
Institute of Economics Russian Academy of Sciences, Russia
Professor George Kleiner
Central Economics and Mathematics Institute of the Russian Academy of Sciences, Russia
Professor Grzegorz Kolodko
Kozminski University in Warsaw (ALK) / Director of TIGER, Poland
Professor Valeriy Makarov
Central Economics and Mathematics Institute of the Russian Academy of Sciences/ Lomonosov's Moscow State University / New Economic School, Rusaia
Professor Vladimir Matveenko
National Research University Higher School of Economics, St. Petersburg, Russia
Professor Alojzy Nowak
University of Warsaw, Faculty of Management, Poland
Professor Yuriy Osipov
Lomonosov's Moscow State University, Faculty of Economics, Russia
Professor Jiancai Pi
School of Business, Nanjing University, China
Professor Evgeniy Popov
Institute of Economics, Urals Branch of Russian Academy of Sciences, Ekaterinburg, Russia
Professor Uriel Spiegel
Bar-Ilan University, Faculty of Social Sciences, Ramat-Gan, Israel
Professor Theodore Tsekeris
Centre of Planning and Economic Research (KEPE), Athens, Greece
Professor Merih Uctum
The Graduate Center City University of New York, USA
Professor Giurca Laura Vasilescu
University of Craiova, Faculty of Economy and Business Administration, Romania
Professor João Paulo Vieito
Polytechnic Institute of Viana do Castelo, Portugal
Assistant Professor Milos Vulanovic
Western New England University Springfield, USA
Assistant Professor Eric Wdoviak
Farmingdale State College, New York, USA
Professor Bagrat Yerznkyan
Central Economics and Mathematics Institute, Russian Academy of Science / State University of Management Moscow, Russia
MONTENEGRIN JOURNAL OF ECONOMICS, Vol. 10, No. 1 (July 2014)
Regional Editorial Board Professor Slobodan Acimovic
University of Belgrade, Faculty of Economics, Serbia
Professor Marko Backovic
University of Belgrade, Faculty of Economics, Serbia
Associate Professor Sanja Bauk
University of Montenegro, Faculty of Maritime Studies Kotor, Montenegro
Assistant Professor Mimo Draskovic
University of Montenegro, Faculty of Maritime Studies Kotor, Montenegro
Professor Gordan Druzic
Croatian Academy of Sciences and Arts, Croatia
Associate Professor Nikola Fabris
University of Belgrade, Faculty of Economics, Serbia
Professor Miomir Jaksic
University of Belgrade, Faculty of Economics, Serbia
Assistant Professor Borut Jereb
University of Maribor, Faculty of Logistics Celje, Slovenia
Associate Professor Milorad Jovovic
University of Montenegro, Faculty of Economics, Montenegro
Professor Vesna Karadzic
University of Montenegro, Faculty of Economics, Podgorica, Montenegro
Associate Professor Slobodan Lakic
University of Montenegro, Faculty of Economics, Montenegro
Associate Professor Milan Lakicevic
University of Montenegro, Faculty of Economics, Montenegro
Professor Vujica Lazović
University of Montenegro, Faculty of Economics, Montenegro
Professor Andjelko Lojpur
University of Montenegro, Faculty of Economics, Montenegro
Professor Tihomir Lukovic
University of Dubrovnik, Croatia
Professor Emeritus Ljubomir Madzar
Institute of strategic studies and development „Petar Karić“ of the Alfa University in Novi Beograd, Serbia
Professor Joze Mencinger
University of Ljubljana, Law School, Slovenia
Associate Professor Milivoje Radovic
University of Montenegro, Faculty of Economics, Montenegro
Professor Ivan Ribnikar
University of Ljubljana, Faculty of Economics, Slovenia
Professor Guste Santini
University of Zagreb, Croatia
Assistant Professor Ivo Speranda
University of Dubrovnik – Department of Economics and Business Economics, Croatia
Professor Dragoljub Stojanov
University of Rijeka, Faculty of Economics, Croatia
Secretary of Editorial Boards Associate professor Mimo Draskovic
University of Montenegro, Faculty of Maritime Studies Kotor, Montenegro
Technical editor Milojko Pusica, B. Sc. ing. electrotecnics „Tangenta“ Niksic, Montenegro
3
4
MONTENEGRIN JOURNAL OF ECONOMICS, Vol. 10, No. 1 (July 2014)
The journal is published two times a year Price for single copy: 30 € Printing: 500 copy Journal customer service: Tel: + 382 68 688 888; + 382 68 583 622; E-mail:
[email protected] Web address: http://www.mnje.com Account: 510-21341-37 (Crnogorska komercijalna banka, Podgorica, Montenegro) Printed by : „3M Makarije“ - Podgorica Rješenjem Ministarstva kulture i medija br. 05-962/2 od 23. maja 2005. godine Montenegrin Journal of Economics je upisan u evidenciju medija pod rednim brojem 560.
CIP – Каталогизација у публикацији Централна народна библиотека Црне Горе 33 (051) MONTENEGRIN Journal of Economics / glavni i odgovorni urednik, Editor in Chief -Veselin Drašković. – God. 1. br. 1 (2005) . – Nikšić (Novaka Ramova 12) : “ELIT – ekonomska laboratorija za istraživanje tranzicije”, 2005 (Podgorica: 3M Makarije) . – 30 cm Dva puta godišnje. ISSN 1800-5845 = Montenegrin Journal of Economics COBISS.CG-ID 9275920
ISSN 1800-5845
9 771800 584007
MONTENEGRIN JOURNAL OF ECONOMICS, Vol. 10, No. 1 (July 2014)
5
Contents THE TRANSACTION COST ECONOMICS PROJECT Oliver E. Williamson .....................................................................................................................
7
THE POST-SOCIALIST TRANSITION THROUGH THE PRISM OF O. WILLIAMSON’s INSIGHT Milica Delibasic .............................................................................................................................
13
COMPETITIVENESS IN HIGHER EDUCATION IN TERMS OF THE LEVEL OF STUDENTS' SATISFACTION WITH E-LEARNING IN BLENDED ENVIRONMENT Sanja Bauk, and Jasmin Jusufranic .............................................................................................
25
RELATIONSHIP BETWEEN THE SCHOOL PRINCIPAL LEADERSHIP STYLE AND TEACHERS’ JOB SATISFACTION IN SERBIA Ivana Josanov-Vrgovic, and Nebojsa Pavlovic ...........................................................................
43
CREDIT DEFAULT SWAP (CDS) SPREADS: THE ANALYSIS OF TIME SERIES FOR THE INTERACTION WITH THE INTEREST RATES AND THE GROWTH IN TURKISH ECONOMY Bilal Kargi ...........................................................................................................................................
59
TESTING THE EXISTENCE AND STABILITY OF PHILLIPS CURVE IN ROMANIA Mihaela Simionescu .....................................................................................................................
67
STRATEGIC IMAGE OF DEVELOPMENT OF THE REGIONAL SOCIAL INFRASTRUCTURE IN RUSSIA Olga Ulyanova, and Sergey Yaschenko .......................................................................................
75
THE TRANSACTION COST ECONOMICS PROJECT MONTENEGRIN JOURNAL OF ECONOMICS, Vol. 10, No. 1 (July 2014), 7-11
7
THE TRANSACTION COST ECONOMICS PROJECT OLIVER E. WILLIAMSON University of California, Berkeley JEL Classification: D23; L14 Received: February 12, 2014 / Accepted: June 11, 2014
My discussion of the Transaction Cost Economics Project is in three parts. Section 1 addresses the question, what is Transaction Cost Economics (TCE)? Section 2 deals with How did I get involved? Section 3 looks to the future.
1. WHAT IS TCE? Unlike textbook economic theory, which implicitly assumed that transaction costs are zero and described the firm as a production function for transforming inputs into outputs according to the laws of technology, TCE views firm and market organization as alternative modes of governance – where governance is the means by which to infuse order, thereby to mitigate conflict and realize mutual gains. TCE furthermore maintains that transaction costs are not zero but are positive. Regrettably, however, the operationalization of positive transaction costs was a long time in the making. Awaiting demonstrations that such costs were consequential, transaction costs were ignored. Thus although Ronald Coase introduced the concept of transaction costs in his 1937 paper on “The Nature of the Firm,” that paper had negligible immediate impact. Instead it was ignored over the interval 1940-1960, during which period mathematical economics flourished. The propensity to be dismissive of transaction costs was challenged in the 1960s, however, by both Coase and Kenneth Arrow. Coase’s 1960 paper on “The Problem of Social Cost” demonstrated that externalities would vanish in a world of zero transaction costs. That is because the parties to transactions that were thought to experience externalities would, given zero transaction costs, recognize the inefficiencies that resided therein and would costlessly bargain to an efficient result to which net gains would accrue. Arrow (1968) used vertical integration to achieve a similar result: “The existence of vertical integration may suggest that the costs of operating competitive markets are not zero, as is usually assumed in our theoretical analysis.” Plainly, both contradictions were embarrassing. But even though positive transaction costs now had to be admitted, it takes a theory to beat a theory. Awaiting such, textbook economics would remain secure. Indeed, invoking positive transaction costs without the benefit of a theory gave the concept of transaction costs a bad name. Operationalizing positive transaction costs posed a challenge. This would become my entre. Contrary to the neoclassical theory of the firm as a production function (a technological construction), I described the firm as a governance structure to be examined in relation to the strengths and weaknesses of alternative modes of governance. The three main modes of governance that would come under examination are markets, hybrids, and hierarchies. TCE maintains that the main problem to be dealt with by organization is that of adaptation and that the main purpose of organization is economizing – where this latter is accom-
8
Oliver E. Williamson
plished by the efficient alignment of modes of governance with the attributes of transactions. Note in this connection that TCE is a more microanalytic project than neoclassical economics – in that the attributes of transactions now need to be ascertained and likewise the syndromes of attributes that describe markets and hierarchies and other modes of governance need to be described. Once these are accomplished, the predicted alignment of transactions with modes of governance proceeds. Yet unmentioned but plainly important are the attributes that are ascribed to human actors. Considerations of rationality and self-interest seeking are both important in this connection. The hyperrationality that is associated with neoclassical economics now gives way to what Herbert Simon describes as “bounded rationality” – where by this he means that human actors are intendedly rational but only limitedly so. A consequence of this is that all complex contracts are unavoidably incomplete. Also, TCE supplants simple self-interest seeking by introducing opportunism. Thus although most people will do what they say and some will do more most of the time, outliers for which the stakes are great are the ones where strategic behavior sets in. Transactions that are supported by specialized investments and are subject to considerable uncertainly are those for which markets give way to hybrids or hierarchies – in that the additional safeguards that are provided by hybrids and hierarchies serve to relieve the incentives to behave strategically in the market if the assets in question are non-redeployable. So how do the efficient alignment predictions of TCE relate to the data? As others have shown and as Steven Tadelis and I document in our recently published paper (2014), TCE is an empirical success story. 2. HOW DID I GET INVOLVED IN THE TCE PROJECT? The five factors that led to my involvement in the TCE project are (1) my unusual college education, (2) the marvels of my years at the Graduate School of Industrial Administration at Carnegie Mellon, (3) my experience as a teacher, (4) my service as Special Economic Assistant to the Head of the Antitrust Division of the U.S. Department of Justice, and (5) my determination to examine vertical integration in organizational (rather than purely technological) terms. 2.1 My undergraduate education I received my bachelor’s degree in engineering from MIT in 1955. Making provision for friction in engineering is akin to introducing transaction costs in economics. Yet there was a yawning difference. Whereas engineering made explicit provision for friction, the economics profession continued to assume that transaction costs were zero in both theory and practice. This I recognized as consequential. By reason of my engineering training I was predisposed to look into and make allowance for positive transaction costs. 2.2 Stanford and Carnegie After working for three years as a project engineer I applied to and was admitted to the PhD program at the Stanford Graduate School of Business. But then a funny thing happened. I took a required course in economics in the Business School and discovered that a lot of my engineering training carried over. My economics teacher picked up on my economics interests and suggested that I take electives in the Economics Department in my second year, which I did and enjoyed. Then another junior appointment to the Business School called my attention to the recently launched PhD program at the Graduate School of Industrial Administration at Carnegie Mellon University. I looked into it, liked what I saw, and transferred to GSIA for my last three years. GSIA was truly a transformative experience.
THE TRANSACTION COST ECONOMICS PROJECT
9
The GSIA program was divided into three parts: economics, organization theory, and operations research. I concentrated mainly on economics and organization theory and found this combination together with the Carnegie ambience to be exhilarating! What I have described as the Carnegie Triple is this: be disciplined, be interdisciplinary (if and as your project has interdisciplinary features), and have an active mind. Ask the question “What’s going on here?” rather than pronounce “This is the law here!” I think of the years 1955 to 1965 as the Camelot Years during which GSIA flourished. Leading edge research was abundant – which is borne out by the fact that four (of the 20) research faculty at GSIA would later receive Nobel Prizes in the Economic Sciences for work done during the Camelot Years. But there is more: four GSIA students from that era would also receive Nobel Prizes. As Jacques Dreze, who was a visitor at GSIA, put it, “Never since have I experienced such intellectual excitement” (1985). Indeed before I graduated from Carnegie I found that I too could produce publishable research – sometimes on novel or controversial subjects. My dissertation, The Economics of Discretionary Behavior is illustrative. 2.3 My early years as a teacher My first appointment upon graduation in 1963 was as an assistant professor in the Economics Department at the University of California, Berkeley. I thought of myself as an applied microeconomist with interests in organization. The field that seemed the best fit for this description was Industrial Organization, in which field I did half of my undergraduate teaching. Although the leaders in that field were content with the basic IO framework and its applications to antitrust and regulation, I discovered what I considered to be flaws. Thus whereas new developments of a technical or mechanical kind were mainly regarded favorably in IO, new organizational developments were viewed skeptically. At best they were lacking in merit and very likely were anticompetitive. I knew otherwise, but to little avail within the IO community. 2.4 My year with Antitrust I left Berkeley to accept an appointment as a non-tenured associate professor of economics at the University of Pennsylvania in 1965, where I found that the study of organization received a more favorable treatment. With the approval of the Chair of the Economics Department, I took leave in my second year at Penn to serve as Special Economic Assistant to the Head of the Antitrust Division of the U.S. Department of Justice. This was a fascinating job with an extraordinary number of talented lawyers – as with the Head of the Antitrust Division, Donald Turner, his Special Legal Assistant, Steven Breyer (now a judge in the U.S. Supreme Court), Richard Posner (in the Solicitor General’s office), and the list went on and on. All of this talent notwithstanding, there was a serious problem: the economic reasoning to which they subscribed was the defective Industrial Organization literature that I have been referring to. 2.5 Teaching is learning Upon discovering that the leadership of the Antitrust Division had little respect for the economic benefits that often accrued to organizational innovation, I resolved to examine vertical integration from a transaction cost economics perspective when I returned to the University of Pennsylvania in 1967. I began by organizing a seminar on vertical integration where the students and I went through the literature exhaustively. Finding that little attention was paid to organizational effects, I decided to undertake such a project myself.
10
Oliver E. Williamson
My paper “The Vertical Integration of Production: Market Failure Considerations” was published in the American Economic Review in 1971. I used a contractual approach to examine vertical integration by focusing on transaction cost differences between markets and hierarchies that arose by reason of varying transactional conditions. The main result is that Vertical Integration – that is, taking transactions out of the market and organizing them within the firm – would realize transaction cost economies as conditions of bilateral dependency between buyers and suppliers built up. Albeit intended as a one-shot paper, in that I expected to return to my usual applied microeconomics research, I discovered that thinking in a comparative contractual and more microanalytic way was applicable to many issues. What I now refer to as Transaction Cost Economics was on its way. Student responses to this new way of thinking about contract and economic organization were generally good, especially among my graduate students at Berkeley (to which I returned in 1988). They took the theory and ran with it, usually with good and often with excellent results. They have been a joy to work with – and I expect that the same is true with many of your students as well. 3. WHERE DO WE GO FROM HERE? I should point out in this connection that Transaction Cost Economics has many applications not only within the field of industrial organization but within most applied fields of economics – to include labor, public finance, comparative economic systems, and economic development and reform. Applications to business – to the fields of strategy, organizational behavior, marketing, finance, operations management, and accounting – are likewise numerous. Applications to the contiguous social sciences (especially sociology, political science, social psychology, and aspects of the law) have also been made. Such broad reach arises because any problem that originates as or can be reformulated as a contracting problem can be examined to advantage in transaction cost economizing terms. More such work is doubtlessly in prospect. Especially relevant in this connection are applications to other nation states, of which China is an example. Indeed, Chinese social scientists express keen interest in TCE. Yet there is a problem: the institutional environment in China (and many other countries) is different than in Western Democracies. Relevant in this connection is the fact that the New Institutional Economics divides into two parts. The one is the Institutional Environment, which has been described by Douglass North (1991) as follows: the Institutional Environment describes “the humanly devised constraints that structure political, economic, and social interactions. They consist of both informal constraints (sanctions, taboos, customs, traditions, and codes of conduct) and formal rules (constitutions, laws, property rights). Such matters are often thought of as the rules of the game.” TCE, by contrast, is concerned with the Institutions of Governance, where these describe the “play of the game.” Applications of TCE in China should make provisions for differences in the Institutional Environment. I would add, however, that the while extant rules require respect, realization that some of the rules have adverse consequences on the play of the game could lead to (indeed, has led to) rule reforms. I expect that more work of this kind will be undertaken and, possibly, even flourish. I expect that the same will be the case in Montenegro. REFERENCES Arrow, Kenneth J., 1969. “The Organization of Economic Activity.” In the Analysis and Evaluation of Public Expenditure: The PBB System. Vol. 1, U.S. Joint Economic Committee, U.S. Government Printing Office, pp. 59-73.
THE TRANSACTION COST ECONOMICS PROJECT
1-44.
11
Coase, Ronald H. 1937. “The Nature of the Firm,” Economica N.S., 386-405. ______________. 1960. “The Problem of Social Cost,” Journal of Law and Economics, October, pp.
Dreze, Jacques. 1995. “Forty Years of Public Economics: A Personal Perspective.” Journal of Economic Perspectives, Spring, pp. 111-130. North, Douglass. 1986. “The New Institutional Economics.” Journal of Economic Perspectives. March, pp. 7-17. Simon, Herbert. 1957. Models of Man. John Wiley, New York. Pp. 198-199. Steven Tadelis and Oliver Williamson. 2014. “Transaction Cost Economics.” In The Handbook of Economic Organization (Robert Gibbons and John Roberts, eds.), Princeton University Press, p. 182. Williamson, Oliver. 1964. The Economics of Discretionary Behavior: Managerial Objectives in a Theory of the Firm, Prentice Hall, NJ. ________________. 1971. “The Vertical Integration of Production: Market Failure Considerations,” American Economic Review, May, pp. 112-123.
THE POST-SOCIALIST TRANSITION THROUGH THE PRISM O. WILLIAMSON’s MONTENEGRIN JOURNAL OF OF ECONOMICS, Vol. 10, INSIGHT No. 1 (July 2014), 13-24
13
THE POST-SOCIALIST TRANSITION THROUGH THE PRISM OF O. WILLIAMSON’s INSIGHT Milica Delibasic, International University Travnik ABSTRACT The choice and combination of various forms and mechanisms of economy regulation is the most important, the most complex and the most controversial issue in the post-socialist countries. It results from the problems of wider social regulation (political, institutional, social, moral, cultural, etc.) i.e. from development level of the social capital. Apart from developed countries, dominated by institutional pluralism, many post-socialist countries have opted for neoliberal economic policy, which by definition prefers institutional monism. Therefore, from this aspect, it is interesting to phenomenologically analyze the post-socialist transition seen through the prism of certain arguments of Nobel laureate, O. Williamson. Ignoring the practical differences of the post-socialist neoliberalism (as a quasi-institicional monism) from theoretical neoliberal monistic model, this paper put forward the hypothesis that theoretical understanding of Nobel laureate O. Williamson is on the background of the needs of institutional pluralism, control of opportunistic behavior and cutting transaction costs. This means that they could have (but did not) served the transition reformers in creating the post-socialist economic environment. KEW WORDS: Institutions, New Institutional Economics, Transaction Cost,
JEL classification: D23; P37 Received: February 12, 2014 / Accepted: June 2, 2014
1. INTRODUCTION Conceptual progress of O. Williamson’s New Institutional Economics (NIE) is reflected in analyzing the theory of enterprise as a structural governance, rather than a simple manufacturing function. In his new concept, he explores the problems of existence and reduction of transaction costs in the explicit context of the vertical boundaries of the enterprise, where opportunism is a major threat. Therefore, the task of Transaction Cost Economics (TCE) is to propose adequate management mechanisms, including vertical integration, which provides a greater degree of control over transactional environment and expands as long as it is economically rational to organize the sets of additional internal transactions before market exchange. TCE is based on the following assumptions: a) transactions are performed under conditions of bounded rationality; b) subjects involved in the transaction do not have symmetric information, and they operate under uncertain conditions; and c) at least one of the subjects behaves as an opportunist (i.e. tries to deceive other subjects whenever it is profitable). Williamson shows that TCE can act as a control mechanism over transactional environment only in situations where competitive market is not operating. The market is not competitive when enterprise invests assets as a support to specific set of transactions, and when in such situation an enterprise is under the influence of opportunistic actions by the third party. When invested assets are specific for that set of transactions, the enterprise faces the threat of opportunistic behavior of other party, which tries to negotiate better terms of the agreement. This hazard occurs because the investments that support a set of transactions actually narrows the field of possible alternatives. This problem Williamson considers to be a fundamental transformation that increases the cost of using the market mechanisms.
14
Milica Delibasic
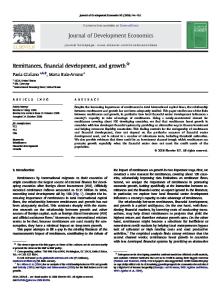
Uncertainty, risk and opportunism may cause market failures, which increase transaction costs. Therefore, an enterprise stops relying on market-based solutions and begins integrating its functions. A high frequency of transactions, a greater degree of uncertainty and greater specificity of assets (capital, knowledge, and skills that in addition to economic also bring so-called quasirents) increase the possibility of corporate decisions to vertically integrate. Otherwise, if the market activity result shows allocative efficiency, the enterprise will not benefit from the internalization of certain functions, and it will not opt for vertical integration. Since enterprise operates in environment full of constraints (resource, human, bureaucratic, institutional and other), Williamson proposes the use of non-standard contracts and alliances. The main goal is development of long-term and strategic relationships between suppliers and customers. He believes that this is the way company economizes, i.e. minimizes transaction costs, to which it is exposed to a greater or lesser extent. Thus, a fundamental transformation leads to a bilateral interdependence in the contract implementation, but also in the process of their reconstruction: in transactions, exchange partners build business and social interdependence, which shape their behavior. Vertical integration and mega-corporations are institutional personification of the profits. Figure 1: Sources of "friction" in the economic system
Source: Author’s adaptation In addition to other interpretations of the entrepreneurial function, O. Williamson has, within the NIE, interpreted an entrepreneur as a subject that makes selection between agreed market relationships and organized enterprise in order to minimize transaction costs. In this way, entrepreneurship may get interpreted, in institutional terms, as a separate and alternative regulatory mechanism, which is different from the price mechanism and state regulation. He explained that economic transactions are more efficient within a firm than between two firms, due to lower transaction costs, which increases the competitiveness. Based on a comparative analysis of the firm efficiency with different types of management structures, he came to the conclusion that the hierarchy is preferred because of unique intrafirm management as a special form of command economy, reducing transaction costs, as well as smaller and simpler strategic implications for adaptation of specific assets (investments) and minimizing opportunism. Therefore, Williamson could be considered to be an economic researcher of non-market economy. Williamson has (1981) observed the institutions as regulators and coordinators of behavior of economic agents, which increase the efficiency of transactions and thus reduce transaction costs through coordination of economic activities, and that is enabled by harmonization of interests between economic subjects (horizontally) or based on a property relations (vertically).
THE POST-SOCIALIST TRANSITION THROUGH THE PRISM OF O. WILLIAMSON’s INSIGHT
15
2. THEORETICAL NOTES Many authors understand institutionalism as a "rebellion" against neo-classical formalism and abstraction, i.e. as an effort in the economic theory to reflect not only the formal abstract model and rigorous logical scheme, but real life and its diversity. After almost unnoticed achievements of the old institutionalism, since the 1970s has begun a fast and productive development in two directions: neoinstitutional and new institutional economics. Regardless of an apparent identity of the name, there are various approaches to the analysis of institutions. What they do have in common, in our opinion, is the multidisciplinary character of institutional analysis, and the fact that they have, as representatives of the Neo and New institutional economics, preserved the essence (core) of neoclassical economics, but significantly corrected, adapted and improved its protective shield. They tried to explain the factors that appear for the neoclassics as external: politics, ideology, norms of behavior , family law, crime, social selection, contracts, etc.. They have changed protection shield with considering a broader range of property types (private, public, collective and mixed), they have introduced the concept of information costs, proving the existence of transaction costs parallely with production costs, etc. The term was not introduced by O. Williamson (1975, p. 1) in economic theory. It was later adopted by many authors (D. North, R. Coase, Alchian A., E. Furubotn, H. Demsetz et al.), who have indicated the deterministic importance of institutions and institutional structure for economic behavior. In an early stage of his research, O. Williamson (Ibid) has emphasized the complementarity of NIE with neoclassical theory: "The new institutional economists both draw on microtheory and, for the most part, in regard to what they are doing as complementary to, rather than substitute for, conventional analysis." However, we believe that, in his later creative oeuvre he mostly did not rely on the neoclassical theory. Although Williamson (1975, p. 4), Coase (1984, p. 231) and North (1995, p. 18) have accepted the principle of the man as being boundedly rational, they have never completely abandoned the neoclassical theory and attitude that NIE represents only "extended neoclassical theory." In this sense, the opinion of D. North's (1995, p. 17) is indicative: "The new institutional economics is an attempt to incorporate a theory of institutions into economics. However, in contrast to the many earlier attempts to overturn or replace neoclassical theory, the NIE builds on, modifies and extends neoclassical theory ... What it abandons is instrumental rationality - the assumption of neoclassical economics that has made it an institutional theory-free." However, we believe that North has indirectly distanced himself from institutional monism, because: a) it supports the view of H. Simon on bounded rationality, because "information is incomplete and there is a limited mental capacity by which to process information", and b) "ideas and ideology play a major role in decision making and transaction cost results in imperfect markets" (Ibid., p. 19). But it should be noted that in many research segments North distanced himself from the neoclassics, primarily advocating better specified property rights, regulatory, stimulating and limiting role of institutions, their interaction with technology, the role of transaction costs in relativization of neoclassical results of efficient (perfect and balanced) markets, accepting the dynamics of institutional and other changes, uncertainty, violence as anti-institutional behavior that significantly reduces the rationality and stability of the system and so on. By marking ideology as the cause of inefficient institutions, he pointed to the contradiction between the problems of collective action and opportunism of the dominant group. Therefore, he indirectly accepted Olson’s argument that within neoclassical approach there is an inconsistency between the rational selfinterest and group activities. Williamson (Ibid.) have pointed out that general terms of the NIE include many "aspects of mainline microtheory, economic history, the economics of property rights, comparative systems, labor economics, and industrial organization", whose research have illuminated the various economic problems through the prism of "transaction" as a key concept. E. Furubotn and R. Richter (1984, p. 3) have stated that basis of the NIE consists of three main directions: Property Rights Economics, Institutional Evolution and Constitutional Choice. According to Nabli and Nugent (1989, p. 10), the NIE includes two salient general approaches: transaction and
16
Milica Delibasic
information costs (including transaction cost economics, property rights approach, and contract theory - for private goods), and theory of collective action - for public goods. Distancing from the neoclassical research, Williamson has focused on the issue of bounded rationality, where opportunistic behavior is influenced by an economic organization. Later, (1985, p. 16) he has introduced transaction cost economics (TCE) as a "part of new institutional economics". He has proposed a hypothetical methodological scheme with three interdependent levels (Figure2), where transactions are implemented. Figure 2: Levels of transactions implementation
Williamson 1995, p. 175. Figure 2. illustrates interaction between the institutional environment1, management structures and individuals in terms of transaction cost theory. These actions are calculated during the implementation of transactions (conditionally: business). The bold diagram arrows correspond to the basic (primary) i.e. the main effects of reciprocal actions, while dashed arrows correspond to feedback effects. Diagram shows that both effects arrows intersect in the field of management structures. In the methodological context, that exactly corresponds to the regulatory function of institutions, which aligns behavioral attributes of change parameters in the environment. Aforesaid Williamson’s concept can be hypothetically presented in Figure 3, which shows the interaction and relationship between individuals (first level) and institutions of various types: those that represent institutional arrangements (second level) and those that are integral parts of the institutional environment (third level). Institutional arrangements are voluntarily established rules of exchange between economic subjects, rules of market operations, rules of reciprocal effects between organizations (hierarchical structure) and various hybrid forms of institutional arrangements, which contain signs of the market (contractual) and hierarchical relations. Figure 3 shows seven types of mutual effects: first, the impact of individuals on the institutional arrangements (agreements), second, the impact of institutional arrangements on the institutional environment, third, the impact of the institutional environment on the institutional arrangements, fourth, the impact of institutional arrangements on individuals, fifth, the impact of institutional arrangements on each other, sixth, the impact of individuals on the institutional environment, and seventh, the impact of institutional environment on individuals.
1 “The institutional enviromnent is the set of fundamental political, social, and legal ground rules that establishes the basis for production, exchange and distribution. Rules goveming elections, property rights, and the right of contract are examples” (Williamson 1995, p. 174)
THE POST-SOCIALIST TRANSITION THROUGH THE PRISM OF O. WILLIAMSON’s INSIGHT
17
Figure 3: The interaction of individuals and institutions
Source: Williamson 1985, s. 31.
K. Menard (2007, p. 142) in the article "Transaction cost economics: the Cost theory to empirical research", has presented a hypothetical framework of analysis, reduced to transaction costs. However, essential for our study are two basic assumptions of economic behavior: limited (institutional) rationality and opportunistic behavior (Figure 4). This behavior stems from the transactional economy environment, which in the most general sense is made of the ratio: market, characteristics of goods and services, and the rule of law. Figure 4 essentially reflects Williamson’s insight. Figure 4: Framework of the Williamson Institutional Analysis
Source: K.Menard 2007, p. 142.
3. ACKNOWLEDGEMENTS TO O.WILLIAMSON Williamson differs hierarchy of the firm, starting from the horizontal market relations, where sometimes occurs market fiasco due to the opportunistic behavior of market participants, who follow their own interests. While not denying the crucial role of the contract, he generalizes and systematizes organizational forms of firms into hierarchies, markets and hybrids as combinations of contractual relations (market) and administrative "power" (command and control, hierarchy). The firm appears as "stabilizing structure" that helps to overcome the problems of uncertainty,
18
Milica Delibasic
numerous in the environment. Aforesaid interpretation gives contractual character to the economic relations, in which individuals pursue their own interests, and that is consistent with their egoistic nature. The firm is seen as an instrument of the economy for searching the information, specification of the property rights, concluding the contract etc. Since the contracts are inevitably incomplete, the stability of hybrid forms requires certain mechanisms that are designed to coordinate activities, organize transactions and dispute resolution. The foundation of the hybrid architecture is special way of internal control, which Menard calls authorities, emphasizing their difference from the "hierarchy". These power relations combine autonomy with transferring a number of appellate decisions, especially the legal subjects, which are responsible for coordinating their activities. Williamson has identified three main types of contracts: classical, neoclassical and relational (referring to the highly specific long-term transactions, where critical importance is character of the partner, because it is impossible to find equivalent of exchange in the market). Relationship becomes long, informal discussion to gain an advantage over formal obligations. Each type of contract corresponds to a separate regulatory framework, i.e. organizational mechanism for evaluating the participant’s behavior. Classical contract regulates the market, neoclassical contract regulates the arbitration, relational contract regulates two-sided informal negotiation within firm as a unitary regulatory structure, where decisions are unilaterally made by management body. Significant are Williamson’s conclusions that the firm provides secure protection of specific resources from the market extortion and allows owners to quickly adapt to unforeseen changes, so the profit is achieved at the cost of weakening stimulation and boundaries of the firm depend on the balance between profitability from better protection and adaptability of specific assets on one hand, and loss of stimulation, on the other. Williamson sees the institutional structure as a mutually arranged set of institutions (formal and informal), that forms the matrix of social and economic behavior and determine the limits of social and economic subjects. They consist of the basic political, social and legal norms, which are common for economic activities. Essential function of institutional structures is to ensure order in society and to reduce the uncertainty in the relationship between people and organization. O. Williamson (1993, p. 115) considers the opportunistic behavior as a central category of transactional economic theory, explaining the formation of the firm as a hierarchical structure. Since the turbulent environment is not suitable for neutralizing the uncertainty and risk, there are real possibilities to express the opportunistic behavior as a means of economic agents acting in accordance with their own interests, which does not take into account the moral norms, nor contradict the interests of other agents. It is believed that the direct basis of opportunistic behavior is the asymmetry of information, resulting from the uncertainty. It represents uneven distribution of information, necessary for concluding the agreement between potential partners. Since the economic processes are implemented in real time, it is important to distinguish two basic types of opportunistic behavior: before contracting (which may consist of concealing the necessary information, or so-called "harmful choice" or adverse selection) and after contracting - a typical example is so-called "avoidance" or shirking, which manifests through violation of the contract, including strategic manipulation of information (Eggertsson 1991, p. 115), as well as the corresponding the lack of positive effects of the contract. Avoiding obligations legally occurs as a consequence of inability to specify all obligations between the contracting parties, i.e. due to the phenomenon of incomplete contract. Management is one of the constitutive elements of the firm. The management structure consists of three elements: bounded rationality, opportunistic behavior and specific resources. In this context, the firm can be defined as the management structure destined for the regulation of mutual relations between economic agents in terms of bounded rationality, opportunistic behavior and specificity of the used resources. Bounded rationality is characteristic of human behavior under conditions of uncertainty, assuming an inability to predict all possible accidents, and to determine optimal direction of behavior. It is basically an incompleteness of contract. Specific resource is the resource whose alternative usage costs are less than the income from the most
THE POST-SOCIALIST TRANSITION THROUGH THE PRISM OF O. WILLIAMSON’s INSIGHT
19
effiecient usage. O. Williamson (1985, p. 31) has proposed Table 1, showing how the dominant form of contractual relationship depends on the absence of any of the three management elements. Table 1: Attributes of the Contracting Process (dominant forms of contractual relationships depend on the absence of one of the three management elements) Behevioral Assumption
Asset Specificity
Implied Contracting Process
Bounded Rationality
Opportunism
0
+
+
Planning
+
0
+
Promise
+
+
0
Competition
+
+
+
Governance
Source: Williamson 1985, p. 31. Under conditions of extreme uncertainty (bounded rationality), if there is no opportunistic behavior, contractual relations are achieved through the formulation of promise. Regardless of whether the contract provides realization in any case, the parties will act in accordance with the given promises (as pre-accepted obligations). If planning is possible in a relatively simple real conditions (characterized by stability, a small number of external connections, appropriate level of competence of the parties and the like), then the implementation of contractual relations is possible for the personified relations, in which the key importance is trust or reputation. Opportunistic behavior is not desirable for all economic agents no matter which part of the specific resources income can be appropriated to their advantage. In the case of radical uncertainty and opportunity as a representative of economic disparity (or even conflict among them), the possibility of strategic manipulation of information is reduced to competition. Only in the case when parallely with opportunistic behavior (caused not only by contradictions in economic interests, but also by extreme uncertainty) specific resources are used. There is a need for implementing such a contractual relationship, which provides insurance and, consequently, reduces the risk of losing part of or the whole so-called quasi-rent, obtained by using specific resources. Quasi-rent is a difference of income that is derived from resources exceeding the best of missed alternatives. Above mentioned contractual relationship, Williamson calls management. Decision on concluding the contract is a standard case of discrete choice. Williamson proposes that two sides are involved because they expect that their benefits from the contract will be greater than the benefits that would be achieved from the same transaction in some other way. In literature, the main reasons for concluding the contract are the risk shifting (insurance) and achieving the stimulation. Difficulties associated with asymmetric information are studied using a model of principal-agent, when action of one person affect the action of other person, and this is a classic contractual relation between two sides. In theory of stimulation, focus is on several types of behavior (figure 5).
20
Milica Delibasic Figure 5: Conditional scheme of adjusting the stimulation agent when contracting
Source: Author’s adaptation
Representatives of the theory of optimal contracts are focused on stimulating the agents in order to limit their opportunistic behavior. The most common solutions are: competition among agents, agents participating in the implementation of joint activities and the firm as a coalition of agents (increasing the trust among them). O. Williamson thinks that various contract forms are regulated by various mechanisms: simple contracts with the impersonal and short-term relations are regulated by the market, disputes are resolved in court, and complex (relational) contracts regulates hierarchy, characterized by personal and long term relationships in which disputes are resolved through informal negotiations. Access to contracts by the theory of transaction costs is much closer to reality and simpler, because it allows clear and empirical review of many assumptions regarding the wide range of transaction costs. In this approach there is no rigorous models of optimal contract. But there is a significant problem of ignoring the institutional environment as an important source of transaction costs. Basic assumption of this theory is that contracts always contain inaccuracies and other imperfections, which is why they can be partially realized. Therefore the need to manage the contractual relations after the concluding the contract. The main concept of this theory is that the basic function of contracts or organizations to save on the size of transaction costs and production costs. O. Williamson (2000) has offered a classification of economic institutions, based on different hierarchical levels (figure 6), which are not mutually exclusive but are interrelated. A higher level imposes restrictions on lower level. Inversely, it provides the feedback from lower to higher level. In Figure 6, he (Ibid.) specifies the three-level setup where L1 is the embeddedness level where the informal rules (which change very slowly) are located, L2 is the institutional environment where the formal rules (especially the policy and judiciary) change gradually and L3 is the governance level, which is the name of the game where transaction cost economizing realignments are made more frequently.
THE POST-SOCIALIST TRANSITION THROUGH THE PRISM OF O. WILLIAMSON’s INSIGHT
21
Figure 6: Economics of Institutions
Source: Williamson 2008, p. 13.
In the article "Behavioral Assumptions" O. Williamson (1985, p. 44) has pointed out that many economists believe that the adoption of certain behavioral assumptions facilitates economic analysis and explains the nature of economic rationality. He distinguishes three forms of rationality: a) strong form, which involves maximizing b) semi-strong form, which implies limited rationality and c) weak form of rationality or organic, which is used in the evolutionary approach, and sometimes it is interpreted as an indirect way to the recognition of the fact that information has its price. Williamson analyzes three kinds of egoistic behavior (i.e. self-interests), which respectively corresponds to the above mentioned forms of rationality: a) opportunism as the strongest form (deception, lie, theft, etc.), which contradicts the respect of the rules and involves self-interest, b) semi-strong form or simple self-interest, and, c) obedience as a lack of selfinterests, which is associated with social engineering. 4. MISTAKES OF POST-SOCIALIST TRANSITION THROUGH THE PRISM OF WILLIAMSON’s INTERPRETATION Williamson's distinctions of the hierarchical system in a horizontal market relations, and his interpretation of the institutional structure, clearly shows his commitment to institutional pluralism. The practice of post-socialist transition contradicts institutional pluralism, as in the most of the countries is imposed institutional monism of neo-liberal type, which is essentially reduced to a quasi-institutional system due to dominance of alternative institutions. In other words, priority of individualism to institutional pluralism has been constantly potentiated in order to enrich the privileged minority in relation to the proclaimed reformist mass. Consequently, the vast majority of the people has been impoverished. Instead of implementing real institutional changes and improving institutional structures (by creating institutions of development), which would allow the extraction of innovation rent, imposed "reformers" have created anti-development institutions of alternative type, enabling rent-seeking behavior i.e. enormous gain of political rent through various anti-entrepreneurship structures, as well as the status rents to the officials. The new innovation institutions have not been created, and old institutions have been destroyed, despite their limited control of the tran-
22
Milica Delibasic
saction costs. Hybrid alternative institutions have been created, strictly controlled by the ruling party and nomenclature. In order to enrich non-market (economically dysfunctional converting the state capital into private property), they have parallely and legally caused the enormous increase in transaction costs, for various reasons (transformation and impairment of property, cease and/or reduction of production, forced retirement, the costly social programs, destruction and/or dysfunctional use of economic infrastructure, inappropriate financial debt, increase of opportunity costs, erosion of state assets and economic resources, formation of non-market alternative inefficient and theft institutions, lesser economic growth and income, number of negative external effects, etc..). In the whole proces, particular causes of the increase in transaction costs may be: a) the reduction of institutional competition, which has been substituted by a wide range of social pathology with enormous growth of informal sector, b) broken relations and dependence on the previous development (path dependence), c) dominance of privileged private and group interests in terms of imposed application of neo-liberalism ("final plan" - Williamson 1989, 1994), i.e. imitative "piece-meal social-engineering" (K. Popper), which led to disastrous economic effects of privatization, social polarization and the spread of systemic corruption, and d) anti-institutional function of incompetent political elite, increasing the party and government authoritarianism, without concession to the market (as promoted), increasing the problems of social and economic development, and drastically limited economic choice. Analysing institutional structures in most countries of post-socialist transition, many authors warns that: a) propagated and nominated mass of private property in transitional countries is substituted by enormous property of a few privileged (non-market) rich individuals, and b) economic (and other) institutions are the most developed in capitalism as an empire of "true individualism" and pluralistic institutional arrangements, where real institutional changes are continually taking place. Institutions by its nature depend on individuals who create them in historical and social perspective. But, individuals can not replace them (except in the quasi-institutional arrangements of alternative type). It is believed that in certain post-socialist countries was another controversial regularity: structuring, directing and restricting individual behavior certainly formed and reinforced alternative institutions have created some preferences towards market behavior of individuals, having a crucial impact on the redistribution of ownership and the consequent negative relations of dependence and other effects. This led to specific anti-development institutional structure, which has reproduced throughout the transition period. Instead of economic development based on the strengthening of institutional structures and limiting the opportunistic behavior, which Williamson did clearly marked as a source of transaction costs, the post-socialist countries have programmely flourished with opportunistic behavior. With a short historical distance can be estimated that it was completely supported by nomenclature structures of government, because that has been the basis for a variety of ownership manipulations, i.e. the non-market (alternatively) redistribution of property rights. This has led to a huge overflow of a state ownership into private ownership, without continuum or with reduced market function of the privatized firms, with huge growth in transaction costs, profit losses and rising unemployment, followed by populist and institutional deformation of social programs. Institutional structure and economic infrastructure have also been deformed and crippled. 5. CONCLUSION Transitional institutional environment, predominantly focused on the promotion of market institutions and privatization, have lost not only pluralistic institutional capacity, but also some of its vital elements (legality, good judicial practice, control and changeability of government, the rule of law, etc..). That led to deterioration in the efficiency of the implicit social contract, an increase in opportunistic behavior and the formation of a quasi-market structures, which have consequently prevented the efficient functioning of markets. The non-market appropriation has been widely enabled, and transition reforms discredited. The social and organizational capital
THE POST-SOCIALIST TRANSITION THROUGH THE PRISM OF O. WILLIAMSON’s INSIGHT
23
have received new control and new owners, with the help of a dominant alternative institutions and numerous conflicts of interest. That way, the institutional competition and Pareto optimum have been undermined, but influence of the Coase's theorem have been enabled. Economic policy and economic behavior of economic subjects in most post-socialist countries have been completely contrary to the recommendations of O. Williamson: Instead of controlling opportunism and reducing transaction costs – they have been maximized, instead of institutional integration and expansion of the enterprise’s vertical boundaries – there have been disintegrated, instead of strengthening control mechanisms – things got out of control, instead of institutional pluralism – imposed have been institutional monism of (quasi) neoliberal type, instead of fight against asymmetric information – they have dominated the economic choices, instead of competition – monopolies have dominated, instead of entrepreneurial choice between the ratio of the market and shape of the company – non-market and destructive behavior have dominated, and instead of institutions – quasi-institutions. Consequences are very negative economic results and reproduction of the crisis. One of the most important Williamson’s conclusions (2000, p. 605), which can be applied in the post-socialist countries, is that the political and economic governance structures have been directly responsible for implementing institutional changes in the social and economic level. Since these structures have almost never been responsible for the failure, they have not been obliged to critically review their decisions and implementation of neo-liberal formula. On the other hand, since most of these structures have been self-interest motivated and lobbyist associated with the quasi-entrepreneurial subjects, opportunistic behavior have been tolerated, using benefits of asymmetric information for the purpose of non-market wealth building, particularly in the institutionally deformed process of privatization. LITERATURE Coase, R. H. (1984), "The New Institutional Economics", Journal of Institutional and Theoretical Economics, No. 140, 229-231. Furubotn, E.G. and Richter, R. (eds.) (1984), The New Institutional Economics, Symposium June 6 – 10, 1983, Mettlach/Saar, Zeitschrift für die gesamte Staatswissenschaft, Heft 1, 140.
Menar, K. (2007), “ Transaction cost economics: the Coase theorem to empirical research ”, in Institucionaljnaja ekonomika, edd. A. Olejnik, INFRA-M, Moskva, 113-151.
Menard, C. and Shirley, M. M. (2008), Handbook of New Institituonal Economics, Springer - Verlag Berlin Heidelberg. Nabli, M.K. and Nugent, J.B. (eds.) (1989), The New Institutional Economics and Development, Theory and Applications to Tunesia, Amsterdam et al., North Holland. North, D. C. (1995), “The New Institutional Economics and Third World Development”, in: Harriss, Hunter and Lewis (1995a), 17–26. Williamson, O.E. (1975), Markets and Hierarchies. Analysis and Antitrust Implications, New York.
Williamson O. E. (1979), “Transaction-costs economics: the governance of contractual relations”, Journal of Law and Economics, Vol. 22, No. 2, 233-261.
Williamson, O. E. (1981), "The Economics of Organization: The Transaction Cost Approach", American Journal of Sociology, Vol. 87, No. 3, 548-77.
Williamson O. E. (1985), “Reflections on the new institutional economics”, Journal of Institutional and Theoretical Economics, Vol. 141, No. 1, 187-195. Williamson, O. E. (1985a), The economic institutions of capitalism: Firms, markets, relational contracting, The Free Press, New York. Williamson O. E. (1993), “Comparative Economic Organization: The Analysis of Discrete Structural Alternatives”, Administrative Science Quarterly, Vol. 36, No. 2, 269-296. Williamson O.E. (1993), “Transaction Cost Economics and Organization Theory”, Industrial and Corporate Change, Vol. 2, No. 2, 107-156. Williamson, O. E. (1995), “The institutions and governance of economic development and reform”, in Proceedings of the World Bank Annual Conference on Development Economics 1994, 171-197, Washington: World Bank.
24
Milica Delibasic
Williamson, O. E. (2000), “The New Institutional Economics: Taking Stock, Looking Ahead”, Journal of Economic Literature, Vol. 37, No. 3, 595-613. Williamson, O. (2008), „Outsourcing: transaction cost economics and supply chain management“, Journal of Supply Chain Management, Vol. 44, issue 2, 5–16.
COMPETITIVENESS IN HIGHER EDUCATION IN TERMS OF THE LEVEL OF STUDENTS' SATISFACTION WITH BLENDED MONTENEGRIN JOURNAL OFE-LEARNING ECONOMICS,INVol. 10, No.ENVIRONMENT 1 (July 2014), 25-42
25
COMPETITIVENESS IN HIGHER EDUCATION IN TERMS OF THE LEVEL OF STUDENTS' SATISFACTION WITH E-LEARNING IN BLENDED ENVIRONMENT SANJA BAUK1, and JASMIN JUSUFRANIC2 ABSTRACT The intellectual competitiveness is a motto of the new information era. Higher education within contemporary conditions appearances as the leading area for the provision of competitive capabilities and competitive advantages of the company since it directly affects the creation of intellectual and organizational capital, including greater competence of personnel, i.e. greater number of employees with intellectual vacations. The paper explains the growing role of e-learning in the provision of competitive properties of higher education at the example of the International University of Travnik. It is started from the hypothesis that e-learning, as an alternative form of learning in higher education, expands the array of educational choices by strengthening the competitive position of the observed University. Also, the competitive position of the analyzed University becomes stronger with increasing degree of students' satisfaction with e-learning component in blended environment which is a mix of traditional (or, face-to-face, classroom based, traditional education) and learning supported by modern information and communication technologies and tools (or, e/online/web based/internet mediated/m-learning). In validating these hypothesis, in addition to the theoretical considerations, on the basis of the results of the surveys conducted among students of the International University of Travnik, two-dimensional Kano model is applied, with the aim of determining the degree to which certain dimensions of e-learning in blended model affect the level of students' satisfaction with conditions and outcomes of such form of learning. The results are interpreted by the appropriate numerical, graphical and statistical analysis. KEY WORDS: concurrency, higher education, e-learning, blended environment, level of students' satisfaction, Kano model
JEL Classification: D83; I23; Received: February 05, 2014 / Accepted: June 30, 2014
1. INTRODUCTION Nowadays competitive advantage goes to the side of those who are "armed" with knowledge through which they can resolve the most real world complex problems. The transition to the innovation way of development and so called "knowledge economy" imperatively highlights the relevance of specialized competencies that are acquired in the field of higher education, and are aimed at increasing the value of intangible assets (human and intellectual capital), and thus the competitive ability of specific companies and ultimately the state. According to this, it is present continuous development of new forms of knowledge transfer based on extensive using of modern information and communication technologies and tools. One of these forms of knowledge transfer finds support in blended learning model. Blended learning is one way in which institutions can prepare themselves for the next era in education (Garrison, and Kanuka, 2004; Owston, 2013). It offers new opportunities for combining face-to-face and online teaching and learning. This includes different learning or instructional methods (lecture, discussion, guided practice, reading, games, case study, simulation), different
1 2
University of Montenegro, Department of Maritime Studies, Kotor, Associate Professor,
[email protected] International University Travnik, Assistant ,
[email protected]
26
Sanja Bauk and Jasmin Jusufranic
delivery methods (live classroom or computer mediated one), different scheduling (synchronous or asynchronous), and different levels of guidance (individual, instructor or expert led, or group/social learning). There are many definitions of blended learning and yet no single accepted one. In the scope of this study we shall consider students' level of satisfaction within blended learning model as a formal education program in which a student learns at least in part through online learning, with some elements of student control over time, place, path, and/or pace (Clayton Christensen Institute for Disruptive Innovation, 2012-2013). Bearing in mind that the work of the blended environment influences the increase of competitiveness of higher education, this paper will discuss the theoretical and practical dimension related to the provision of an appropriate blended learning models and the acceptable level of student satisfaction with new technology based models of knowledge transfer. 2. INCREASING COMPETITIVENESS THROUGH HIGHER EDUCATION Knowledge is being treated as the key factor of economic growth, and ability to create new technological and sustainable development. In the opinion of Maringe and Gibbs (2009, p. 47) dynamic environment of the higher education points to the need of developing some new opportunities in the future, such as: greater complexity of the „educational product“, complex social role of education institutions, and importance of their financial performances and competition. As Figure 1 shows, higher education can lead to economic growth through both private and public channels. Figure 1: Conceptual framework of the role of higher education
Source: Bloom, Canning, and Chan 2006, p. 16. Higher education (HE) is of particular importance for the economic competitiveness of any society, since higher education institutions generate knowledge and develop expertise and skills which enable individuals to achieve their personal goals as well as become valuable members of society. HE is an infrastructure for future state-level social cohesiveness. HE is becoming increasingly competitive in terms of students, staff and resources. In the area of economic development, higher education increases productivity and competitiveness, particularly through the growth of the human capital and the creation of a better educated, more qualified and more skilled work force. HE contributes to state competitiveness (Green, Mostafa and Preston, 2010) via human capital development that provides future returns to the economy through increases in labor productivity.
COMPETITIVENESS IN HIGHER EDUCATION IN TERMS OF THE LEVEL OF STUDENTS' SATISFACTION WITH E-LEARNING IN BLENDED ENVIRONMENT
27
Creating innovative higher educational institutions, where technology permeates every part of the curriculum, where creativity and innovation are included into each discipline, is of particular importance. From that depends encouraging the growth of creative people who have capital. Creative economy will have a key advantage in the growing competition. Because of this, many authors have attempted to model a way of gaining competitiveness of education. One of these models is shown in Figure 2. Figure 2: Pyramid model of competitiveness in higher education
Source: adapted from Tamándl and Nagy 2013, p. 1127. Contemporary higher education is now situated in an open information environment. It is a complex combination of the impacts of global flows and networks of words, ideas, knowledge, finance and institutional relationships, along with their respective national system design and original creation (Figure 3). Therefore, it is considered (Marginson 2006, p. 2) that it is imperfect and variable integrated system, which is characterized by uneven and variability patterns of engagement and communication, autonomy and separation zones, and both stable and unstable hierarchy. Relationships are dual structured based on cooperation and concurrency. The concurrency positioning in higher education, within each national system, exists as ratings hierarchy (Table 1). World Economic Forum (2006-7) is underlined that education and training have emerged as key drivers of competitiveness, ensuring that the labor force has access to new knowledge and it is trained in new processes and the latest technologies. A country’s ability to absorb new technologies, to produce goods and services that can reach standards of quality and performance acceptable in international markets, to engage with the rest of the world in ways that are value creating, is intimately linked to the quality of its schools, to the priority given to training and education in mathematics and science, and to the existence and accessibility of specialized research and training centers.
28
Sanja Bauk and Jasmin Jusufranic
Figure 3: An implementation framework for higher education
Source: Herrmann 2008. Development of the knowledge society in the 21st century is characterized by broadening the boundaries of knowledge, shortening of the knowledge life cycle, and the emergence of new knowledge at a very fast pace. Learning is increasingly becoming a life-long process. There is a growing competition between higher education service providers since the market is increasingly privatized (OECD 2010, p. 299). In such circumstances, higher education service quality becomes a key for the service providers. The higher level of development puts more strict rules and expectations on education service quality. Besides, economic and cultural globalization, along with market increasingly liberalization, have created new challenges for the higher education system since it requires global openness and knowledge exchange. Table 1: Typical segmentation of competition in national higher education systems
Segment 1
Segment 2
Segment 3
Elite research universities self-reproducing, combining historical reputation, research performance, and student quality/degree status. Driven by status attraction/accumulation not revenues per se. Non expansionary in size. Limitless ambitions for social status and power. Wealthy. Relatively closed. Aspirant research universities struggling to live as Segment 1, but unable to break in. Tendency to brain drain of best students and researchers to Segment 1. May engage in selected commercial activities to generate revenues, but not so efficient in commercial terms. Resource scarcity. Semi-open. Teaching-focused (university or other) student volume and revenue driven. Some are private for profit institutions, or public sector operations with a large commercial component, tending to expand. High resource scarcity. Tendency to hyper-marketing and reducing costs/quality under market pressure. Open.
Source: Marginson 2006, p. 8.
COMPETITIVENESS IN HIGHER EDUCATION IN TERMS OF THE LEVEL OF STUDENTS' SATISFACTION WITH E-LEARNING IN BLENDED ENVIRONMENT
29
High quality is the main competitiveness indicator of HE. The term ‘quality of education’ implies the following guidelines: (a) quality of teaching (learning process design, teaching methodology); (b) quality of academic staff; (c) quality of study programmers; (d) quality of equipment, maintenance and support rendered; (e) quality characteristics of the learning environment; (f) characteristics of students; (g) quality of university management, and (h) quality of research. Thus, the quality of HE is multidimensional, and its empowerment depends on numerous impacts, particularly on new forms of knowledge transfer supported by contemporary ICT tools. 3. E-LEARNING AS AN ALTERNATIVE AND POSSIBLE COMPETITIVE ADVANTAGE IN ER EDUCATION New educational technologies have paved the way to a new learning techniques unconstrained by time and space. E-learning in blended environment (most commonly) becomes a significant quality strategy to increase the reputation of the higher education institutions through service differentiation. In this effort to innovate universities, the introduction and utilization of e-learning component will be a key advantage. New types of for-profit and non-profit organizations are beginning to provide competition in targeted segments of higher education (Armstrong 2000, p. 2). Evolution of this competition will be speeded by internet mediated learning which will enable these new competitors to access easily many of the traditional constituencies of higher education. Irrespective of many doubts regarding the quality of e-learning in comparison to traditional education, and undoubtedly less competition diplomas obtained through this type of learning, if one considers the issue from the aspect of the new competitive arena and profitability of higher education institutions, the most important is the level of satisfaction of clients (here students) from which derives the corresponding demand for new form(s) of higher education. In addition, it is not negligible the shift of the boundaries of knowledge and education over much broader layers of the population. Of course, e-learning creates strong concurrency pressure on traditional higher education. E-learning (usually within blended models) seeks its place in the market of higher education, and users who prefer its requirements, capabilities, quality and virtuality. Most probably, its best chance is reflected in: a) rapid development of new information and communication technologies; b) flexibility, diversity, and interactivity education process; c) much lower cost; d) greater convenience, and individualized acquisition of basic skills, and e) many other benefits, one of which is perhaps the most important limitlessness of entry. Armstrong (2000, p. 21) claims that e-learning becomes a new and powerful educational technique which combines communication power of internet with computing power of desktop and mobile computers (laptops), or even smart phones nowadays. Access to internet based courses is no longer restricted to a location, as are traditional university classes, or to a time, as are traditional classes or televised distance learning courses. Instead, it becomes global and asynchronous to provide maximum flexibility and opportunity for students. Traditional classroom lectures follow a linear learning approach in which the student follows the pace and path of the professor through the subject matter. The new e-learning allows nonlinear learning approaches based on cognitive learning theories, permitting the student to move at his/her tempo with an organizational structure that responds to his/her comprehension of the material. The flexibility to respond to different learning styles is increased dramatically compared to the traditional, classroom based lecturing and/or learning. In this context of the growing role of e-learning in blended environment, it is important to find a reliable methodology and technique(s) for assessing the level of students' satisfaction with this relatively novel mode of learning. Therefore, the following paragraphs of the paper contain detail analysis of the level of students' satisfaction with e-learning component of blended learning model at International university of Travnik. For this purpose, Kano two-dimensional model of assessing customers' requirements and consequently satisfaction is used. Firstly, the main idea of Kano model is presented, and then the analysis of the surveys conducted among the students of this university is performed.
30
Sanja Bauk and Jasmin Jusufranic
4. ASSESING E-LEARNERS' SATISFACTION BY KANO MODEL In the past, customer satisfaction has been perceived in one-dimensional terms: the gre-ater the fulfillment of desired quality attributes, the higher would be customer satisfaction. However, there are some quality attributes that fulfill individual customer expectations to a great extent without necessarily implying a higher level of customers’ satisfaction (Matzler and Hinterhuter, 1998). Several studies have therefore attempted to link the physical and psychological aspects of quality to see how specific attributes of a product or service actually relate to customer satisfaction or dissatisfaction, where the physical aspect is concerned with the physical state or extent of the specific attributes, and the psychological aspect is related to the customer’s subjective response in terms of personal satisfaction (Schvaneveldt et al., 1991). Similarly, Kano (1984) considered two aspects of any given quality attribute: an objective aspect involving the fulfillment of quality, and a subjective aspect involving the customers’ perception of satisfaction. Using this model, quality attributes are classified into six categories (first four of them are shown in Figure 4):
Attractive quality attribute (A): an attribute that gives satisfaction if present, but that produces no dissatisfaction if absent; One-dimensional quality attribute (O): an attribute that is positively and linearly related to customer satisfaction – that is, the greater the degree of fulfillment of the attribute, the greater the degree of customer satisfaction; Must-be quality attribute (M): the presence of these product/service attributes will not increase customers’ satisfaction level significantly, while their absence will cause extreme dissatisfaction; Indifferent quality attribute (I): an attribute whose presence or absence does not cause any satisfaction or dissatisfaction to customers; Reverse quality attribute (R): an attribute whose presence causes customer dissatisfaction, and whose absence results in customer satisfaction; and Questionable quality attribute (Q): it means that is not clear weather customers expect these attributes since they gave unusable responds due to misunderstanding the questions on the survey, or making an error when filling out the questionnaire. Figure 4: Kano two-dimensional model for accessing customers' (here students') level of satisfaction with a product or a service (here e-learning in blended environment)
Source: adapted from Walden 1993, p. 4
COMPETITIVENESS IN HIGHER EDUCATION IN TERMS OF THE LEVEL OF STUDENTS' SATISFACTION WITH E-LEARNING IN BLENDED ENVIRONMENT
31
In addition, Kano considered both functional and dysfunctional dimensions of analyzed customers' requirements and consequently their satisfaction with a product or a service. Within in the paper examined context, it is critical to identify must-be quality attributes, in order to meet demand for these elements at a minimum threshold level at least. Universities must also do their best on the one-dimensional attributes, which are typically articulated by customers as functionality they desire, while the attractive quality attributes can be selected as competitive „weapons“ to draw the attention of students, especially new ones (Bayus et al., 1997). 4.1 Applied methodology Within here conducted study the questionnaire based on Kano two-dimensional model is used to determine students’ at International university of Travnik satisfaction with the web based learning system in blended model. In order to define quality attributes for Kano model, five quality components of DeLone and Mclean (D&M) model (DeLone and Mclean, 2003) are used (Table 2). Then, the questions, or students' requirements, for each quality attribute of the considered web based learning system: systems quality, service quality, information quality, use, and net benefits, are created. Table 2: Kano model quality attributes questionnaire defined by D&M model Quality attribute System quality Service quality Information quality
Use
Net benefits
Kano model questionnaire
Technical stability/reliability of the system User-friendly interface Available access to the system at any time
Quality/quantity of e-instructional materials
Presence of audio/video recordings (besides textual ones) Mandatory e-test and assignments Student self assessment possibilities Collaborative activities Presence/existing of e-tutor(s) Enhanced learning with combination of web based and traditional learning (blended learning model)
Source: adapted from Bauk et al. 2014, p. 4. The responders (students) are asked about their mindset due to functional and dysfunctional dimension of the web based e-learning system quality attribute, e.g. the offered answers in both cases, in accordance to Kano model, are: I like it; It must be that way; I am neutral; I can tolerate it; or, I dislike it. The respondents have to choose one of the offered options (answers) for both functional and dysfunctional dimension of the question. Due to the chosen pairs the reviewer may get an overview of the students’ satisfaction with the examined web based learning system quality attributes. The population sampled was of 70 students at the International university of Travnik. The results obtained through questionnaires delivered among students are presented and discussed within the following section.
32
Sanja Bauk and Jasmin Jusufranic
5. RESEARCH RESULTS AND ANALYSIS Here are presented the results of the students' responds to the questionnaires inspired by Kano model. The results are obtained through following methods of analyzing the responds:
frequencies of certain Kano categories appearance in the set of responds; customers’, here students’, (dis)satisfaction indexes; two-dimensional (linear) graphical scheme; and some basic statistical parameters.
It should be said that it is often the case that there are usually some differences in the results of the survey analysis, depending on the method/technique that was applied. These differences at first might appear as confusing. However, they point to the non-uniqueness of the model and the opportunities that are „open“ for the decision-makers in higher education, as well as for the designers of contemporary internet mediated learning components in blended models. In the analyses that follow, we will be confronted with some scattered results, but we will try to give a reasonable explanation of these inconsistencies. 5.1 Frequency of Kano attributes appearance The first applied methodology of analyzing students' responds is based on the frequency of appearing certain Kano attributes in the set of responds (Table 3). Table 3: Spreadsheet of most frequent responses to students’ requirements No.
Students’ requirements (SR)
Most frequent response
Second most frequent response
Third most frequent response
1.
Technical stability (reliability) of the system
I
M
O
2.
User-friendly interface
I
O
M
I
O
M
I
M
A
3. 4.
Quality/quantity of instructional materials Presence of audio/ video recordings
5.
Collaborative activities
I
Q
M
6.
Self-evaluation possibilities
I
O
M
I
Q
O
I
O
M
7. 8.
Mandatory exercises, tests, essays, etc. Combination of web based and traditional learning
8.
Presence of e-tutor(s)
I
O
M
10.
Available access to the system at any time
O
M
A
Source: adapted from Walden, 1993, p. 11
COMPETITIVENESS IN HIGHER EDUCATION IN TERMS OF THE LEVEL OF STUDENTS' SATISFACTION WITH E-LEARNING IN BLENDED ENVIRONMENT
33
By analyzing the results of the survey conducted among the students who have used web based learning system in blended model at the International university of Travnik (see Table 3), the following is to be noticed:
The indifferent (I) category of applied Kano model has the greatest frequency of appearance among all the categories in even nine of offered ten questions! Simplified and looked though the eyes of Kano model, it means that customers, here students as e-learners, do not care about these features either way. How this could be explained? It could be realized that most of students among the responders are not interested in e-learning system, or, it was difficult for them to be “consistent” in giving answers on both functional and dysfunctional features/dimensions of the e-learning system at the same time, so the easiest for them was to be “indifferent”. Or, they just want to fulfill the “form” by answering the questions, but they did not think deeply about the questions and scope of doing the interview. Anyhow, in our further analysis we have ignored the “indifferent” answers in the case of questions where they are present in the greatest number, and we focused on the second and/or third most frequent answers as rather indicative ones. As a kind of exception can be treated answers in cases SR5, SR6, Q7, and SR9 (collaborative activities; self-evaluation possibilities; mandatory exercises, tests, essays, etc., and availability of e-tutor). Namely, it has sense that students are indifferent about collaborative activities within e-learning platform, since they have a lot of another possibilities to collaborate through different social networks (Facebook, Twitter, e.g.). Additionally, students are not usually aware about the importance of self-evaluation possibilities in making them learning easier and more interesting, though it can be reasonable that they do not care about this feature. But, the teachers should explain them the benefits of selfevaluation process and “convince” them in a way to treat this category as more important one. Further, students usually do not like obligations like mandatory exercises, tests, essays, etc. Therefore, this can be accepted as well as a category they estimated as irrelevant for them. And, finally, when we take into consideration the question of availability of e-tutor, then it is to be emphasized that most of the students are familiar with contemporary information and communication technologies (ICT), and though they do not have special requirements for e-tutor (Bauk et al., 2014). A certain number of “questionable” answers was present in two cases (SR5 and SR7). This can be again treated as a result of the lack of some students’ understanding of basic principle of the questionnaire. Hence, we have to be focused on, let’s say, those answers which can be treated as more valid and relevant ones, and ignore these which do not have importance for planning an attractive e-learning systems in blended model due to learners’ (reasonable) wishes/expectations. Sometimes, students are not aware what is indeed useful for them, and the obligation of e-learning systems designers, teachers and e-tutors is to find the optimal solution(s). However, the judgments and feeling of the students should not be neglected.
Then, one can notice that most frequent answers are: M, O or A. In accordance to the previous extensive analysis of Kano model we should relay on the following order of attributes importance: M>O>A (Dominici and Palumbo, 2013; Walden, 1993) and the universities should find the optimal balance between these attributes and corresponding e-learning features in blended model for sacking the compositeness of the universities in the new ICT era. 5.2 Analysis of better and worse coefficients Since the results of the analysis in the previous case are fuzzy, we do here an effort to “sharp” them slightly, throughout the further analysis being based upon Berger, et al. (1993) model (see Dominici and Palumbo, 2013, p. 92; Walden, 1993, p. 17). Namely, instead of concerning mustbe (M), one-dimensional (O), and attractive (A) features, the responds of the customers are reduced here to two numbers: a positive number that is the relative value of meeting this customer requirement (versus the competition), and a negative number that is the relative cost of not
34
Sanja Bauk and Jasmin Jusufranic
meeting the customer requirement. These numbers are labeled as “better” and “worse” indexes and calculated in the following way, i.e. by equations (1) and (2):
Better
AO AO M I
Worse
OM AOMI
… (1)
… (2)
Better or satisfaction index indicates how much customer satisfaction is increased by providing certain feature of a system which is intended to be developed, while worse or dissatisfaction indicates how much customer satisfaction is decreased by not providing the feature. More precisely, the positive better numbers are indicative of the situation where, on average, customer satisfaction will be increased by providing attractive and one-dimensional elements. The negative worse numbers are indicative of the situation where customer satisfaction will be decreased if one-dimensional and must-be elements are not included into ex-ante blended/e-learning system which designers, teachers, e-tutors, etc., are intended to develop by meeting students’ expectations. Now, let’s consider in the light of these two coefficients the results of the survey being conducted among the students at International university of Travnik, and try to create more specified picture of the students’ expectations. The indexes better and worse are calculated and presented in Table 4. Table 4: Satisfaction (better) and dissatisfaction (worse) indexes SR no.
Better
SR no.
Worse
10. 8. 6. 3. 9. 2. 4. 7. 1. 5.
0.607 0.431 0.407 0.383 0.377 0.358 0.345 0.306 0.271 0.250
10. 6. 4. 3. 8. 1. 9. 5. 2. 7.
- 0.705 - 0.559 - 0.545 - 0.517 - 0.517 - 0.508 - 0.508 - 0423 - 0.415 - 0.367
Source: adapted from Dominici and Palumbo, 2013, p. 92 Table 4 shows ranking of better and worse coefficients on the basis of which can be seen how presence or absence of some of the students' requirements affect the competitiveness of the analyzed e-learning system. It is obvious that presence of SR10 (available access to the system at any time) will bi-directionally affect the quality of analyzed system, i.e. this feature presence will increase students’ satisfaction in the greatest extent, while its absence will decrease in the proportional extent their dissatisfaction. In this spirit one could continue further analysis of these coefficients. Thus, coefficients better and worse can be used for more refined analysis when (re)designing of the learning system is in matter. Further analysis will be realized through the appropriate Kano numerical calculus over students’ responds including graphical presentation of the obtained results.
COMPETITIVENESS IN HIGHER EDUCATION IN TERMS OF THE LEVEL OF STUDENTS' SATISFACTION WITH E-LEARNING IN BLENDED ENVIRONMENT
35
5.3 Graphical analysis of the obtained results The basic of graphical analysis implies that there are Q pairs of questions, j 1, Q (Q=10 in this case, number of considered students’ requirements) and N respondents (N=70 in this case, number of interviewed students), i 1, N . In accordance to Kano model, there may be two basic scores for each potential customer requirement being investigated: functional and dysfunctional ones. These two scores can be coded as follows (Walden, 1993): Functional ( Yij ): -2 (dislike), -1 (live with), 0 (neutral), 2 (must-be), 4 (like), and
Dysfunctional ( X ij ): -2 (like), -1 (must-be), 0 (neutral), 2 (live with), 4 (dislike). Since each answer of the respondents (here students) has been assigned by the appropriate numerical value it is possible to calculate average values for functional Y and dysfunctional X dimensions of the answers in a following manner, i.e. by equations (3) and (4):
Yj
Xj
Yij i
… (3)
N
X i
N
ij
… (4)
These pairs of average values can be plotted on two-dimensional coordinate system with four quadrants representing key categories of Kano model: attractive, one-dimensional, indifferent, and must-be. For the purpose of this research, based on the collected students’ answers, we take into consideration only must-be and like functional dimensions, and live with and dislike dysfunctional dimensions. Since neutral category implies pondering responds with zero value, it has in fact no impact on the total score and considered average values. Questionable and reversal answers were excluded from this analysis, as well. Besides, all average values are in positive quadrants (between 0 and 4 per X and Y axis) and given as points in Figure 5. Figure 5: Plots of average functional and dysfunctional points for students’ requirements SR 1-10
Source: adapted from Walden, 1993, p. 23, and Bauk et al., 2014, p. 8
36
Sanja Bauk and Jasmin Jusufranic
On the basis of the plots in Figure 5, it can be observed that the requirement SR3 is in must be quadrant of Kano 2D graph. It means that quality/quantity of e-instructional materials are of up-most importance to the students. Then, requirements SR6, 8, and 10 are within onedimensional quadrant. This means that self-evaluation possibilities, blended learning and available access to the system at any time are also of considerable importance to the users, here students of the International university of Travnik. The requirements SR1, 4, and 9 are in attractive quadrant. This means that developing technical stability (reliability) of the system, greater presence of audio/video instructional materials, as well as, presence of e-tutor(s) will increase competitiveness of the considered HE institution. The requirements SR2, 5, and 7 are in indifferent quadrant. It is to be noted that SR2 (user-friendly interface) should be translated to the attractive dimension, rather that to be in indifferent one. In addition to this plots analysis of Kano model, in the next sub-section will be given some statistical analysis of the students’ requirements. 5.4 Some statistical analysis In further analysis over the data set consisting of ( X j , Y j ) pairs, where X j and Y j are calculated by expressions (3) and (4) for j 1,10 , following statistical values have been calculated: mean value, standard deviation or variance, covariance, and correlation coefficient (Bertsekas and Tsitsiklis, 2008; Weltner et al., 2009). The numerical values of these statistical measures are given in Table 5. Here used notation is simplified and the analyzed data sets (pairs) are shown as X, Y and (X,Y). Table 5: Values of some statistical indicators Statistical measures Mean (X) Mean (Y) Var (X) Var (Y) Cov (X,Y) Correl (X,Y)
Values 1.822 2.113 0.359 0.307 0.077 0.777
Source: adapted from Bauk et al., 2014, p. 9. Upon the calculated values of the statistical measures (see Table 5) the following can be observed:
If we consider the mean value for the parent population, then it is the hypothetical “true” value of the variable. This means that Mean (X) and Mean (Y) might be treated as a pair which represents “true” value of general answer to all ten considered questions (or students’ requirements) covered by the questionnaire. Consequently, the general answer is equivalent to attractive category of Kano model; Variations Var (X) and Var (Y), as well as covariance Cov (X,Y) are used as pre-calculus for determining correlation coefficient Correl (X,Y). In fact, the higher the absolute value of the correlation coefficient, the stronger the correlation. Relatively high value of correlation coefficient CorrelX, Y 0.777 , or the coefficient of deter-
mination CorrelX, Y 2 0.608 means that there is a strong correlation between X and Y variables. This is understandable if we concern the linguistic descriptors and corresponding numerical values for pairs of opposite (functional and dysfunctional) categories of Kano model. What makes this correlation stronger is that neutral (indifferent), questionable, and reversal responds have been excluded from the graphical analysis. In another words,
COMPETITIVENESS IN HIGHER EDUCATION IN TERMS OF THE LEVEL OF STUDENTS' SATISFACTION WITH E-LEARNING IN BLENDED ENVIRONMENT
37
CorrelX, Y 2 0.608
means that more than 60% of the total variation in X can be explained by variations in Y. Or, another explanation might be that the ellipse representing correlation in this case should enclose more than 60% of the N considered points, i.e. ( Xj, Yj ), j 1,10 pairs on which it is based (Tailor, 1990). Above given short analysis over the numerical values of some relevant statistical measures provides a certain refinement of the observations made upon graphical interpretation of Kano model based on plotting pairs of the students’ quantified answers on both functional and dysfunctional aspects of the questions. These refinements will be better, i.e. more reliable, by introducing greater number of respondents and/or by having a greater number of questions forming the questionnaire, or more generally speaking, by uprising the parent population in statistical terms (Bauk et al., 2014), what should be a subject of further more extensive research work in this domain. 6. CONCLUSIONS Application of modern information and communication technology (ICT) tools has changed the traditional type of classroom-based education to “user-defined informal spaces”, which is based on student preferences (Farhan, 2014). This new methodology strives to develop an innovative, flexible and open system of education (Kondapalli, 2014). Learners became active participants and co-producers of knowledge. Or in other words, “learners’ choice is the order of the day”. Kondapalli (2014) claims that the process of globalization is bringing in many new dimensions, one of which is the maintenance of high standards in educational materials and service, which are expected to be comparable and competitive at national and international levels. In such constellation of facts, the academic leaders must be “agents of change”. This study aims to identify critical elements of e-learning system within blended environment by using Kano (dys)functional model (Walden, 1993) and DeLone and McLean (2003) generic model for the information systems success, providing though the recommendations for creating better new teaching/learning system. The population sampled was composed of students at International university of Travnik. In total, 70 valid questionnaires were collected. Firstly, frequencies of each Kano model categories appearances have been measured and some approximations have been done in order to make the responds more meaningful. Also some analysis based on determination of better and worse indexes have been made with and aim to reduce the fuzziness in observations. Additionally, some two-dimensional graphical analyses in Kano 2D plane have been realized. It is to be noted that there is a scattering among the obtained results, and that this is to be reduced throughout: repeating the questionnaire among another, considerably larger target group(s) of students, modifying the questions, and/or including some additional questions into the model. In any case, it is to be recommended to the designers of e-learning systems in blended environment - using the combination of methods employed in this research work along with some other available analytical and/or stochastic methods for assessing degree of customers’ satisfaction and their expectations of such learning systems. A holistic approach based on students’ satisfaction level and the appropriate measurement analysis should give support to the designers in improving existing and designing new more attractive web based learning models in the contemporary educational blended schemes. And finally, speaking more generally, as a powerful communications and commerce medium, the Internet is a phenomenon that lends itself to a measurement framework (e.g. Kano and D&M models). Within the e-commerce context, the primary system users are customers or suppliers rather than internal users. Customers (students/learners) and suppliers (teachers/instructors) use the e-system for learning, but as well for buying or selling learning courses and kind of execute business transactions. These will undoubtedly impact in greater extend the
38
Sanja Bauk and Jasmin Jusufranic
whole process of learning including individual learners, universities, industries, and even national economies in the future. It can be argued that using ICT has become “must” for HE institutions (Farhan, 2014). The need to reach potential students, regardless of their geographic location, and the need to cut operational costs have made the use of technology a strategic option in providing the viability and sustainability of academic institutions. LITERATURE Armstrong, L. (2000), „A New Game in Town: Competitive Higher Education“, http://www.usc.edu/dept/chepa/papers_papers.html (downloads 11.04.2014) Bauk S., Scepanovic S., and Kopp M. (2014), „Estimating Students’ Satisfaction with Web Based Learning System in Blended Environment”, Education Research International, Volume 2014, Article ID 731720, April 2014, pages 11, http://www.hindawi.com/journals/edri/2014/731720/ (downloads 29.04.2014) Bayus, B. L., Jain, S., and Rao, A. G. (1997), „Too Little, Too Early: Introduction Timing and New Product Performance in the Personal Digital Assistant Industry”, Journal of Marketing Research, 34, 50-63. Bertsekas, D., and Tsitsiklis, J. (2008), Introduction to Probability, 2nd Edition. Athena: Scientific, Nashua, USA. Bloom, D., Canning, D. and Chan, K. (2006), Higher Education and Economic Development in Africa, Harvard University. Clayton Christensen Institute for Disruptive Innovation, (2012-2013), „Blended Learning Model Definitions”, http://www.christenseninstitute.org/blended-learning-model-definitions (downloads 21.10.2013) DeLone, W.H., and Mclean, E.R. (2003), „The DeLone and McLean Model of Information Systems Success: A Ten-Year Update”, Journal of Management Information Systems, 19(4), 9-30. Dominici, G., and Palumbo, F. (2013), „How to build an e-learning product: Factors for student/customer satisfaction”, Business Horizons, Kelley School of Business, Indiana University, 56, 87-96. Farhan, B.Y. (2014), „Information and Communication Technology in Higher Education and its Effects on the Competitiveness of Academic Institutions”, http://papers.ssrn.com/sol3/papers.cfm?abstract_id=2396661 (downloads 05.07.2014.) Garrison, R.D., and Kanuka, H. (2004), „Blended learning: Uncovering its transformative potential in higher education”, The Internet and Higher Education, 7, 95-105. Green, A., Mostafa, T. and Preston, J. (2010), The Chimera of Competitiveness: Varieties of Capitalism and the Economic Crisis. Centre for Learning and Life Chances in Knowledge Economies and Societies, http://www.llakes.org.uk (downloads 22.04.2014) Herrmann, K. (2008), „Higher Education, Business and Future Competitiveness“, CIHE, London http://aces.shu.ac.uk/employability/resources/CIHE%20-%200812KHCompostela-WACE.pdf (downloads 23.04.2014) Hirsch, F. (1976), Social Limits to Growth, Harvard University Press, Cambridge. Kano, N. (1984), „Attractive quality and must be quality”, Hinshitsu (Quality), 14(2), 147-156. Kondapalli, P. R. (2014), „Role of open and distance institutions in scaling up quality education for all”, www.col.org/pcf6/fp/zIN1221.doc (downloads 05.07.2014.) Marginson, S. (2006), „Dynamics of national and global competition in higher education“, Higher Education, No. 52, 1-39 Maringe, F. and Gibbs, P. (2009), Marketing Higher Efucation, Theory and Practice, McGraw Hill, London. Matzler, K., and Hinterhuter, H.H. (1998), „How to make product development project more successful by integrating Kano’s model of customer satisfaction into quality function deployment”, Technovation, 18(1), 25-38. OECD (2010), Education at a glance, OECD Publishing. Owston, R., York, D., and Murtha, S. (2013), „Student perceptions and achievement in a university blended learning strategic initiative”, The International and Higher Education, 18, 38-46. Schvaneveldt, S. J., Enkawa, T., and Miyakawa, M. (1991), „Consumer evaluation perspectives of service quality: evaluation factors and two-way model of quality”, Total Qualaity Management, 2(2), 149161. Tailor, R. (1990), „Interpretation of Correlation Coefficient: A Basic Review”, Journal of Diagnostical Medical Sonography, 6(1), 35-39.
COMPETITIVENESS IN HIGHER EDUCATION IN TERMS OF THE LEVEL OF STUDENTS' SATISFACTION WITH E-LEARNING IN BLENDED ENVIRONMENT
39
Tamándl, L. and Nagy, D. (2013), „Competitiveness Factors of Higher Education Institutions, with Particular Respect to Hungarian Cities“, in Proceedings REAL CORP 2013 Tagungsband, 20-23 May, Rome, Italy, 1125-1129. Walden, D. (1993), „A Special Issue On: Kano’s Methods for Understanding Customer Defined Quality”, Center for Quality of Management Journal, 2(4), 1-37. Weltner, K. et al. (2009), Mathematics for Physicists and Engineers (Fundamentals and Interactive Study Guide). Berlin: Springer. World Economic Forum (2006), 2006-7 Global Competitiveness Report, 26th September.
Appendix 1 In Table 6 below is given an example of processing the students' responds on the first question in the questionnaire concerning technical stability (reliability) of the considered e-learning system (SR1, i.e. students’ requirement no. 1) at International university of Travnik within blended environment. Both functional and dysfunctional dimensions of Kano model are taken into the consideration. Table 6: An example of processing students’ requirements when e-learning system in blended model is in matter, in accordance to Kano two-dimensional model SR1: Technical stability (reliability) of the system No. 1. 2. 3. 4. 5. 6. 7. 8. 9. 10. 11. 12. 13. 14. 15. 16. 17. 18. 19. 20. 21. 22. 23. 24. 25. 26. 27. 28. 29.
4
Functional 2 0 -1 1.00 1.00 1.00 1.00
-2
4 1.00
Dysfunctional 2 0 -1
-2
1.00 1.00 1.00 1.00 1.00
1.00
1.00 1.00
1.00
1.00
1.00 1.00 1.00
1.00 1.00 1.00
1.00 1.00 1.00
1.00 1.00 1.00
1.00 1.00 1.00
1.00 1.00 1.00
1.00 1.00
1.00 1.00 1.00 1.00 1.00 1.00
1.00 1.00 1.00 1.00
1.00
1.00 1.00 1.00 1.00
1.00 1.00
1.00 1.00
1.00 1.00 1.00 1.00
SR M I I M Q Q M A I I Q I M O I M I O O M M O I I A O O M M
40
Sanja Bauk and Jasmin Jusufranic
30. 31. 32. 33. 34. 35. 36. 37. 38. 39. 40. 41. 42. 43. 44. 45. 46. 47. 48. 49. 50. 51. 52. 53. 54. 55. 56. 57. 58. 59. 60. 61. 62. 63. 64. 65. 66. 67. 68. 69. 70.
1.00
1.00
1.00
1.00 1.00
1.00 1.00
1.00 1.00
1.00 1.00 1.00
1.00 1.00 1.00
1.00
1.00 1.00
1.00 1.00
1.00
1.00 1.00
1.00 1.00 1.00 1.00
1.00 1.00 1.00 1.00
1.00
1.00 1.00 1.00
1.00 1.00 1.00 1.00
1.00 1.00 1.00
1.00 1.00
1.00 1.00 1.00
1.00 1.00 1.00
1.00
1.00 1.00
1.00
1.00 1.00
1.00
1.00 1.00 1.00 1.00 1.00 1.00 1.00
1.00 1.00 1.00
1.00 1.00 1.00 1.00 1.00 1.00 1.00 1.00 1.00 1.00 1.00 1.00 1.00
1.00
1.00
Source: authors’ creation Legend: (a) Dimensions:
Functional: -2 (dislike), -1 (live with), 0 (neutral), 2 (must-be), 4 (like) Dysfunctional: -2 (like), -1 (must-be), 0 (neutral), 2 (live with), 4 (dislike)
I M O I A I M Q I I A M I M I R O M I M Q I I I R I I M A M M M R M I Q R O Q O A
COMPETITIVENESS IN HIGHER EDUCATION IN TERMS OF THE LEVEL OF STUDENTS' SATISFACTION WITH E-LEARNING IN BLENDED ENVIRONMENT
41
(b) Kano model attributes:
M: Must-be O: One-dimensional A: Attractive I: Indifferent Q: Questionable R: Reverse
Notes: In an analogous manner are processed SR2-10 questions within conducted survey among the students at the International university of Travnik (Bosnia and Herzegovina). The survey is realized in June 2014. Appendix 2 Within this appendix is given the questionnaire (created by authors, due to the basic principles of Kano model) which has been recently delivered among 70 students at International university of Travnik (Bosnia and Herzegovina), and upon which the above presented analysis have been realized (Table 7). Table 7: The questionnaire by which Kano analysis are realized 1. I like it. (4) 2. It must be that way. (2) 3. I am neutral. (0) 4. I can live with it. (-1) 5. I do not like it. (-2) 1. I like it. (-2) 1.b) System of e2. It must be that way. (-1) learning is not sta3. I am neutral. (0) bile in technical 4. I can live with it. (2) terms. 5. I do not like it. (4) How much is this issue important to you? (1-almost irrelevant ... 9-extremely important) - Circle one number on the bottom scale: 1 2 3 4 5 6 7 8 9 1. I like it. (4) 3.a) On-line available 2. It must be that way. (2) educational materials are of satisfac3. I am neutral. (0) tory quality in con4. I can live with it. (-1) tent and scope? 5. I do not like it. (-2) 1.a) System of elearning is stabile in technical terms.
3.b) On-line available educational materials are not of satisfactory quality in content and scope?
1. I like it. (-2) 2. It must be that way. (-1) 3. I am neutral. (0) 4. I can live with it. (2) 5. I do not like it. (4)
How much is this issue important to you? (1-almost irrelevant ... 9-extremely important) - Circle one number on the bottom scale: 1 2 3 4 5 6 7 8 9 5.a) Collaborative 1. I like it. (4) activities are com2. It must be that way. (2)
1. I like it. (4) 2. It must be that way. (2) 2.a) System of e-learning 3. I am neutral. (0) is “user friendly”. 4. I can live with it. (-1) 5. I do not like it. (-2) 1. I like it. (-2) 2. It must be that way. (-1) 2.b) System of e-learning 3. I am neutral. (0) is not “user friendly”. 4. I can live with it. (2) 5. I do not like it. (4) How much is this issue important to you? (1-almost irrelevant ... 9-extremely important) - Circle one number on the bottom scale: 1 2 3 4 5 6 7 8 9 1. I like it. (4) 4.a) In addition to text and graphic files, the system has enough audio and video material.
2. It must be that way. (2) 3. I am neutral. (0) 4. I can live with it. (-1) 5. I do not like it. (-2)
4.b) In addition to text and graphic files, the system has not enough audio and video material.
1. I like it. (-2) 2. It must be that way. (-1) 3. I am neutral. (0) 4. I can live with it. (2) 5. I do not like it. (4)
How much is this issue important to you? (1-almost irrelevant ... 9-extremely important) - Circle one number on the bottom scale: 1 2 3 4 5 6 7 8 9 6. a) There are ample 1. I like it. (4) opportunities for self2. It must be that way. (2)
42
Sanja Bauk and Jasmin Jusufranic mon (forums, wiki, chat, etc).
3. I am neutral. (0) 4. I can live with it. (-1) 5. I do not like it. (-2)
5.b) Collaborative activities are not common (forums, wiki, chat, etc).
1. I like it. (-2) 2. It must be that way. (-1) 3. I am neutral. (0) 4. I can live with it. (2) 5. I do not like it. (4)
How much is this issue important to you? (1-almost irrelevant ... 9-extremely important) - Circle one number on the bottom scale: 1 2 3 4 5 6 7 8 9 1. I like it. (4) 7.a) E-learning sys2. It must be that way. (2) tem includes mandatory online home3. I am neutral. (0) works / tests / es4. I can live with it. (-1) says. 5. I do not like it. (-2) 1. I like it. (-2) 7.b) E-learning system does not include 2. It must be that way. (-1) mandatory online 3. I am neutral. (0) homeworks / tests / 4. I can live with it. (2) essays. 5. I do not like it. (4) How much is this issue important to you? (1-almost irrelevant ... 9-extremely important) - Circle one number on the bottom scale: 1 2 3 4 5 6 7 8 9 1. I like it. (4) 2. It must be that way. (2) 9.a) There is an e3. I am neutral. (0) tutor. 4. I can live with it. (-1) 5. I do not like it. (-2) 1. I like it. (-2) 2. It must be that way. (-1) 9.b) There is not an 3. I am neutral. (0) e-tutor. 4. I can live with it. (2) 5. I do not like it. (4) How much is this issue important to you? (1-almost irrelevant ... 9-extremely important) - Circle one number on the bottom scale: 1 2 3 4 5 6 7 8 9
checking of gained knowledge (on-line tests, educational games, etc). 6. b) There are not ample opportunities for selfchecking of gained knowledge (on-line tests, educational games, etc).
3. I am neutral. (0) 4. I can live with it. (-1) 5. I do not like it. (-2) 1. I like it. (-2) 2. It must be that way. (-1) 3. I am neutral. (0) 4. I can live with it. (2) 5. I do not like it. (4)
How much is this issue important to you? (1-almost irrelevant ... 9-extremely important) - Circle one number on the bottom scale: 1 2 3 4 5 6 7 8 9 1. I like it. (4) 2. It must be that way. (2) 8.a) E-learning is combined with classroom 3. I am neutral. (0) based courses. 4. I can live with it. (-1) 5. I do not like it. (-2) 1. I like it. (-2) 2. It must be that way. (-1) 8.b) E-learning is not combined with class3. I am neutral. (0) room based courses. 4. I can live with it. (2) 5. I do not like it. (4) How much is this issue important to you? (1-almost irrelevant ... 9-extremely important) - Circle one number on the bottom scale: 1 2 3 4 5 6 7 8 9 1. I like it. (4) 10.a) System of e2. It must be that way. (2) learning can be ac3. I am neutral. (0) cessed at any time. 4. I can live with it. (-1) 5. I do not like it. (-2) 1. I like it. (-2) 2. It must be that way. (-1) 10.b) System of elearning can not be ac3. I am neutral. (0) cessed at any time. 4. I can live with it. (2) 5. I do not like it. (4) How much is this issue important to you? (1-almost irrelevant ... 9-extremely important) - Circle one number on the bottom scale: 1 2 3 4 5 6 7 8 9
Source: authors’ creation Task for the students who were interviewed: Circle only one statement for X.a) and X.b) ( X 1,10 ), which are closest to your attitude towards certain assumption related to an e-learning system in blended model. The survey is realized in June 2014, among the students of International university of Travnik, as it is noted previously.
RELATIONSHIP BETWEEN THE SCHOOL PRINCIPAL LEADERSHIP STYLE AND TEACHERS’ JOB SATISFACTION SERBIA MONTENEGRIN JOURNAL OF ECONOMICS, Vol. 10, No. IN 1 (July 2014), 43-57
43
RELATIONSHIP BETWEEN THE SCHOOL PRINCIPAL LEADERSHIP STYLE AND TEACHERS’ JOB SATISFACTION IN SERBIA IVANA JOSANOV-VRGOVIC1 NEBOJSA PAVLOVIC2 ABSTRACT The principal leadership style is his/her behaviour in a working process, which influences all school relevant performances. Teachers’ job satisfaction refers to the affective attitude of teachers towards their role, derived from the evaluation of characteristics of the job itself. The aim of this research is to define relationship between school principal style and teachers' satisfaction. The sample includes 22 primary and secondary schools from Serbia. In this paper, authors used two different instruments to determine behaviour of principals and teachers satisfaction. First instrument that determines leadership style of the school principal is adapted Blake’s instrument also known as the managerial grid model. The second instrument used is Job Satisfaction Survey (JSS) in order to obtain information on teachers’ satisfaction. In each school 10 teachers and their principals filled in the questionnaire. This JSS collected 220 teachers’ answers and 22 principals’ answers. Results indicate that the school principal leadership style influences teacher’s satisfaction. Principals that are people-oriented positively influence teacher’s satisfaction in the areas school development, management, relationship with colleagues and teamwork. Principal that are tasks-oriented negatively influence teacher’s satisfaction in the areas of communication, management, school development and safety. Also, results indicate that teachers are mostly satisfied with aspects of safety, working skills, and nature of work. KEYWORDS: Leadership style, teachers’ job satisfaction, the managerial grid model, educational management
JEL Classification: I21 Received: February 02, 2014 / Accepted: June 22, 2014
1. INTRODUCTION Education is the fundamental of the development of modern society. The most significant factors in the educational resources include quality and number of staff in educational institutions, quality of education, principal leadership style, work equipment and working environment. A number of studies show that teachers are becoming less satisfied with their jobs and show the intention to leave the profession and organization (Perie and Baker, 1997; Evans, 1998). Principal and teachers help school to achieve its goals. Principal leadership style and teachers' satisfaction are two very important factors for the work of the school. A large number of researches came to a conclusion that the principal leadership style is one of the most important factors of teachers’ satisfaction (Herzberg et al. 1959; Kusum and Billingsley, 1996; Perie and Baker, 1997; Dinham and Scott, 1998; Evans, 1998; Tillman and Tillman, 2008; Sharma and Jyoti, 2006). In addition to the principal leadership style, the most frequently included factors of teachers’ satisfaction are nature of work, working conditions, personality and teacher behavior, demographic factors, interaction with students, the ability to contribute to the growth and development of students, teachers' autonomy, culture and climate of the school, etc.
1 2
Modern Business School, Belgrade, Serbia, Assistant professor,
[email protected] Faculty of Hotel Management and Tourism, Vrnjacka Banja, Serbia, Assistant professor,
[email protected]
44
Ivana Josanov-Vrgovic and Nebojsa Pavlovic
The principal leadership style is principal’s behaviour in a working process, which influences all school performances. A competent principal with leadership competencies has a great impact on teachers. He/she creates his/her management style through education, training and personal development (Spector, 1997), he/she provides creative working environment (Hallingera and Heck, 1998) and positive climate in school. The second critical factor of school efficiency is teachers’ satisfaction. Teacher who is not satisfied with work can perform poor teaching and relationship with students, which can have a negative impact on the school efficiency (Chieffo, 1991). Job satisfaction in schools is important because it contributes to organizational learning and teaching effectiveness, ultimately affects the achievement of students themselves (Rowan et al., 2002), their study (Sharma and Jyoti, 2006), their social, emotional, intellectual development and academic success (Blandford, 2000). Also, teachers who do not feel supported in their work may be less motivated to give their best in the classroom, and teachers who are very satisfied with their jobs are very unlikely to change the institution they work for or to change their profession. Research presented explored problem of relationship between leadership style and teachers’ satisfaction. It is assumed that the style of the school’s principal influences teachers’ satisfaction. School employees were selected for the survey sample due to their great importance for the community, since extremely important and socially recognized work is involved: teaching and educating young people and their preparation for professional work. The results of a large number of studies have also shown that job satisfaction is positively related to productivity, while it is negatively related to absenteeism and fluctuations (DeCotiis and Summers, 1987; Huang, 2004). For avoiding fluctuation and absenteeism in schools, it is necessary to identify the factors that influence teachers’ satisfaction. It is assumed that leaders in educational institutions are the same as leaders in other organizations. For the research of principals’ style, a two dimensional matrix is used, which includes coordinates for people and tasks, and it is known as the managerial grid (Blake and Mouton, 1985). This model includes the entire sequence of styles and possibilities. The leader can move within the network so it is observable: to check if his/her orientation moved to task or people. The most important advantage of the managerial grid is that the leader can adapt his/her style to a specific situation at school. In order to be effective, he/she has to maintain the attention on people and tasks. The emphasis of this system is placed on team leadership. The theoretical importance of research is reflected in better familiarity of connection between leaders’ orientation and teachers’ satisfaction. Research includes only one region of Serbia. Further research is recommended since certain limitations might occur. 2. RELATED WORKS Everyday experiences show that the individual performing of tasks is very important. Almost every adult is half of his life involved in some form of labor. When you take into account the time spent being educated for a specific work and working, as well as periods of free time filled with worries and problems at the workplace, the initial hypothesis about the central role of work in human life is not difficult to justify. Since a large part of human life is spent in a workplace place, it can be assumed that life should be pleasant and comfortable. Job satisfaction and job dissatisfaction, satisfaction and dissatisfaction with workplace affect the mental health of humans as well as in other areas of his life. These are the reasons why job satisfaction has become one of the most studied concepts in the field of organizational psychology, organizational behavior and human resource management. The school is a kind of a working organization, whose goals can be classified in a same way as goals of every other organization (Pastuović, 1999). The satisfaction of teacher with work should be one of the desired outcomes of every school/educational institution (Schulz and Teddlie, 1989), because it contributes to organizational and teaching effectiveness, which ultimately affects the achievement of students themselves and their learning (Sharma and Jyoti, 2006).
RELATIONSHIP BETWEEN THE SCHOOL PRINCIPAL LEADERSHIP STYLE AND TEACHERS’ JOB SATISFACTION IN SERBIA
45
The literature includes numerous attempts to define the job satisfaction. Hoppok is considered the first theorist, industrial psychologist, who introduced the concept of satisfaction with work in the literature (1935). This construct described it as a combination of psychological, physiologic and environmental events that will make a person to say: “I am satisfied with my work“. Vroom defines satisfaction with work as an affective orientation of a person to his/her working role (Vroom, 1964). According to Locke, the satisfaction with work is comfortable or positive emotional condition which derives from the work evaluation or working experience (1976). Smith argues that job satisfaction is an effective response of a worker to business (Smith, 2000). The person with high level of job satisfaction has positive feelings about his/her work while person who is not satisfied has negative feelings regarding his/her work. According to several authors, job satisfaction is actually an attitude we have towards the job (Grinberg and Baron, 1998; Robbins, 2001; Vujić, 2008). Job satisfaction as an attitude has three main components: cognitive, affective and behaviour component. The cognitive component consists of a number of assumptions and beliefs about the job; the affective component consists of feelings toward their work and behavioral component. Based on these structures, job satisfaction can be defined as cognitive, affective and behavioral reactions of individuals to their jobs. Definition of job satisfaction has evolved during time, and many people believe that job satisfaction is connected with positive affective reaction. In other words, job satisfaction is a general affective orientation towards work, a general feeling towards it or an affective response to a type of person, the type and content of work (Smith et al., 1969; Guzina, 1980; Kreitner er al., 1999). Job satisfaction defined in this way could be operationalized as love for one’s job or as a degree to which people like their jobs. According to these common definitions, satisfaction with work can be accepted as an affective condition of comfortability or hostility, which appears when teacher evaluates his/her working role (Domović, 2004). The teacher’s job satisfaction is also related to the affective attitude of teachers towards their role, while the function of teacher’s satisfaction is perceived as the relationship between what he/she wants from teaching and what is offered to him/her (Zembylas and Papanastasiou, 2004). Consequences appear when employees like or dislike their job. When they are satisfied, they do not want to leave the organization. On the other hand, when they are not satisfied, they want to leave the organization. If they are dissatisfied with work, they can react against this condition. Dissatisfied employees passively observe the situation and allow the things to get worse (Robbins and Judge, 2009). Satisfaction can have the impact on work (Lee and Ahmad, 2009) and on work in the school (Filak and Sheldon, 2003). Although, there is no strong acceptance between researchers and consultancies that higher satisfaction with work can produce better working performances. Teachers noted that they get most satisfaction from the work with young people (students) in: monitoring their growth and development; enjoying in seeing how they grow and mature; the pleasure to do something they enjoy (love toward their subject and teaching); the flexibility and freedom of behavior in the classroom (Brunetti, 2001; Marston et al., 2006). It confirms research results according to which the satisfaction with work is more connected with intrinsic rewards (Farrar, 1981; DeJesus, 1991; Choy et al., 1993; Porter, 1993; Dinham and Scott, 1996; Domović, 2004; Noddings, 2006; Sharma and Jyoti, 2006, 2009). National culture can have a strong influence on employees’ satisfaction (Robbins and Judge, 2009). Hofstede defined following culture features for south-east Europe: high distance of power, high level of risk avoidance, highlighted collectivism and “female culture” – social status is appreciated as an instrument for obtaining of material wealth (Vujić, 2008). Jerotić argued on the topic of working dissatisfaction caused by the environment of people who live in area of southeast European country (Jerotić, 1993). Teachers’ satisfaction is also under the influence of their relationship with the school principal. If the same principle is applied to school like in all other organizations, their most important correlation is reflected in areas of communication, tasks allocation, and responses. All of these previously mentioned the influence on teachers’ satisfaction (Hackman and Oldham, 1975). According to Herzberg, there are two kinds of factors that influence job satisfaction: exter-
46
Ivana Josanov-Vrgovic and Nebojsa Pavlovic
nal and internal factors (Herzberg, 1966). Principal and his/her management are one of external factors with strong influence on attitudes of teachers. The positive attitude improves the relationship between principal and teachers. Therefore, teachers get internal motivation. The good balance between external and internal factors improves higher satisfaction of teachers. Different instruments could be used for measuring of job satisfaction. Most frequently used are Job Satisfaction Survey (JSS) developed by Paul Spector, 1985 (Spector, 1985) and The Minnesota Satisfaction Questionnaire (MSQ, 1967 and 1977) (Weiss et al., 1967). Teachers work includes interaction with colleagues, principal, parents, students, respect for rules and policies, achieving standards in performances, accepting working requirements that are far from ideal ones (Robbins and Judge, 2009). It means that satisfaction evaluation of teacher is a result of complex analysis that includes numerous, as well as different working elements. Some of these elements are: communication, satisfaction, working skills, career, school development, management, and relationship with colleagues, teamwork, equality, and safety (Hilgerman, 1998; Friday and Friday, 2003). We also find some attempts of measuring only one item presented in form of a question: “Think about the work you are doing, balance all its advantages and limitations and then evaluate to which extent you are actually satisfied with your job” (Benmansour, 1994). Research studies about influence of leadership style on job satisfaction imply the fact that the school principal style plays an important role in influencing teachers’ job satisfaction (Skrapits, 1986; Rosenholtz, 1989; Andermann et al., 1991; Billingsley, 1993; Lashbrook, 1997; Lok and Crawford, 1999; Schultz and Teddlie, 1999; Dinham and Scott, 2000; Bogler, 2001; Griffith, 2004; Mehrotra, 2005; Sharma and Jyoti, 2006; Cerit, 2009; Jošanov-Vrgović, 2012). Open-minded principals with friendly, relaxed, attentive, impartial, supportive behavior, who are better communicators and who value their subordinates contribute to greater teachers’ satisfaction. Teachers are also more satisfied with their jobs if managers provide support, develop a positive climate in the school, keep open communication with dignity and treat teachers with respect (Evans and Johnson, 1990; Ma et al., 1999). Principals who assist in the professional growth and development of teachers and enable the development of their skills, knowledge and abilities, usually increase their job satisfaction (Ma et al., 1999; Dinham and Scott, 2000; Bogler, 2001; Cerit, 2009). Some researchers have shown that behavior of directors in supporting educational institutions has a positive effect on job satisfaction of teachers and their desire and decision to remain in the institution (Kusum and Billingsley, 1996). Other researchers discovered that different leadership styles will create different working environments and that they have a direct influence on job satisfaction (Timoty and Ronald, 2004). According to Northouse, leadership is a process in which individual has an influence on the group in order to achieve common goal (Northouse, 2008). Leaders and followers are the part of the leadership and they have to be analysed within their relationships. The school principals are selected in a specific way. Principal is always a leader and teachers as followers have elected him/her for this position. They recognized him/her as their leader. Teachers have voluntarily agreed to place a leader as a person who will guide them through their work. In accordance with the selected managerial grid model, leaders can demonstrate people-oriented and tasks-oriented behaviour. Effective leadership usually lies in the fact that leader balances between these two behaviours. Approach to the leadership styles is applied very easy in different leadership situations. In the school, leader constantly expresses his/her behaviour related to tasks and people. Evaluation of leadership style can also lead to the information of a way in which leader communicates with others and how they can change their behaviour in order to achieve higher efficiency (Blake and Mouton, 1985). The managerial grid model is a behavioral leadership model developed in early ‘60s by Robert R. Blake and Jane Mouton and it was updated several times (Blake and Mouton, 1964, 1978, 1985; Blake and McCanse, 1991). This model originally identified five different leadership styles based on the concern for people and the concern for tasks. It is designed to explain how managers can help organizations to fulfil their purpose using two factors: concern for people and concern for tasks. Concern for people is related to a way in which leader treats staffs in organiza-
RELATIONSHIP BETWEEN THE SCHOOL PRINCIPAL LEADERSHIP STYLE AND TEACHERS’ JOB SATISFACTION IN SERBIA
47
tion who attempt to achieve their goals; while concern for tasks is related to a way in which leader conducts organizational tasks (Blake and Mouton, 1985). The managerial grid model combines concern for tasks and concern for people in the model which contains two axes that intersect. Vertical axis represents concern for people while horizontal axis represents leaders concern about tasks. Each axis contains scale with 9 points, where 1 presents minimum and 9 presents maximum concern. By connecting results of each of axis, different leadership styles can be presented. The managerial grid model can contain 5 basic leadership styles: Impoverished management (1,1), Country club management (1,9), Authoritycompliance (9,1), Middle of the road management (5, 5) and Team management (9, 9). Impoverished management (1,1) – This style represents a leader who does not care about tasks and relationships. This kind of leader is not interested, not committed and has a lack of will to fulfil defined goals. Country club management (1,9) – This style is characterized by a lack of concern for tasks and a great concern for relationships between people. These leaders create positive atmosphere, cooperation, and they are willing to help and comfort. Leaders take care about attitudes and feelings of people, and individuals are obliged to achieve personal and social requirements. Authority-compliance (9,1) – This style is characterized by a strong aligning of tasks and weaker emphasizing of people role. It is also being driven by results while people are seen as working tools. This leader prefers control, he/she is demanding, energetic and authoritative. Middle of the road management (5,5) – This style represents leaders who are willing to compromise and who are moderately interested in tasks and people. They find balance by being oriented to people and to tasks. This leader mitigates disagreements and prefers middle solutions. Team management (9,9) – This style presents leaders whose highlighted concern are people and tasks. This leader encourages involvement, works excellently, solves problems, clarifies authority and follows progress. Also, he/she is open for suggestions and enjoys in work. High level of participation and teamwork are promoted. There is no consensus which leadership style is the best solution. Some researchers suggest that managers with maximum concern for tasks and people are most effective (Blake and McCanse, 1991). Others argue that there is no complete connection between maximum results and effectiveness in all situations (Yukl, 1994). 3. METHODOLOGY The problem of this research was: Establishing to what extent the connection between principal orientations and teachers’ satisfaction in the school is observed. Specific problems are following: a) what is the connection between principals’ people-oriented style and teachers’ satisfaction, b) what is the connection between principals’ tasks-oriented style and teachers’ satisfaction, and c) does the dominant leadership style influence differences in teachers’ satisfaction patterns. The research problem created common hypothesis: H: There is statistically significant connection between school principal’s leadership style and teachers’ satisfaction. Specific hypotheses are following: H1: There is statistically significant correlation between principals’ people-oriented style and teachers’ satisfaction; H2: There is statistically significant correlation between principals’ tasks-oriented style and teachers’ satisfaction; H3: Leader’s score on the “people-orientation” scale can be described by the employees’ scores on the job satisfaction scales via linear regression analysis; H4: Leader’s score on the “tasks-orientation” scale can be described by the employees’ scores on the job satisfaction scales linear regression analysis. The main objective of this research is the following: determining whether there is a connection between principals’ leadership style and teachers’ satisfaction in the school workgroup. As this objective postulates causality between the leadership style and employees’ satisfaction, this research should try to examine the hypothetical model where the leadership style can be backtracked by the employees’ satisfaction structure and levels. However, the exploratory nature of this research proposes to observe correlations between the two concepts, which should pre-
48
Ivana Josanov-Vrgovic and Nebojsa Pavlovic
cede the model verification stage. Therefore, specific objectives are set as follows: a) to determine whether there is statistically significant correlation between principals’ people-oriented style and teachers’ satisfaction, b) to determine if there is a statistically significant correlation between principals’ tasks-oriented style and teachers’ satisfaction, c) to determine if ten dimensions of satisfaction can be regressed to principals’ people-oriented style and d) to determine if ten dimensions of satisfaction can be regressed to principals’ tasks-oriented style. The researchers used two instruments. First instrument is used for determination of leadership style of the school principal. For purpose of researching the behaviour of school’s principal, the adapted Blake’s instrument is used, which is also known as the managerial grid model (Blake and Mouton, 1985). The instrument includes 18 questions with Likert scale (5 statements), of which 9 questions are related for concern for people (y-axis) and the other 9 questions are related for concern for tasks (x-axis). The second instrument is used in order to obtain information on teachers’ satisfaction, and it is called Job Satisfaction Survey (JSS) (Spector, 1985). In this research, the adapted version is used, which includes 29 questions with Likert scale (5 statements). These questions should describe aspects of satisfaction related to work. The sample includes 22 primary and secondary schools from one region in Serbia. From each school 10 teachers and their principals filled in the questionnaire. This process resulted with 242 respondents, of which 220 are teachers and 22 principals. Out of 22 principals 14 are females and 8 are males. The dependent variable is teachers’ satisfaction. It is operationalized through 10 areas: career, communication, nature of work, school development, work training, management, and relationship with colleagues, team work, equality and safety. These aspects are needed for the description of the dependent variable. The independent variables are related to style and orientation of a leader. There are three independent variables: principal’s score on the people-oriented scale, principal’s score on the task-oriented scale, and principal’s general leadership style defined as “people-oriented” or “taskoriented” - when the difference between the two scales was greater than 3 units (otherwise, the “mixed leadership style” was attributed to the principal). People-oriented leader is a leader who is a team leader, and he/she is oriented to people. It means that this leader obtained better results on relationship with people than results on relationship with tasks. Tasks-oriented leader is also a team leader with better results on relationship with tasks than relationship with people. Leader who uses mixed leadership style is people-oriented and tasks-oriented in the same amount. We provide a) descriptive statistics (arithmetical mean and standard deviation) of all variables and b) concluding statistics, which include correlation and regression techniques for determination of direction and level of connection between dependent and independent variable, as well as an ANOVA test for three identified leadership styles. 4. RESULTS 4.1 Descriptive statistics As it can be seen in Table 1, all areas of teachers’ satisfaction are relatively high. At the scale from 1 to 5, they all are over the value 3. However, respondents presented the highest satisfaction with safety, working skills and nature of work. After that, there are: management, communication, school development, equality, teamwork, relationship with colleagues and career. It should be noted that there is very small scope of areas with highest and lowest level of satisfaction. As we can seen in Table 2 the total of teachers’ satisfaction is relatively high (M=3,81).
RELATIONSHIP BETWEEN THE SCHOOL PRINCIPAL LEADERSHIP STYLE AND TEACHERS’ JOB SATISFACTION IN SERBIA
49
Table 1: The descriptives of the teachers’ satisfaction areas Career Communication Nature of work School development Working skills Management Relationship with colleagues Team work Equality Safety
N 220 220 220 220 220 220 220 220 220 220
Min 1 1 1 1 1 1 1 1 1 1
Max 5 5 5 5 5 5 5 5 5 5
M 3,41 3,94 3,99 3,8 4,02 3,95 3,60 3,67 3,86 4,10
SD 0,870 0,710 0,761 0,773 0,598 0,765 0,762 1,049 0,911 0,942
N-number of respondents, Min-minimum, Max-maximum, M-arithmetic means, SD-standard deviation Table 2: The total of teachers ‘satisfaction
Teachers’ satisfaction
N
Min
Max
M
SD
220
1
5
3,81
0,489
N-number of respondents, Min-minimum, Max-maximum, M-arithmetic means, SD-standard deviation The average orientation of school principal to people is M=7,36, while his/her average tasks-orientation is M=7,45 (see Table 3). Therefore, the difference is very small, so we can say that school principals in this sample are equally oriented to people and tasks. The gender differences were also observed and presented in the same table, but there were not any significant differences found. Table 3: The magnitude of people-orientation and tasks-orientation by the school principal People-oriented style Tasks-oriented style People-oriented style (female) People-oriented style (male) Tasks-oriented style (female) Tasks-oriented style (male)
N 22 22 14 8 14 8
Min 5,8 6,4 5,8 6,0 6,4 6,7
Max 8,6 8,4 8,6 8,3 8,1 8,4
M 7,36 7,45 7,79 7,28 7,32 7,59
SD 0,783 0,675 0,695 0,822 0,642 0,718
N-number of respondents, Min-minimum, Max-maximum, M-arithmetic means, SD-standard deviation 4.2 Correlation analysis Spearman correlation coefficient is used for investigating the connection between principals’ people-oriented style and teachers’ satisfaction in individual areas and in total value (see Table 4). There is statistically significant positive connection of principals’ people-oriented style and satisfaction with school development (rho=0,760, p=0,007), relationship with colleagues (rho=0,691, p=0,019) and teamwork (rho=0,615, p=0,044). All statistically significant correla-
50
Ivana Josanov-Vrgovic and Nebojsa Pavlovic
tions are positive, which implies that increasing of one variable result in the increase of another and vice versa. It should be noted that all statistically significant correlations are high in scope from 0,615 to 0,760. There is no statistically significant connection between principals’ peopleoriented style and satisfaction in areas of communication, nature of work, working skills, career, management, equality and safety. Also, there is no statistically significant connection between principals’ people-oriented style and overall score from the satisfaction scale. Table 4: Correlation between principals’ people-oriented style and satisfaction of teachers
Career Communication Nature of work School development Working skills Management Relationship with colleagues Teamwork Equality Safety Total satisfaction of teachers
rho p rho p rho p rho p rho p rho p rho p rho p rho p rho p rho p
People-oriented style ,168 ,621 ,364 ,270 ,377 ,253 ,760** ,007 -,365 ,270 ,589 ,056 ,691* ,019 ,615* ,044 ,481 ,135 ,575 ,064 ,581 ,061
* Statistical significance on the level 0,05, * *Statistical significance on the level 0,01, rho-Spearman correlation coefficient , p – Statistical significance Connection between principals’ tasks-oriented style and teachers’ satisfaction were also explored (see Table 5). Spearman correlation coefficient showed that there is statistically negative correlation between principals’ tasks-oriented style and teachers’ satisfaction in areas of communication (rho=-0,612, p=0,046), school development (rho=-0,380, p=0,049) and safety (rho=-0,739, p=0,009). These results suggest that more principal is oriented to task, teachers are less satisfied with communication, school development and safety. There is no statistically significant connection between principals’ tasks-oriented style and satisfaction in areas working skills, career, relationship with colleagues, teamwork, and equality. Also, principals’ tasksoriented style is not in statistically significant positive correlation with overall score regarding the satisfaction of teachers.
RELATIONSHIP BETWEEN THE SCHOOL PRINCIPAL LEADERSHIP STYLE AND TEACHERS’ JOB SATISFACTION IN SERBIA
51
Table 5: Correlation between principals’ tasks-oriented style and teachers’ satisfaction Career Communication Nature of work School development Working skills Management Relationship with colleagues Teamwork Equality Safety Total satisfaction of teachers
rho p rho p rho p rho p rho p rho p rho p rho p rho p rho p rho p
Tasks-oriented style -,043 ,899 -,612* ,046 -,433 ,184 -,380** ,049 ,122 ,721 -,461 ,153 ,096 ,778 ,148 ,664 -,582 ,060 -,739** ,009 -,462 ,152
* Statistical significance on level 0, 05, * *Statistical significance on level 0, 01, rhoSpearman correlation coefficient, p – Statistical significance 4.3 Regression analysis In reaching the goal of verifying “leadership style” > “employee satisfaction” hypothesis, linear regression analyses have been performed. Although the leadership style dimensions are perceived as independent variables, in this step they were used as “dependent” variables, in attempt to backtrack them by looking at the teachers’ satisfaction structures. Table 6: Regression model coefficients explaining the people-orientation variable Model Dependent Variable: People-orientation
1
(Constant) Communication Nature of work Working skills Career School development Management Relationship with colleagues Team work Equality Safety
Standardized Coefficients Beta -.105 -.117 .066 .092 .254 .238 .298 .223 -.045 -.064
Sig. .000 .095 .057 .269 .187 .000 .003 .000 .001 .417 .289
52
Ivana Josanov-Vrgovic and Nebojsa Pavlovic
The people-orientation dimension was successfully explained by a few teachers’ satisfaction dimensions: school development, management, relationship with colleagues and team work, with adjusted R Square .688 significant at .000 level, as shown in table 6. Since the regression coefficients are positive, it can be concluded that leaders who manifest greater orientation towards people influence greater job satisfaction of their workers on the marked dimensions. The task-orientation dimension was successfully explained by a few teachers’ satisfaction dimensions: communication, school development, management, and safety, with adjusted R Square .465 significant at .000 level, as shown in table 7. It is interesting to notice that the significant regression coefficients are all negative, showing that the observed variables of teachers’ work satisfaction are in favour of leaders that manifest less orientation towards tasks. In other words, leaders who are highly task-oriented tend to make their employees feel less satisfied with their job. Table 6: Regression model coefficients explaining the task-orientation variable Model Dependent Variable: Tasks-orientation
1
(Constant) Communication Nature of work Working skills Career School development Management Relationship with colleagues Team work Equality Safety
Standardized Coefficients Beta -.350 -.091 .058 .177 -.188 -.224 -.171 .106 -.100 -.236
Sig. .000 .000 .254 .458 .053 .035 .031 .109 .076 .168 .003
4.4 Differences between the leadership styles Finally, the principals were categorized in their dominant leadership style types, based on their scores in people-oriented and task-oriented dimensions, as explained in chapter 3. Although the sample of principals was of modest size, we decided to run ANOVA procedure to determine if the employees working under principals with different leadership styles have different satisfaction dimensions patterns. Therefore, these results should be accepted with caution and they call for a new research with bigger sample size of principals. As shown in graph 1, there are significant differences in majority of the satisfaction dimensions that were measured (marked with an asterisk). The “mixed” leadership style dominates in making teachers satisfied with communication within their organization. The “people-oriented” leadership style dominates in making teachers satisfied with career, school development, and management, relationship with colleagues, team work and safety within their organizations. The “task-oriented” leadership style doesn’t result in superior employee satisfaction in any dimension.
RELATIONSHIP BETWEEN THE SCHOOL PRINCIPAL LEADERSHIP STYLE AND TEACHERS’ JOB SATISFACTION IN SERBIA
53
Graph 1: Comparison of work satisfaction dimensions between employees who experience different leadership styles
5. DISCUSSION ABOUT RESULTS The most interesting result of this research is the positive connection between principals’ peopleoriented style and teachers’ satisfaction in the areas: school development, relationship with colleagues and teamwork. The people-oriented leadership style positively influences teacher’s satisfaction in the areas school development, relationship with colleagues and teamwork. Principal concern for people tends to develop democratic relationships that have direct influence on the school development. Furthermore, principal who concerns for people is also concerned about relationships, so the relationship with colleagues in these areas is good. The good teamwork is an evidence of positive school climate and cooperation between teachers, which is expected from his/hers teachers. The research shows that there is negative connection between principals’ tasks-oriented style and communication, school development and safety. The tasks-oriented leadership style negatively influences teacher’s satisfaction in the areas of communication, school development and safety. Conclusions that can be made from the results also show that principal who pays more attention to tasks will have lack of attention directed to communication and safety. Moreover, teachers think that principals oriented to tasks will not develop human resources and democratic relationships which encourage school development. Similar results obtained Robbins in his research (Robbins and Judge, 2009). Previously stated results confirm the proposed specific hypotheses: H1: There is statistically significant correlation between principals’ people-oriented style and teachers’ satisfaction; H2: There is statistically significant correlation between principals’ tasks-oriented style and teachers’ satisfaction; H3: Leader’s score on the “people-orientation” scale can be described by the employees’ scores on the job satisfaction scales via linear regression analysis; H4: Leader’s score on the “tasks-orientation” scale can be described by the employees’ scores on the job satisfaction scales via linear regression analysis. In addition, all these results indirectly confirmed common hypothesis:
54
Ivana Josanov-Vrgovic and Nebojsa Pavlovic
H: There is statistically significant correlation between school principal leadership style and teachers’ satisfaction. Interesting result taken from the presented research is the perception of teachers that they are mostly satisfied with aspects of safety, working skills, and nature of work. Teachers placed safety on the top of satisfaction elements. That means that teachers are satisfied with their job because of its safety. Employment opportunities in Serbia are still very rare and the work of teachers providing higher level of security compared to the most of other professions. Furthermore, teachers consider that they are well trained for their job, meaning that beside the initial education acquired at college, they have the opportunity to achieve professional training. The results obtained on the training and the teachers’ satisfactions are consistent with earlier findings (Cano and Miller, 1992; Yousef, 2002; Sharma and Jyoti, 2006, 2009). Also, teachers are satisfied with their job because they like the nature of work. This result is consistent with earlier findings (Herzberg et al., 1959; Kusum and Billingsley, 1996; Perie and Baker, 1997; Dinham and Scott, 1998; Evans, 1998; Tillman and Tillman, 2008; Sharma and Jyoti, 2006). Teachers are less satisfied with teamwork, relationships with colleagues and career. Career is in the last place because school does not provide financial support for the growth and development of teachers and their progress. Previous researches gave similar results (Domović, 2004; Taylor and Tashakkori, 1995). Presented research indicates an equal number of principals’ people-oriented style and principals’ tasks-oriented style. It means that principals are successful in balancing between two most important aspects in their work: people and tasks. 6. CONCLUSION In the time of rapid and turbulent changes, the issue of employee satisfaction, as well as their stay in the organization, becomes extremely important. Serbia has a large outflow of highly educated people to other countries. It is getting more difficult to find people to work in educational institutions, as well as to find ways to encourage these people to work. We can also find in Serbia the valid understanding that most teachers are not happy with their work. It seems that growing dissatisfaction with the job is the result of falling educational standards. The teachers are unhappy despite various plans and programs that have been implemented to improve their business. Thus, job satisfaction is a key factor in improving the quality of teaching, education and research, as well as the relationship between student-student and teacher. Job satisfaction is an important construct that influences the organizational behavior of employees as well as organizational performance. Teacher’s job satisfaction is important because it contributes to the study of organizational and teaching effectiveness, which ultimately affects the achievement of students themselves, together with their learning. Educational institutions with employed satisfied teachers are more efficient and more productive than the institutions with less satisfied or dissatisfied teaching staff. The study was conducted in order to gain some insight into the field of teachers' job satisfaction and ability to influence certain leadership styles on job satisfaction of teachers. Principal leadership style and teachers' satisfaction are two very important factors for the work of the school. The principal leadership style is principal behaviour in the working process, what influences all school performances. Teachers’ job satisfaction can be defined as affective attitude of teachers towards their role, derived from the evaluation of characteristics of the job itself. Results of numerous researches indicate that leadership style influences teachers’ satisfaction. Presented research shows the influence of the school leadership style on teachers’ satisfaction. Principals’ people-oriented style positively influences teacher’s satisfaction in the areas school development, relationship with colleagues and teamwork. Principals’ tasks-oriented style negatively influences teacher’s satisfaction in the areas communication, school development and safety.
RELATIONSHIP BETWEEN THE SCHOOL PRINCIPAL LEADERSHIP STYLE AND TEACHERS’ JOB SATISFACTION IN SERBIA
55
Presented results show that teachers are satisfied with their work. Teachers are mostly satisfied with aspects of safety, working skills, and nature of work. It is concluded that they will pay attention to work with students and to the better work of the school. Teachers have high opinion on school principals who foster democratic relationships and who have concerns in terms of relationships. They believe that they are well skilled for challenging work in the school, which is why providing career development could have positive influence on their job satisfaction and be a great motivator for teachers. BIBLIOGRAPHY Andermann, E., Belzer, S., Smith, J. (1991), Teacher commitment and job satisfaction: The role of school culture and principal leadership. Paper presented at the annual meeting of the American Educational Research Association, Chicago. Benmansour, N. (1998), “Job Satisfaction, Stress And Coping Strategis Among Moroccan High School Teachers”, Mediterranean Journal of Educational Studies, Vol. 3, No 1. Billingsley, B. S. (1993), “Teacher retention and attrition in special and general education: A critical review of the literature”, The Journal of Special Education, Vol. 27, No 2, 137-174. Blake, R. R., Mouton, J. S. (1985), The managerial grid: The key to leadership excellence, Houston, Golf Publishing. Blake, R., McCanse, A. (1991), Leadership dilemmas-Grid solutions, Houston, Gulf. Blake, R., Mouton, J. (1964), The Managerial Grid: The Key to Leadership Excellence, Houston, Gulf Publishing Co. Blake, R., Mouton. J. (1978), The New Managerial Grid, Houston, TX, Gulf Publishing Company. Blandford, S. (2000), Managing Professional Development in Schools, London, Routledge. Bogler, R. (2001), “The Influence of Leadership Style on Teacher Job Satisfaction:, Educational Administration Quarterly, Vol. 37, No 5, 662–83. Brunetti, G. J. (2001), “Why do they teach? A Study of job satisfaction among long-term high school teachers”, Teacher Education Quarterly, Vol. 28, No 3, 49-74. Cano, J., Miller, G. (1992), “An analysis of job satisfaction and job satisfier factors among six taxonomies of agricultural teachers”, Journal of Agricultural Education, Vol. 33, 9-16. Cerit, Y. (2009), “The Effects of Servant Leadership Behaviours of School Principals on Teachers’ Job Satisfaction”, Educational Management Administration & Leadership, Vol. 37, No 5, 600-623. Chieffo, A. M. (1991), “Factors contributing to job satisfaction and organizational commitment of community college leadership teams”, Community College Review, Vol. 19, No 2, 15-25. Choy, S. P., Bobbitt, S. A., Henke, R. R., Horn, M. L., Lieberman, J. (1993), America’s Teachers: Profile of A Profession, Washington, DC: U.S. Department of Education, Office of Educational Research And Improvement, National Center For Education Statistics. De Cotiis, T. A., Summers, T. P. (1987), „A Path Analisys of a Model of the Antecedents and Consequences of Organizational Commitment“, Human Relations, Vol. 40, 445-470. DeJesus, S. N. (1991), Intrinsic and extrinsic motivational objects in teachers and future teachers, Paper presented at the International School of Psychology Colloquium, Braga, Portugal. Dinham, S., Scott, C. (1996), Teacher satisfaction, motivation and health: Phase one of the Teacher 2000 project, Presented at the annual meeting of the American Educational Research Association. New York. Dinham, S., Scott, C. (1998), “A Three Domain Model of Teacher and School Executive Satisfaction”, Journal of Educational Administration, Vo. 36, No 4, 362–78. Dinham, S., Scott, C. (2000), “Moving into the third, outer domain of teacher satisfaction”, Journal of Educational Administration, Vol. 38, No 4, 379–96. Domović, V. (2004), Školsko ozračje i učinkovitost škole (II izdanje), Zagreb, Naklada Slap. Evans, L. (1998), Teacher Morale, Job Satisfaction and Motivation, London, Paul Chapman. Evans, V., Johnson, D. J. (1990), “The Relationship of Principals’ Leader ship Behavior and Teachers’ Job Satisfaction and Job-Related Stress:, Journal of Instructional Psychology, Vol. 17, No 1, 11–19. Farrar, S. M. (1981), Teacher performance. Paper presented at the annual meeting of the American Research Association, Los Angeles, CA. Filak, V. F., Sheldon, K. M. (2003), “Student Psychological Need Satisfaction and College TeacherCourse Evaluations”, Educational Psychology, Vol. 23, No 3, 235-247.
56
Ivana Josanov-Vrgovic and Nebojsa Pavlovic
Friday, S.S., Friday, E. (2003), “Racioethnic perceptions of job characteristics and job satisfaction”, Journal of Management Development, Vol. 22, No 5, 426-442. Griffith, J. (2004), “Relation of Principal Transformational Leadership to School Staff Job Satisfaction, Staff Turnover, and School Performance”, Journal of Educational Administration, Vol. 42, No 3, 333– 356. Grinberg, B., Baron, R.A. (1998), Ponašanje u organizacijama: Razumevanje i upravljanje ljudskom stranom rada, Beograd, Želnid. Guzina, M. (1980), Kadrovska psihologija, Beograd, Naučna knjiga. Hackman J. R., Oldham, G. R. (1975), “Development of the job diagnostic survey”, Journal of Applied Psychology, Vol. 60, 159-170. Hallinger, P., Heck, R. H. (1998), “Exploring the principals’ contribution to school effectiveness”, School effectiveness and School Improvement,Vol. , No 2, 157-191. Herzberg, F. (1966), Work and the nature of man, Cleveland, World Publishing. Herzberg, F., Mausner, B., Snyderman, B. B. (1959), The Motivation to Work, New Jork, Wiley. Hilgerman, R. (1998), “Communication satisfaction, goal setting, job satisfaction, concretive control, and effectiveness in selfmanaged teams”, Dissertation Abstracts International, Vol. 59, 1661. Hoppok, R. (1935), Job satisfaction, New York, Harper and Brothers. Huang, Y. C. (2004), Job satisfaction and organizational commitment among faculty at Taiwan's higher education institutions (A Dissertation). Faculty of The Graduate College at the University of Nebraska, Omaha. Jerotić V. (2003), Srbija i Srbi, Beograd, Ars Libri. Jošanov-Vrgović, I. (2012), Zadovoljstvo poslom i organizaciona privrženost zaposlenih u obrazovnim institucijama (Doktorska disertacija). ACIMSI, Univerzitet u Novom Sadu. Kreitner, R., Kinicki, A., Buelens, M. (1999), Organizational Behaviour (First European Edition), Berkshire, McGraw-Hill Publishing Company. Kusum, S., Billingsley, B. S. (1996), “Intent to stay in teaching”, Remedial & Special Education, Vol. 17, No 1, 11-37. Lashbrook, W. (1997), “Business performance, employee satisfaction, and leadership practices”, Performance Improvement, Vol. 36, No 5, 29-33. Lee. H. Y., Ahmad, K. Z. (2009), “The moderating effects of organizational culture on the relationships between leadership behavior and organizational commitment and between organizational commitment and job satisfaction and performance”, Leadership & Organization Development Journal, Vol. 30, No 1, 53 – 86. Locke, E. A. (ed) (1976), The nature and causes of job satisfaction. Handbook of Industrial and Organizational Psychology, Chicago, IL, Rand McNally, 1297-1349. Lok, P., Crawford, J. (1999), “The relationship between commitment and organizational culture, subculture, leadership style and job satisfaction in organizational change and development”, Leadership & Organizational Development, Vol. 20, 365–376. Ma, X., MacMillan, R. (1999), “Influences of Workplace Conditions on Teachers’ Job Satisfaction”, Journal of Educational Research, Vol. 93, No 1, 39–47. Marston, S., Courtney, V., Brunetti, G. (2006), “The Voices of Experienced Elementry Teachers: Their Insights about the Profession”, Teacher Education Quarterly, Vol. 33, No 2, 111-131. Mehrotra, A. (2005), Leadership Styles of Principals, India, Mittal Publications. Noddings, N. (2006), “Educational Leaders as Caring Teachers”, School Leadership and Management, Vol. 26, No 4, 339–45. Northouse P. (2008), Liderstvo (IV izdanje), Beograd, Data Status. Pastuović N. (1997), Osnove psihologije obrazovanja i odgoja, Zagreb, Znamen. Perie, M., Baker, D. P. (1997), Job Satisfaction among America’s Teachers: Effects of workplace conditions, background characteristics, and teacher compensation, Washington, D.C., National Center for Education Statistics. Porter, J. E. (1993), An investigation of secondary teachers' motivation orientation and their attitudes about extrinsic incentives (Doctoral dissertation). The University of Nebraska-Lincoln, Dissertation Abstracts International, 54-12. Robbins S. P., Judge T. A. (2009), Organizacijsko ponašanje, Zagreb, Mate. Robbins, S. (2001), Organizational behavior (9th edition), New Jersey, Prentice-Hall. Rosenholtz, S. J. (1989), Teachers’ workplace: The social organization of schools, New York, Longman.
RELATIONSHIP BETWEEN THE SCHOOL PRINCIPAL LEADERSHIP STYLE AND TEACHERS’ JOB SATISFACTION IN SERBIA
57
Rowan, B., Correnti, R., Miller, R. J. (2002), “What Large-Scale, Survey Research Tells us About Teacher Effects on Student Achievement: Insights From the Prospects Study of Elementary Schools”, Teachers College Record, Vol. 104, No 8, 1525–67. Schultz, I.L., Teddlie, C. (1999), “The Relationship between Teachers’ Job Satisfaction and their Perceptions of Principals’ Use of Power and School Effectiveness”, Education, Vol. 19, No 4, 461–480. Schulz, I. L., Teddlie, C. (1989), “The relationship between teacher’s job satisfaction and their perceptions of principals’ use of power and school effectiveness”, Education, Vol. 109, No 4, 461-8. Sharma, R. D., Jyoti, J. (2006), “Job satisfaction among school teachers”, IIMB Management Review, Vol. 18, No 4, 349-363. Sharma, R. D., Jyoti, J. (2009), “Job satisfaction of university teachers: An empirical study. Journal of Services Research”,Vol. 9, No 2, 51-80. Skrapits, V.A. (1986), “School leadership, interpersonal communication, teacher satisfaction and student achievement”, Dissertation Abstracts International, Vol. 47, No 2, 2409, 1986. Smith, J. M. (2000), Analysis of the relationship between principal leadership style and teacher job satisfaction. (Unpublished doctoral dissertation). The University of North Carolina at Charlotte, North Carolina. Smith, P. C., Kendall, L. M., Hulin, C. L. (1969), The Measurement of Satisfaction in Work and Retirement. Chicago, IL, Rand-McNally. Spector, P. E. (1985), “Measurement of Human Service Staff Satisfaction: Development of the Job Satisfaction Survey”, American Journal of Community Psychology, Vol. 13,No 6, 693-713. Spector, P. E. (1997), Job satisfaction: Application, Assessment, Causes and Consequence, Thousand Oaks, CA:Sage Taylor, D. L., Tashakkori, A. (1995), “Decision participation and school climate as predictors of job satisfaction and teacher’s sense of efficacy”, Journal of Experimental Education, Vol. 63, No 3, 217-227. Tillman, W. R., Tillman, C. J. (2008), “And you thought it was the apple: A study of job satisfaction among teachers”, Academy of Educational Leadership Journal, Vo. 12, No 3, 1-18. Timothy, A. J., Ronald, F. P. (2004), “Transformational and transactional leadership: A metaanalytic test of their relative validity”, Journal of Applied Psychology, Vol. 89, No 5. Vroom, V. H. (1964), Work and motivation, New York, Wiley. Vujić, D. (2008), Menadžment ljudskih resursa i kvalitet (III izdanje), Beograd, Centar za primenjenu psihologiju. Weiss, D. J., Dawis, R. V., England, G. W., Lofquist, L. H. (1967), Manual for the Minnesota Satisfaction Questionnaire, Minneapolis, Universtiy of Minnesota, Industrial Relation Center. Yousef, D. A. (2002), “The interactive effects of role conflict and role ambiguity on job satisfaction and attitudes toward organizational change: a moderated multiple regression approach”, International Journal of Stress Management, Vol. 7, No 4, 289-303. Yukl, G. (1994), Leadership in Organizations (3rd ed.), Englewood Cliffs, NJ, Prentice-Hall. Zembylas, M., Papanastasiou, E. (2004), “Job satisfaction among school teachers in Cyprus”, Journal of Educational Administration, Vol. 42, No 3, 357–74.
CREDIT DEFAULT SWAP (CDS) SPREADS: THE ANALYSIS OF TIME SERIES FOR THE INTERACTION WITH JOURNAL THE INTEREST RATES ANDVol. THE10, GROWTH IN TURKISH MONTENEGRIN OF ECONOMICS, No. 1 (July 2014), ECONOMY 59-66
59
CREDIT DEFAULT SWAP (CDS) SPREADS: THE ANALYSIS OF TIME SERIES FOR THE INTERACTION WITH THE INTEREST RATES AND THE GROWTH IN TURKISH ECONOMY BILAL KARGI1
ABSTRACT This text is for the relation between credit default swap (CDS) spreads and some chosen macro economic data in Turkish economy. Credit default swap spread as an insurance spread is the most important sign for the solvency of the debitors in that country about the securities that public sector and companies export in an economy. Thus, the decisions of investors for the investment feasibility related to economy are based on the information that was supplied by these spreads. Therefore, the credit default swap spreads have become a kind of reliability index. Moreover, they have become an information source about the general view of economy except the investee securities. In this study, the relation between the interest rates of CDS spreads and GDP is determined over time. KEY WORDS: Credit Default Swap Spreads, GDP, Interest Rates, Turkish Economy.
JEL classification: G24, O52, O40 Received: February 12, 2014 / Accepted: June 15, 2014
1. INTRODUCTION When the economic theory contact with facts/real world, it reaches the macro theory by acting on the assumptions of the perfect competition market which becomes a theoretical market. The one of the most known features of the theoretical market model is that producers and consumers have “complete and full information” about the market. Another one is the supposed freedom of entry and exit to the market. If we look at the second one in detail from the both assumptions, we reach the induction of goods, employment, capital and other production factors and of economic values’ free movement on a global scale. In this way, it will be precipitated that producers and consumers can easily reach all markets on a global scale and can generate supply and demand. To make possible induction that is obtained by the second assumption, it’ll be possible that the first mentioned assumption can have “full” or minimum earnable high information about the markets. So, both assumptions coincide with each other. It is seen that producers and consumers, in other words, supply and demand can reach the economic values and economic information without any limitations on a global scale, and can walk around the world without limitation of their mobilities. Here, all economic facts in the pratical world are statistically followed to be informed economy. However, when all acquired information for the markets are explained, it is perceived by the market agents, and the agents immediately organize their positions on the basis of the new data. Therefore, it is suggested that the economy is the imponderable dynamic mechanism (Fama, 1965). Because of the dynamic process, a “certain” forecast is not possible but “view” and “opinion” can be suggested. However, the market agents aren’t always rational. Therefore, asset accounts are formed and behaviours include irrationality (Shiller,2005). So, it causes hesitation about view and opinion the extent to which consistent and reliable (Mora, 2005; Afonso andet al., 2011; ReisenandMaltzan, 1998; Flores, 2010). Even if, international investors continue to find the best information that might be possible about the economy prerequisite for an investment. In
1
Aksaray University, Department of Banking and Finance, Aksaray,
[email protected]
60
Bilal Kargi
traditional, credit ratings that have been given to countries are in use since 1900’s (Bessis, 2002:14). However, with especially Asian economic crisis (Gumrah, 2009.) and following 2000s, it hasn’t reflected information global crisis 2008. Therefore, the orientation has accelerated to CDS (Credit Default Swap) spreads. CDS that was introduced by J. P. Morgan to be traded at financial markets fort he first time in 1995, has spread like wildfire. Credit Default Swap is a policy that a reference agency export at risk of default for an asset transfers to the third party in reply to the periodical spread payment (Brandon and Fernandez, 2005). Credits that are opened to the companies in an economy or payment that will maket to the securities in that country, are directly proportional to the safety of investor that may take back this credit. The security locks with payable spread in certain periods with respest the risks in that economy to guarantee that the value of a security can repay (Andritzkyand Sing, 2006:3). These spreads are named as “Credit Default Swap Spread”. These Spread notes that named as CDS with the most common usage, are policies that insure investment tool in reply to a certain spread, and are also investment tool itself. The most distinct feature it is its separation from the insurance policy. On the other hand, it escapes the “insurance” and “trade-in” expression used. Thus, a certain reserve should be at a spread, even if the “trade-in” expression is chosen to pass the required reserve necessity for the insurance policy (Markowitz, 2009). There are three topics for CDS policy (Desrosiers, 2007:21-22): protected creditor, debtor and policy firm. Thus, it promises the company that sell the policy in reply to a payable spread by the protected creditor, and in the event that default of the debtor, and promises that pay the credit with its capital and interst to the protected creditor (Chen, et al.,2011:5). Also, these CDS policies are processed at secondary markets. Accordingly, CDS policy to be invested means that the policy of debtor will default and at least he can’t repay the credit. CDS spreads are defined with the open bidding procedure by International Swaps and Derivatives Association (ISDA) (Austin and Miller, 2011:2). The process of CDS in the secondary market is shortly “a cash flow transforms with other cash flow in the financial meaning. More generally, it is that the spread of security is exchanged with other security spread” (Delikanlı, 2010:90-91). It is often talked about the operand derivative “products in the secondary market, especially about Credit Default Swaps’ (CDS) generalize and deeper effect for the global crisis. Recently, CDS’ that grow fast and are the main investments that banks make and so that have mostly taken a major blow at the crisis period” (Akbay, 2011:7). Especially in financial point, there is a wide literature for the relation with financial variables such as securities exchanges indices of CDS spreads, bonds and bills markets, and exchange rates. In this study, it is examined that the interest rates of the Turkish economy and the interaction between GSYIH and CDS spreads. Thus, the proofs have been tried to acquire that CDS spreads might be indicated the extent to which information content and economy about Turkey with reference to data of Turkish economy that becomes a developing market. 2. THEORY AND LITERATURE It is mentioned that there are some studies that aren’t enough for CDS, especially in Turkish literature. Especially, there are CDS studies for banking, finance and security market, it is also a minute amount. Therefore, an economotic study cannot be detected about its relation with the growth. CDS spreads include information about an investeee asset risk and fall of the economy when the spreads rise (IMF, 2013:59; Peristani and Savino 2011). The studies for CDS try to determine whether or the safety indicator about markets, and concentrate its relation with the variables in financial markets. Empirical proofs are asked for the risk that may become effective to the investment decisions in markets. For example, Longstaff, et al., (2007) base on the data of 26 OECD countries, and CDS spreads have been examined subject to USA stock market, high–yield bond market, global risk appetite and capital flows, and credit ratings have been used as variables in this analysis”. Also, Ismailescu and Kazemi (2010) have come through that “the credit rating increases leave a positive impression CDS spreads of countries in the short term. On the other hand, they emphasize that a limited increase in CDS spreads occured after the rating allowance because of that credit rating allowances generally
CREDIT DEFAULT SWAP (CDS) SPREADS: THE ANALYSIS OF TIME SERIES FOR THE INTERACTION WITH THE INTEREST RATES AND THE GROWTH IN TURKISH ECONOMY
61
have been reflected to CDS spreads of countries before now.” (From, GurandOzturk, 2011:74).Elizalde (2005) shows that the relative magnitude of the future progresses haven’t affected CDS spreads after the high performance of firms in the study that did through journal CDS spreads via six securities in Spain. Sener, Ulutas and Cevik (2010a) who accented the necessity of “the relation that doesn’t cause the arbitrage between Eurobond and CDS” in a well-functioning liquidity market, have precipitated that “ the information of credit, bond and equity markets weren’t reflected in prices at once , and the information flow principally started at equity markets”. Moreover, “there are findings of the information flow toward which pass to the CDS through index, that the credit market was affected by the equity market” and “an investor, who will put under protection to Turkey through CDS, should closely follow the equity market, and any information flow shouldn’t become to index through CDS.” In a similar way, Akdogan and Chadwick (2012) who emphasize that CDS and EMBI + country values shouldn’t cause the arbitrage; mention that the different periodical movements between two data were observed. By the data of the Turkish economy in their studies, have precipitated “the mentioned difference in a short term is quickly improved as proportional with the purchase and sale frequency “, and in a long term, didn’t cause the arbitrage by acting in concert. Moreover, they have precipitated that CDS spreads mostly affected the liquidty effect instead of the bankrupt risk. In the study have been prepared by Keten, et al. (2013) “the relation has been detected between CDS and the interest rates for 30 years in a short term”. Also, according to the results of Granger causality test, “it has been precipitated that there is “an unidirectional causality to five-year CDS spreads of Turkey.” and has been indicated that this relation is also effective for the short and long term. Ersan and Gunay (2009) have used the political developments as a dummy variable, and have precipitated that these political developments aren’t statistically the meaningful effect for CDS spreads in their studies. Nevertheless, the authors who mention that the political and social developments’ positive and negative effects are inevitable on the markets, have remarked that the information for the dummy variable have been previously priced by the market. Therefore, in the beginning they connect that “there is no effect” have been precipitated instead of “the negative effect on CDS”, with this “early pricing” in their studies. Other acquired finding is that the maximum efficaciouses on CDS in Turkey are the Dow Jones index and the indicative eurobond interest forward 2030, and IMKB 100 index and the domestic indicative interest rates aren’t effective on CDS on the basis of Granger causalities. Skinner and Townend (2002) remarked that the developing capacity of the derivative markets, and state that the operand amount of CDS product and the credit risk are open to manipulation. Chen, et al., (2005) have prepiritated that even if there is a difference between the credit rating agencies, in any case, they are in relation between the interest rates in their studies which include the relation between CDS spreads for the interest rates and the branchs of the different industry. Also, they have prepiritated that even if the credit risk dynamics show the sectoral differences, they have interaction with the interest rates. Tang and Yan (2010) have prepiriated that there is an effect with CDS data rated 6% in their studies which include the growth rate and the investor sentiment variables. While the growth fluctuations are efficient on the liquidity flows, and the high cash flow in the growth terms of the economy, this relation become reversed in the period of recession. Liu and Morley (2012) have found that the effects of the exchange rates on CDS show the differences from country to country, and a dominant CDS- Rate relation isn’t observed but even if the Exchange rates are a quite efficient on CDS. Accorrding to the acquired finding, it isn’t talked about the relation of a general rate-CDS, and have mentioned that the rate is an active determinant. Therefore, the differences of the effects that direct the the exchange rate for every economy, also make a difference on CDS. Dieckmann and Plank (2012) state that CDS spreads rise in European economies after the financial crisis, and a contingent fluctuation in financial system is also reflected to the financial world system, and it rises the CDS spreads. This situation shows that there should be a system that transfers the risks to the financial system initiative saving for the public sector in the fluctutations.
62
Bilal Kargi
Fabozzi, Cheng and Chen (2007) theoretically submit that the risk rate, the effect of the industy sector, credit rating and liquidity factors are efficient for determining CDS spreads. They state that when the liquidity is high even if CDS spreads are low, when CDS spreads are low, there is no prof for the rise of the liquidity. In their model, they have used the interest rate, the credit rating of the country and the variables of the liquidity factors, and have precipitated that all variables are efficient on CDS. In these variables, especially they remark that CDS spreads are high when the liquidity is high, and in liquidity congestion for CDS spreads, the incremental costs come to the spreads. Baum and Wan (2010) confirm the result of CDS spreads’ rise under the economic uncertainty. They support the literature that eg. The interest rate risks and macroeconomic uncertainty are highly efficient on CDS. Especially the importance of CDS comes out after the financial crisis 2007-2008, and the collapse of Lehman Brothers is an example to it, Chiaramonte and Casu (2012). The credit default swap spread provides the low-priced and the effective promotion to the negative risks. Besides that, CDS spreads are an indication as to the level for the clarification of the developing derivatives markets, Yu and Zhong (2010). This type of a study hasn’t been detected for the growth data relating to Turkish economy. Therefore, this study is a primer but there are some studies and findings for Turkey and the financial markets. It is talked about the generalising and deepening effect of Credit Default Swaps (CDS) for the global crisis. Recently, CDS’ that quickly develop and is the main that the banks mostly invest the instruments, are the instrument that take the first major blow” (Akbay, 2011:7). When the financial tension rises, both countries that have the debt crisis affect negatively each other and andnegatively affect developing countries with regards to the credit risk (CamgozandSevgi, 2012). It is stated that the political developments in Turkey aren’t efficient on CDS, and Eurobond and Dow Jones index are efficient on CDS by Ersan and Gunay (2009). 3. DATA AND METHOD The quarter datas are used belonging to 2005:01 – 2013: 03 period to understand the relation between CDS spread-GDP and the interest rate in the analysis. These datas have been acquired by the data base of CBRT-EDDS(Central Bank of Republic of Turkey-Electronic Data Delivery System) and Bloomberg. GDP quarter datas are in terms of seasonally adjusted US dollar. The quarter datas have been acquired by calculating the arithmetic mean for three months of CDS spreads (CDS) journal close data. The market interest rate (IRT) is the interest rate for the indicative papers of the Government Debt Securities. Political interest (LON) is Late Liquidity Window Facility Lendin Interest Rate of Central Bank. Five different tests have been used in the study that the relation is tested between GDP, CDS and Interest Rates. (ADF Test) by Dickey and Fuller (1979), and (PP Test) by Phillips and Perron(1988) unit root test have been used for the stability test of series. (EG Test) by Engle and Granger (1987) have been used for researching the relation between two variables in a long term, and (JJ Test) by Johansen-Juselius(1990) have been used to Cointegration Tests for the long term test about more than two variables. Finally, (GC Test) by Granger (1969) Causality Test has been referred to be identified the asset and the side of the short term causality relation. 4. EMPRICAL RESULTS The analysis is based upon four basic time series tests. It should be determined that the series whether or not include the unit root up to the next three tests. The series include the unit root, it means that it is not constant. Therefore, a fluctuating series should be changed to the constant by realising the difference process. ADF unit root test by Dcikey and Fuller and PP unit root test by Philips and Perron have been referred to understand the stability of the series. The acquired results have been shown in Table-1.
CREDIT DEFAULT SWAP (CDS) SPREADS: THE ANALYSIS OF TIME SERIES FOR THE INTERACTION WITH THE INTEREST RATES AND THE GROWTH IN TURKISH ECONOMY
63
Table 1: ADF and PP Unit Root Tests
GDP CDS IRT LON
ADF -2,445130 (-2,951125) -2,884649 (-2,951125) -1,548235 (-2,951125) -0,918374 (-2,615817)
ADF ∆ -6,814116 (-2,960411) -7,157402 (-2,954021) -8,170365 (-2,954021) -4,544846 (-2,954021)
PP -2,383555 (-2,951125) -2,015465 (-2,951125) -1,372531 (-2,951125) -0,944146 (-2,951125)
PP ∆ -12,14580 (-2,954021) -7,157402 (-2,954021) -8,170365 (-2,954021) -4,544846 (-2,954021)
ADF test statistics (ADF Column) has been given in Table-1. The values in brackets are the critical values for 5% the meaning level. When ADF< Critical Value, the series are concluded to the unit root context. Therefore, the acquired ADF test statistics (ADF∆) and the critical values have been given in brackets by taking the difference 1 of the series. As it is seen, all series can change to the constant when their differences were taken. The same procedure is also effective for PP test, and it is seen that PP test results are constant when all series differences 1 were taken. A long term Co-Integration Test by Engle and Granger can be in progress because the series are equally constant. The acquired results are given in Table-2 for this test. Table 2: Engle-Granger Co-Integration Test (a) Regressions coefficient Std. Deviation dGDP=f(dCDS) -29505,11 46611,03 dGDP=f(dINT) -1534508 1546720 dGDP=f(dLON) 3062193 2429262 dCDS=f(dGDP) -4,19 6,62 dCDS=f(dINT) 4,677923 5,860617 dCDS=f(dLON) 12,27317 9,126277 Results of unit root test for error correction ADF -6,519885 dGDP=f(dCDS) →u (-2,960411) -6,089225 (-2,960411) dGDP=f(dINT) →u -6,512291 (-2,960411) dGDP=f(dLON) →u -7,291860 dCDS=f(dGDP) →u (-2,954021) -7,551826 dCDS=f(dINT) →u (-2,954021) -7,472475 dCDS=f(dLON) →u (-2,954021
t-Stat. -0,633007 -0,992104 1,260545 -0,633007 0,798196 1,344817 PP Integre -12,27899 (-2,954021) I(0) -9,924438 (-2,954021) I(0) -12,20899 (-2,954021) I(0) -7,291860 (2,954021) I(0) -7,653610 (-2,954021) I(0) -7,521611 (-2,954021) I(0)
Engle-Granger Co-integration test that shows the long term relation between two variables, has just been calculated with the first differences which the variables become the constant. Principally, the coefficient, the standard errror and t-statistic values belonging to the creating VAR models, have been given in the panel (a) of Table-2. For the rule of this test assumption, the creating VAR models should be the constant by the level values of the error term. ADF and PP
64
Bilal Kargi
test results that are calculated for the error terms of each VAR models, are involved in the panel (b) of Table-2. As it seen, the error terms for each VAR models are the constant by their level values. In the present case, there is a long term relation from GDP to other variables and from CDS to other variables. The current third test for analysis has been used as Johansen-Juselius co-integration test that was used for researching the co-integration relation between more than one variable, and the acquired results have been given in Table-3. Table 3: Johansen-Juselius Co-Integration Test H0 r=0 r=1 r=2
H1 r≥1 r≥2 r≥3
Eigenvalue 0,622509 0,524689 0,306790
Trace Stat. 66,77386 35,59917 11,79804
0,05 Max-Eigen Stat. 47,85613 31,17469 29,79707 23,80113 15,49471 11,72552
0,05 27,58434 21,13162 14,26460
For JJ test results, “Trace Stat > 0,05 the significance level” is supposed to be, and “MaxEigen Stat. > 0,05 the significance level” is supposed to be. H0 hypothesis get rejected as long as these expectations occured, and H1 hypothesis is accepted and it is concluded that it’s the cointegrated vector. Accordingly, it is said that there are the most two cointegrated vectors as result of JJ test. There is a long term relation between the variables, so Granger Causality test has been used for researching the causality in a short term. The acquired results have been given in Table4. Table 4: Granger Causality Test
IRT → GDP GDP → CDS IRT → CDS GDP → IRT CDS → IRT CDS → LON
Chi-sq 8.677714 23,67913 10,83011 7,580410 8,015159 6,769692
df 2 2 2 2 2 2
Prob. 0,0131 0,0000 0,0044 0,0226 0,0182 0,0339
Result Granger Causality Exist Granger Causality Exist Granger Causality Exist Granger Causality Exist Granger Causality Exist Granger Causality Exist
According to the results in Table-4, there are the causality relations from IRT variable to GDP and CDS variables; from GDP variable to CDS and IRT variables; from IRT variable to CDS variable; from CDS variable to IRT and LON variables. In the same time, there is a bi-directional causality between IRT and GDP; IRT and CDS variables. Yet, there isn’t a causality relation from CDS variable to GDP variable. Other unidirectional relation is from CDS variable to LON variable. 5. CONCLUSIONS The aim of this study is to analyze the relation between GSYIH of the Turkish economy, the interest rate and CDS (Credit Default Swap) spreads that have been carefully started to follow in the recent period to internationally predict the credibility of the countries and macroeconomic outlook. The lot of commited empirical research show that the most efficient variable is the interest rates for CDS spreads. So, this result has ensued in this research. It has been precipitated that there is a long term relation between GDP, CDS, IRT and LON variables in the Turkish economy. In the same time, it has been detected that there is a bidirectional causality relation between CDS
CREDIT DEFAULT SWAP (CDS) SPREADS: THE ANALYSIS OF TIME SERIES FOR THE INTERACTION WITH THE INTEREST RATES AND THE GROWTH IN TURKISH ECONOMY
65
and the market interest rate (IRT). Also, it has been detected the same bidirectional relation for the market interest rates (IRT) and GDP. The original result of the research is that even if CDS datas have relation with GDP in a long term, it didn’t have that relation in a short term. On the other hand, the political interest of Central Bank doesn’t constitute the reason for CDS. According to these results, CDS spreads are mostly affected by the market interest rates for Turkish economy, and each variable are the mutual reason for each other. In theory, when it is thought that this relation is in the same way; when the market interests rise, CDS spreads also rise. The raise in CDS spreads (with the rise in the interest rates) are seen as a variable that cause the fall of the GDP. So, CDS spreads are the followed indication as an indicator for the growth datas of the Turkish economy. REFERENCES Akbay, O. S. (2011), “KüreselFinansalKrizinKökenleriÜzerineBirDeğerlendirme”, Namık Kemal Üniversitesi,SosyalBilimlerMetinleri, No. 6, 1-16. Akdoğan, K. and Chadwick, M. G. (2012),“CDS-Bono FarkıveDüzeltmeHareketi”, TCMB, EkonomiNotları, No.12/1, 1-9. Afonso, A., Furceri, D. and Gomes, P. (2011), “Sovereign Credit Ratings and Financial Markets Linkages Application to European Data”,Working Paper Series, European Central Bank, No. 1347. Andritzky, J. and Singh, M. (2006), “The Pricing of Credit Default Swaps During Distress”, Working Paper, IMF, No. 254. Austin, D. A. and Miller R. S. (2011), “Treasury Securities and The U.S. Sovereign Credit Default Swap Market”, Congressional Research Service, CRS Report for Congress, No. 7-5700. Baum, C. F. and Wan, C. (2010), “Macroeconomic Uncertainty and Credit Default Swap Spreads”,Applied Financial Economics, No. 20, 1163-1171. Bessis, J. (2002), Risk Management in Banking, Second Edition, John Wiley&Sons Ltd., West Sussex. Brandon, K. I. and Fernandez, F. A. (2005), “Financial Innovation and Risk Management: An Introduction to Credit Derivatives”, Journal of Applied Finance, Vol. 15, No. 1, 52-63. Cao, C., Yu, F.,Zhong, Z. (2010), “The Information Content of Option-Implied Volatility for Credit Default Swap Valuation”, Journal of Financial Markets, No. 13, 321-343. Chen, R., Cheng, W. and Wu, L. (2005), “Dynamic Interactions BetweenInterest Rate, Credit, and Liquidity Risks: Theory and Evidence from The Term Structure of Credit Default Swap Spreads”, Social Science Research Network (http://dx.doi.org/10.2139/ssrn.779445). Chen, K., Fleming, M., Jackson, J., Li, A. and Sakar, A. (2011), “An Analysis of CDS Transactions: Implications for Public Reporting”,Staff Reports, Federal Reserve Bank of New York, No. 517. Chiaramonte, L. and Casu, B. (2012), “The Determinants of Bank CDS Spreads: Evidence from the Financial Crisis”,The European Journal of Finance, Vol. 19, No. 9, 861-887. Delikanlı, İ. U. (2010), “Bankacılıkta Kredi Türevlerinin Hissedar Değerine Katkısı, Etkin Bir Şekilde Kullanıma İmkan Sağlayacak Risk Yönetimi Yapılanmasıve Finansal Raporlaması”, Türkiye Bankalar Birliği, No. 271. Desrosiers, M. E. (2007), “Prices of Credit Default Swap and The Term Structure of Credit Risk”, A Professional Master’s Project, Worcester Polytechnic Institute, USA. Dickey, D. A. and Fuller, W. A. (1979), “Distribution of the Estimators of Autoregressive Time Series With a Unit Root”, Journal of the American Statistical Association, Vol. 74, 427-431. Dieckmann, S. and Plank, T. (2012), “Default Risk of Advanced Economies: An Empirical Analysis of Credit Default Swaps During the Financial Crisis”, Review of Finance, No. 16, 903-934. Eichengreen, B., Mody, A. Nedeljkovic, M. and Sarno, L. (2012), “How the Subprime Crisis Went Global: Evidence from Bank Credit Default Swap Spreads”,Journal of International Money and Finance, No. 31, 1299-1318. Elizalde, A. (2005), “Credit Default Swap Valuation: An Application to Spanish Firms”, Centro de EstudiosMonetarios y Financieros (CEMFI), Master’s Theses Series, No. 0303. (http://www.abelelizalde. com). Engle, R. F. and Granger, C. W. J. (1987), “Co-integration and ErrosCorrection: Representation, Estimation, and Testing”, Econometrica, Vol. 55, No. 2, 251-276. Ersan, İ. and Günay, S. (2009), “Kredi Risk Göstergesi Olarak Kredi Temerrüt Swapları (CDSs) ve Kapatma Davasının Türkiye Riski Üzerine Etkilerine Dair Bir Uygulama”, Bankacılar Dergisi, No. 71, 3-22.
66
Bilal Kargi
Fabozzi, F. J., Cheng, X. and Chen, R-R. (2007), “Exploring the Companents of Credit Risk in Credit Default Swaps”,Finance Rend arch Letters, No. 4, 10-18. Fama, E. F. (1965), “The Behavior of Stock-Market Price”, The Journal of Business, Vol. 38, No. 1, 34-105. Flores, E. (2010), “Do Sovereign Credit Rating Changes Have Spillover Effects on Other Countries?”, Stanford University, Economics Department Theses. Granger, C. W. J. (1969), “Investigating Causal Relations by Econometric Models and CrossSpectral Methods”, Econometrica, Vol. 37, No. 3, 424-438. Gür, T. H.,Öztürk, H. (2011), “ÜlkeRiski, Derecelendirme Kuruluşları, Aksaklıklarve Yeni Düzenlemeler, Sosyoekonomi, No. 2, 69-92. Hacıhasanoğlu, R. and Soytaş, U. (2009), “S & P500 Volatilitesive Türkiye’nin Krediİflas Takası Primi”, Celal Bayar Üniversitesi, Sosyal Bilimler Dergisi, Vol. 7, No. 2, 1-10. IMF (2013), Global Financial Stability Report, (www.imf.org 06.01.2014). Ismailescu, I. and Kazemi, H. (2010), “The Reaction of Emerging Market Credit Default Swap Spreads to Sovereign Credit Rating Changes”, Journal of Banking and Finance, Vol. 34, No. 12, 2861-2873. Johansen, S. and Juselius, K. (1990), “Maximum Likelihood and Inference on Cointegration – With Applications to the Demand for Money”, Oxford Bulletin of Economics and Statistics, Vol. 52, No. 2, 169210. Keten, M., Başarır, Ç. and Kılıç, Y. (2013), “Kredi Temerrüt Takası ile Makroekonomik ve Finansal Değişkenler Arasındaki İlişkinin İncelenmesi”, 17. Finans Sempozyumu Bildiriler Kitabı, Muğla, 377-386. Liu, Y., Morley, B. (2011),“SoveringCredit Default Swaps and The Makroeconomy”, Applied Economics Letters, No. 19, 129-132. Longstaff, A. F., Pan, J., Pedersen, L. H. and Singleton, K. J. (2007), “How Sovereign is Sovereign Credit Risk?”, Working Paper, NBER, No. 13658. Markowitz, H. M. (2009), “Proposals Concerning The Current Financial Crisis”, Financial Analysts Journal, Vol. 65, No. 1, 25-27. Mora, N. (2005), “Sovereign Credit Ratings: Guilty Beyond Reasonable Doubt?”, Lecture and Working Paper Series, American University of Beirut Institute of Financial Economics, No. 1. Peristiani, S. and Savino, V. (2011), “Are Credit DdefaultSwaps Associated With Higher Corporate Defaults?”, Staff Reports, Federal Reserve Bank of New York, No. 494. Phillips, P. C. B. and Perron, P. (1988), “Testing for an Unit Root in Time Series Regression”, Biometrika, Vol. 75, 335-346. Reisen, H. and Maltzan, J. (1998), “Sovereign Credit Ratings, Emerging Market Risk and Financial Market Volatility”, Intereconomics, Vol. 33, No. 3, 73-82. Shiller, R. J. (2005), “Behavioral Economics and Institutional Innovation”, Discussion Paper,Cowles Foundation, No. 1499. Skinner, F. S. and Townend, T. G. (2002), “An Empirical Analysis of Credit Default Swaps”,International Review of Financial Analysis, No. 11, 297-307. Şener, E., Ülütaş, S. and Çevik, P. (2010a), “Volatilite Yayılması-I: Vadeli Endeks Kontratları, Eurobond ve Kredi Temerrüt Takası”, Vobjektif, No. 14, 55-57. Şener, E., Ülütaş, S. and Çevik, P. (2010b), “Volatilite Yayılması-II: Endeks, Eurobond ve Kredi Temerrüt Takası”, Vobjektif, Vol. 16, 53-56. Tang, D. Y. and Yan, H. (2010),“Market Conditions, Default Risk and Credit Spreads”, Journal of Banking & Finance, No. 34, 743-753.
TESTING THE EXISTENCE AND STABILITY OF ROMANIA MONTENEGRIN JOURNAL OF ECONOMICS, Vol.PHILLIPS 10, No. 1CURVE (July IN 2014), 67-74
67
TESTING THE EXISTENCE AND STABILITY OF PHILLIPS CURVE IN ROMANIA MIHAELA SIMIONESCU1 ABSTRACT The main objective of this study is to check the existence and the stability of Phillips curve for Romania, on the horizon from 1990 to 2013. According to Phillips Perron tests, all the variables are integrated of order 1. ARDL and DOLS approaches to co-integration were used to analyse the Philips relations and ECM to study short run dynamics. There is a negative relation between inflation and unemployment rate in the short run and a positive relationship in the long run in Romania. The tests like recursive residual, CUSUM and CUSUMsq tests confirm that there is a stable Philips relation. KEY WORDS: Phillips curve, dynamic model, Co-integration, ARDL, DOLS JEL classification: E 31; E 24; J64 Received: February 12, 2014 / Accepted: June 2, 2014
1. INTRODUCTION The nominal wage inflation was graphed against unemployment rate in England, and a stable negative and tight relationship was observed in the last century, this graph representing Phillips curve. Moreover, this relation was checked for the developed economies and in most cases the Phillips curve was not valid. Authors like Solow (1970), Onder (2004) and Faridul et al. (2011) studied the theoretical background of the Phillips curve. The eventual trade-off helps policymakers to solve the macroeconomic disequilibrium. The Phillips curve did not succeed to predict the economic crisis in 1970s. There are more groups of researchers regarding their opinion about Phillips curve validity: the group against the use of this curve (Phelps (1967), Friedman (1968), Okun (1975), Lucas (1976)) and the group that demonstrated a non-linear relationship (Onder (2004), Kustepeli (2005), Furuoka (2007), Tang and Lean (2007), Schreiber and Wolters (2007), Dammak and Boujelbene (2009)). On the other hand, there are authors that proved an unstable relationship between the two variables (Okun (1975), Lucas (1976), Turner (1997); Atkeson and Ohanian (2001); Niskanen (2002); Demers (2003) and Reichel (2004)). Karanassou et al. (2005) proposed models under the assumption of low inflation, existing long-run trade-off between inflation and GDP. Franz (2005) showed a long-run inflationunemployment trade-off for Germany. Most of the studies regarding the relationship between the two variables refer to developed countries. The aim of this research is to study the existence of Philips curve and its stability in Romania. The rest of study is organized as it follows: after the literature review, the methodology is described and then the empirical results. Conclusions are drawn in last part of the study. 2. LITERATURE REVIEW The failure of Phillips relation in 1970s made Friedman (1968) to argue that the relation is valid only on short term. On long run the employees and the employers consider the inflation evolution in employment contracts that the salary increases at rates closed to anticipated inflation. Institute for Economic Forecasting of the Romanian Academy, PhD Senior Researcher, Bucharest, Romania,
[email protected] 1
68
Mihaela Simionescu
Lipsey (1960) proved the existence of an inverse relation for England during the war from 1914-1918 and Hansen and Pancs (2001) for Latvia. The instability of the Phillips curve since the 1970s might be cause, according to Turner (1997) and Atkeson and Ohanian (2001), by the structural break. Malinov and Sommers (1997) and Turner and Seghezzea (1999) used the Seemingly Unrelated Regression to show the existence of Phillips relation. Using a panel data approach, DiNardo and Moore (1999) put in evidence the Philips relation in OECD countries. Eliasson (2001) proposed a linear Phillips curve for USA, Sweden and Australia, checking the parameters stability. Niskannen (2002) stated that the original Philips curve comports misspecification, the positive slope of the long term relationship being due to lack of indexed tax code. Reichel (2004) proved the existence of trade-off for USA and Japan when co-integration approach was used. Rudd and Whelan (2005) and Gali et al. (2005) did not find enough evidence for Phillips relation, even if they applied the GMM approach. For some European countries, Karanassou et al. (2003) showed that there is a long run trade-off. Islam et al. (2003) did not find a strong evidence for USA Philips curve during 1950-1999. Evidence for Phillips curve was brought by Bhanthumnavin (2002) for Thailand, Graham and Snower (2002) for Chile, Furuoka (2007) and Tang and Lean (2007) for Malaysia and Schreiber and Wolters (2007) for Germany (based on VAR co-integration approach), Del Boca et al. (2008) for Italy, Cruz-Rodriguez (2008) for Dominican Republic, Faridul et al. (2011) for North Cyprus (based on ARDL bounds testing and Dynamic Ordinary Least Squares). Russell and Banerjee (2008) analysed the vertical Phillips curve for non-stationarity data series, finding positive relationship between inflation and unemployment on short term for the USA. Paul (2009) gave reasons for the lack of Phillips relation in India: oil price shocks and liberalization-policy. Only after the shocks adjustment the Phillips curve is evident, being also a shortterm trade-off between inflation and industrial output. 3. METHODOLOGY AND EMPIRICAL RESULTS The methodology is based on autoregressive distributed lag models (ARDL) discussed by Pesaran and Shin (1999), that does not imply the variables pre-testing, eliminating the uncertainty. The ARDL approach is used to test the existence of a relation between variables in level. It is applicable if repressors are 1(0) or I(1). According to Pesaran et al. (2001), it is used the Wald or Fstatistic in a generalised Dickey-Fuller regression for testing the significance of the variables with lagged levels in a conditional unrestricted equilibrium correction model (ECM). The estimates based on ARDL model of co-integration analysis are efficient and unbiased. The advantages of these models are: the possibility of using a small sample, the use of long-run and short-run components of the model at the same time, eliminating the problems generated by omitted variables and autocorrelation, the distinction between dependent and independent variables. Some authors extended the estimation of Phillips curve using also real GDP and marginal cost of production. The gross national product is seldom used for unemployment rate. In order to compute the inflation for developing economies, the consumer price index (CPI) might be used, according to Faridul et al. (2011). In this research we used like variables inflation rate, unemployment rate, real gross domestic products and money supply through M2. The data sources are represented by the National Institute of Statistics from Romanian, The National Bank of Romania and Eurostat. The study used data from 1990 to 2013 and before applying co-integration approach, the data are subject to stationary tests (Philip Perron test). The Philips-Perron test has the following statistic:
t t ( 0 ) 1 f0
/ 2
T ( f 0 0 ) ( s e ( ˆ ) ) 2 f 01 / 2 s
(1)
69
TESTING THE EXISTENCE AND STABILITY OF PHILLIPS CURVE IN ROMANIA
ˆ - the estimate t - t-ratio of ; se(ˆ ) - standard error of the coefficient; T - sample size and s - standard error of test regression. 0 - consistent estimate of the error variance in standard Dickey-Fuller equation f0 - estimator of residual spectrum at null frequency The co-integration approach is used for long-term relationship. For co-integrated variables, the long-run relations are estimated using co-integrating vectors. ARDL is valid irrespective the order of integration is. But ARDL does not work if a variable is I(2). The "dynamic OLS" (DOLS) approach is used, where the estimators are asymptotically equivalent to the Johansen estimators. For finite sample, the estimators are better, compared to the rest of asymptotically efficient estimators. The DOLS method supposes partial knowledge of the data series for co-integration ant it eliminates the problems generated by simultaneity, endogeneity and auto-correlation by using leads and lags in low sample. This procedure works also if the data series has different lags orders as Stock and Watson (1993) showed. If parameters inferences of the co-integrating vectors based on DOLS are made, the estimators are efficient. The ARDL is used with the unrestricted error correction model. According to Faridul et al. (2011) the model has the following form:
IN Ft
0
p
t IN Ft 1
q
tU N Pt 1
t
(2) INF- inflation rate UNP- unemployment rate We expect a significant and negative UNP coefficient in the case of Philips curve presence. The short and the long run models are written: i1
t 0
i n f a 0 b1 i n f t 1 c 1 u n t 1 d 2 y t 1 d 3 m 2 p
e inf i 1
i
p
p
p
i 1
i 1
i 1
t 1 f i unt 1 g i yt 1 hi m 2t 1 t ...
(3)
p- number of lags k - lag length of leads terms e - error term The Akaike criterion (AIC) is used to select the leads and lags. The structural breaks are checked using Chow test. In ARDL approach, the CUSUM and CUSUMsq tests are applied. If there is structural break in the data, the traditional approaches may not identify co-integrating relationship. This can influence the result of unit root tests and the predictive powers as Leybourne and Newbold (2003) proved. The ARDL model is applied using the unrestricted error correction method (UECM) form presented by Pesaran et al. (2001): p
p
p
p
i 1
i 1
i 1
i 1
inf a0 ei inf t 1 f i unt 1 g i yt 1 hi m2t 1 jECM t 1 t ...
(4)
The ARDL supposes the calculation of (p+1)k regressions. A sensitivity analysis was applied to test for auto-correlation, functional form, normality, White heteroscedisticity, model specification and ARCH. CUSUM and CUSUMsq verify the long and short term parameters stability. The nature of the time series is analysed.
70
Mihaela Simionescu
Figure 1: The evolution of the four variables during 1990-2013 INFLATION
UNEMPLOYMENT
300
9.0 8.5
250
8.0
200
7.5 150
7.0 100
6.5 6.0
50
5.5 0 90
92
94
96
98
00
02
04
06
08
10
12
5.0 90
92
94
96
98
00
02
REAL_GDP
04
06
08
10
12
M2
700,000
260,000,000
600,000
240,000,000 220,000,000
500,000
200,000,000
400,000 180,000,000
300,000 160,000,000
200,000
140,000,000
100,000
120,000,000
0
100,000,000
90
92
94
96
98
00
02
04
06
08
10
12
90
92
94
96
98
00
02
04
06
08
10
12
According to the graphs, all the data are not stationary. For inflation and unemployment rate there are larger fluctuations. Table 1: Phillips Perron test Variable Inflation
Unemployment
Log(GDP)
M2
PP statistic -2.183810 -4.108216 -1.681813 -2.317815 -2.870132 -0.351234 -1.474822 -2.582218 1.590257 -3.893982 -0.071279 3.830018
Source: author’s computations.
Critical values (level of significance: 5%) -2.998064 -3.622033 -1.956406 -2.998064 -3.622033 -1.956406 -2.998064 -3.622033 -1.956406 -2.998064 -3.622033 -1.956406
Order I(1)
I(1)
I(1)
I(1)
TESTING THE EXISTENCE AND STABILITY OF PHILLIPS CURVE IN ROMANIA
71
Using the Philip Perron test, all the variables are stationary at first difference. This shows that the variables are integrated of order 1: I(1) and the ARDL model could be estimated. Table 2: Co integration Test: Bound Test Model For Estimation
F-Statistics
Lag
Outcome
FINF(INF)
4.4587**
2
Co integration
Critical Bounds 1% 5% 10%
Lower 3.86 2.77 2.35
Upper 5.33 3.95 3.3542
As we expected, the relation between the two variables is negative on short run—a low unemployment rate conducts to an increase in the inflation. A percent of increase in unemployment reduces inflation with 1.87 percent compared to the value in the previous period. On long term, the relation is positive. If the unemployment rate increases with one percentage, the inflation rate increases by 0.33 percent. The negative and significant parameter of the first lag of inflation (-0.2745) confirms a true long run relationship of the bound test result. INF(t) = 0.3304*UN(t-1) -- 1.8722*UN(t-1) -- 0.2745*ECM(t-1) 0.0768 0.4811 0.0068
Probability
R2 = 0.3396 The ECM coefficient includes information about whether the previous values of the variables influence the current values. The absolute value of the ECM coefficient shows that about 27.45% of the disequilibrium in the Philips model. So, the disequilibrium over time should be decreased in order to keep the equilibrium between the two variables in Romania. Figure 2: Tests for parameters’ stability 200
100
0
-100
-200 1994
1996
1998
2000
2002
2004
Recursive Residuals
2006
2008
± 2 S.E.
2010
2012
72
Mihaela Simionescu 15
10
5
0
-5
-10
-15 1994
1996
1998
2000
2002
2004
CUSUM
2006
2008
2010
2012
2010
2012
5% Significance
1.6
1.2
0.8
0.4
0.0
-0.4 1994
1996
1998
2000
2002
2004
CUSUM of Squares
2006
2008
5% Significance
For checking coefficients’ stability, Bahmani-Oskooee and Shin (2002) applied the cumulative sum of recursive residuals (CUSUM) to the residuals of the model. According to the figure, neither the recursive residuals nor CUSUM of squares plots move outside the 5% critical lines. The result shows relative stable coefficients stability. However, the CUSUM test results indicate an evolution outside the critical line between 2001 and 2013, implying variance instability. 5. CONCLUSION This study main objective was the estimation of Philips Curve for Romania using ARDL and DOLS frameworks. There is evidence of co-integration between inflation, unemployment, real GDP and money supply M2 for Romania, showing a long run relationship over the period from 1990 to 2013. There is a theoretical trade-off between the two variables in the short run but prove otherwise statistically in the long run. Phillips curve is not valid for Romania on the long run. Moreover, the recursive residual, the CUSUM and CUSUMsq tests indicate the relative stability of the parameters.
TESTING THE EXISTENCE AND STABILITY OF PHILLIPS CURVE IN ROMANIA
73
REFERENCE Atkeson, A. and L.E. Ohanian (2001), “Are Phillips Curves Useful for Forecasting Inflation?”, FRB Minneapolis Quarterly Review, 2-11. Bahmani-Oskooee, M. and A. Nasir (2004), “ARDL Approach to Test the Productivity Bias hypothesis”, Review of Development Economics Journal, 8, 483-488. Bhanthumnavin, K. (2002), “The Phillips Curve in Thailand. St. Antony’s College”, University of Oxford, www.ecomod.net/conferences/ecomod2002. Brouwer, G. D. and N. R. Ericsson (1998), “Modeling Inflation in Australia”, Journal of Business and Economic Statistics, 16, 433-449. Dammak. T. B and Y. Boujelbene (2009), “The Nature of the Phillips Curve in Tunisia: New Empirical Evidence”, International Journal of Monetary Economics and Finance, 2, 126-143. Del Boca, A, M. Fratianni, F. Spinelli and C. Trecroci (2008), “The Phillips Curve and the Italian Lira 1861-1998”, Working Paper, Department of Economics, University of Brescia. Demers, F. (2003), “The Canadian Phillips Curve and Regime Shifting”, Bank of Canada Working Paper 2003-32, Bank of Canada, Ottawa, Canada. Eliasson, A (2001), “Is the Short-run Phillips Curve Nonlinear? Empirical Evidence for Australia, Sweden and the United States”, Sveriges Riksbank Working Paper-124, Stockholm School of Economics, Department of Economic Statistics Faridul, I.S., Muhammad, S. and Muhammad, N. (2011), “Philips Curve in a Small Open Economy: A Time Series Exploration of North Cyprus”, MPRA Paper No. 28397. Franz. W, (2005), “Will the (German) NAIRU Please Stand Up?”, German Economic Review, 2, 131– 153. Furuoka, F. (2007), “Does the Phillips Curve Really Exist? New Empirical Evidence from Malaysia”, Economics Bulletin, 5, 1-14. Gali, J, Gertler, M and Lopez-Salido,J.D (2005). Robostness of the Estimates of the Hypbrid New Keynesian Philips curve, Journal of Monetary Economics, 52, pp. 1107-1118. Graham. L and D. Snower (2002), “The Return of the Long-Run Phillips Curve”, Working Paper, Department of Economics, Birkbeck College, University of London. Hansen, M and R. Pancs, (2001), The Latvian Labour Market Transition: the Beveridge and Phillips Curve as Indicators of Normalisation, Riga: Euro Faculty. Islam, F., K. Hassan, M. Mustafa, and M. Rahman (2003), “The Empirics of US Phillips Curve: A Revisit”, American Business Review, 20(1), 107-112. Karanassou, M. H. Sala and D. J. Snower. (2005), “A Reappraisal of the Inflation- Unemployment Tradeoff”, European Journal of Political Economy, 21, pp. 1–32. Karanassou, M., Sala, H. and Snower. D.J. (2003), “The European Philips Curve: Does the NAIRU exist?”, Applied Economics Quarterly, 2, 93-121. Kustepeli, Y. (2005), “A Comprehensive Short-run Analysis of a (Possible) Turkish Phillips Curve”, Applied Economics, 37, 581–91. Leybourne, S. J. and P. Newbold (2003), Spurious rejections by cointegration tests induced by structural breaks, Applied Economics, 35(9), 1117-21 Lipsey, R.G. (1960), “The Relation Between Unemployment And The Rate Of Change Of Money Wage Rate In United Kingdom 1962-1951”, Econometrica, 27, 1-12 Lucas, R. E. Jr. (1976), “Econometric Policy Evaluation: A Critique”, Carnegie-Rochester Series on Public Policy, 1, 19-46. Malinov, M. J. and P. M. Sommers (1997), “A New Line on the Phillips Curve”, Social Science Quarterly, 78(3), 740-746. Niskanen, W.A. (2002), “On the Death of Phillips Curve”, Cato Journal, 22, 193-98 Okun, A.M. (1975), “Inflation: Its Mechanics and Welfare Costs”, Brookings Papers On Economics Activity, 2, 351-390. Onder, A.O. (2004), “Forecasting Inflation In Emerging Market Markets By Using The Philips Curves and Alternative Time Series Model”, Emerging Markets Finance and Trade, 40, 71-82. Paul, B. P. (2009), “In Search of the Phillips Curve for India. Journal of Asian Economics” 20, 479488. Phelps. E. (1967), “Phillips Curve, Expectation of Inflation, and Optimal Inflation over Time”, Economica, 34, 254-281. Russell. B, and A. Banerjee (2008), “The Long-run Phillips Curve and Non-stationary of Inflation”, Journal of Macroeconomics, 30, 1792–1815.
74
Mihaela Simionescu
Pesaran, M.H., Shin, Y. and Smith, R. J. (2001), “Bonds Testing Approaches to the Analysis of Level Relationships”, Journal of Applied Econometrics, 16, 289-326. 348.
Reichel, R. (2004), “On the Death of the Philip Curve: Further Evidence”, Cato Jourtnal, 24, 341-
Schreiber. S and . Wolters (2007), “The Long-Run Phillips Curve Revisited: Is the NAIRU Framework Data-consistent?”, Journal of Macroeconomics, 29, 355–367. Solow, R.M. (1970), “Dicussion of R.J Gordon’s Recent Acceleration of Philips Curve in Malaysia”, Discussion Paper-39, Monash University. Stock, J.H. and M. Watson (1993), “A Simple Estimator of Cointegrating Vectors in Higher Order Integrated System”, Econometrica, 61, 783-820. Turner, P. (1997), “The Phillips Curve, Parameter Instability and the Lucas Critique”, Applied Economics, 29(1), 7-10. Tang, C. F., and H. H. Lean (2007), “The Stability of Phillips Curve in Malaysia”, Discussion Paper39, Monash University. Turner D. and E Seghezza (1999), “Testing for a Common OECD Phillips Curve”, Economics Department Working Paper No. 219, OECD.
STRATEGIC IMAGE OF DEVELOPMENT OF THE REGIONAL SOCIALOFINFRASTRUCTURE RUSSIA MONTENEGRIN JOURNAL ECONOMICS, Vol.IN 10, No. 1 (July 2014), 75-83
75
STRATEGIC IMAGE OF DEVELOPMENT OF THE REGIONAL SOCIAL INFRASTRUCTURE IN RUSSIA OLGA ULYANOVA1 and SERGEY YASCHENKO2 ABSTRACT The modern role of the regional social infrastructure is to integrate the interests of economic entities and interests of government agencies. Regions use social infrastructure as a factor of improvement of quality of life and realization of the national development purposes, and at the same time it is the perspective business sphere and the effective space of diffusing the innovations. The development vector of the social infrastructure is directed towards the modern and innovative changes associated with ecologization and humanization of scientific and technological progress. This is implemented in the application of the investment market and non-market forms, concretized formation of public-private partnerships. KEY WORDS: Social infrastructure, Region, Investment, Public-private Partnership
JEL Classification: H55 Received: February 02, 2014 / Accepted: June 11, 2014
Integrated infrastructure is the result of social development. At this stage scientific and technological progress provides a qualitatively new level of existence of society and the domination of certain sectors of the economy. Its content is determined by the internal economic unity of its industries and specific functional purpose. The emergence of infrastructure is determined by the development of production, which stimulates the emergence of new types of production, servicing, and integrating them with branches, forms of activity. And the formation of post-industrial paradigm promotes the release of a significant part of economic resources for the provision and consumption of services to the community, the process of integration of material and nonmaterial production. Integrated infrastructure in general has a significant impact to the socioeconomic development of the country, but it is specific for each technological stage, the industries develop under the influence of economic laws at a certain stage of economic system’s modernization. There is a relevant type of integrated infrastructure’s development depending on the dominance of production factor at a certain stage of economic development. Industrial paradigm stipulates the importance of technical and technological factors, indicating development and modernization of production infrastructure. The social infrastructure dominates in the postindustrial society, i.e. the human factor is becoming a priority under the new conditions, therefore, there are social investments, enhancing of ecological and humanistic development of the economy. The essence of social infrastructure is forming the conditions for the reproduction of human capital, meeting existing material and spiritual needs of society and creating the new one necessary for human development. Public accumulation’s type radically changes in the postindustrial society, which forms are knowledge, information, intangible wealth (investment in cul-
Department of Economic Theory and Economic Policy, the Volgograd State University of Architecture and Civil Engineering, Doctor of Economics, Professor, E-mail:
[email protected] 2 Department of Economic Theory and Economic Policy, the Volgograd State University of Architecture and Civil Engineering, PhD, Associate Professor, E-mail:
[email protected] 1
76
Olga Ulyanova and Sergey Yaschenko
tural development, education, recreation, health, improvement of living conditions). The holistic nature of social infrastructure expresses in consolidation of its social and innovative development. On the stage of industrial society social infrastructure is built around the sites of production, but to post-industrial - there are processes of its development as an independent element in the form of co-evolutionary movement of industrial and social infrastructure. This is confirmed by the words of Daniel Bell of the relationship between companies in a post-industrial, industrial and pre-industrial stage of development of society. New (creative) companies do not eliminate any of adaptive or even traditional companies in the same extent that the post-industrial society can not replace industrial and even agricultural society. They only determine trends that strengthen the systematic of society and develop the very nature of the social structure (Abalkin L.I., 2006). The study of the genesis of ideas about the nature of social infrastructure suggests that it was paid attention long before the designation of the phenomenon. Premises of functioning of the national economy have been investigated in the writings of Adam Smith on the study of material conditions for rational organization of production; utopians Saint-Simon , Charles Fourier on creation of conditions for the life of society; R. Owen, who tried to translate into reality the idea of providing culturally domestic needs of society. Scientists have attempted to understand the nature and role of social infrastructure in the social development. Experts of different scientific fields have taken part in this task – demographers, sociologists, economists, architects, who tried to respond to topical issues of social development. The logic of social development determines the problem of conditions for efficient production activities. Entrepreneurs had to do with the organization of the infrastructure within the national economy as the complexity of economic relations. Close intertwining patterns and economic interests have been expressed in the formation of infrastructure’s elements, ensuring the reproduction of human capital, i.e. perform some social functions. New stage of development of infrastructure is associated with a growing need to create the necessary conditions for the life of society. Lliving environment becomes as an objective factor in the existence and activity of people, and a resource of manufacturing process during social development, complicating the relationship between human and nature, the humanization of production, improvement of intellectual and professional requirements for people. Moreover there is a situation when during the effective use of working time the organization of leisure time, meet the material and spiritual needs also required. Throughout social development social orientation of traditional elements of production infrastructure is enhancing (transport, communications, etc.), adapting them to meet the material and spiritual needs of society. The object of this study is such infrastructure elements that do not directly relate to the production but create favorable conditions for social development. Housing, healthcare, education, tourism are studied as an integral part of the prerequisites for the quality of life, human capital reproduction. Social infrastructure is aimed at meeting the specific needs of society and its development can not be considered in isolation from their level of culture, cultural patterns, representing an important regulatory mechanism to improve it. Thus, social infrastructure characterizes the interaction of the material and the real environment and social entity (individual, group, society), which is aimed at improving the efficiency of social development, the realization of all that contributes to the formation of human capital and its reproduction, enhancing quality of life . Social infrastructure is a stable set of material elements that create the general conditions for the efficient organization of human activity – labor activity, social activity, political activity and other – developing in the public interest, removing social conflicts. Such an understanding of the social infrastructure allows us to treat it as a separate element of the integrated infrastructure that has a significant impact on the economy and society. The need for a relatively independent development of social infrastructure is determined by the necessity to move to a new cultural pattern, which must keep pace with technological stage. Post-industrial society with the sixth technological stage dominated is characterized by the following features:
STRATEGIC IMAGE OF DEVELOPMENT OF THE REGIONAL SOCIAL INFRASTRUCTURE IN RUSSIA
77
1. The humanization of technological progress, its structure. Orientation of intellectual and technological innovations on the social consumption of environmentally friendly goods, improving quality of recreational and educational services, preservation and enrichment of the cultural heritage. 2. The greening of technological progress, development and dissemination of fundamentally new waste-free technologies, renewable energy sources, instruments of monitoring the environment. 3. The requirements of humanization and greening of technological progress is possible to perform due to balance of the interests of society, human and nature. 4. Globalization of scientific and technological progress, the spread (assimilation) of its achievements across regions and countries for elimination the large economic and technological gap between them. Attention to the reproduction of human capital particularly true when there is a change of technological paradigms and technological stages. Social infrastructure provides effective conditions of human life, not only in production but also in all spheres of society. But it is impossible to replace infrastructure elements between each other - they are in the system, interacting and complementing each other. Social infrastructure is a category of the regional economy, because there is a system servicing of economy and its industries at this level. This sphere functions at different levels facing sectoral and territorial interests of the property and business entities. Elements of social infrastructure have regional character, which goal of development is to create architectural and cultural image of cities and regions, meeting the needs of society. Currently, attention to the science and practice of general and specific problems of regional social infrastructure is increased, due to the trends of its development as a priority element of social infrastructure: -
its place changes and its role increases in the reproductive process, it attracts a large part of the investment and labor investment and innovation capacity increase; social infrastructure development largely determines the competitiveness of the region.
Forming of new features and functions of social infrastructure is determined by evolutionary innovation path of society and its development is accompanied by the appearance and use of new forms and methods of social control (interregional planning, maps of cultural institutions, comprehensive regional development programs, etc.). It is designed to provide various social services to society, so defects in planning the development of social infrastructure elements seriously affect the efficient solution of this important regional problem. Social infrastructure of territorial division is a necessary element of detailing common problems. The lower the level of social organization the more limited set of elements. The main criterion for the efficiency of the infrastructure elements is the ability to meet the needs of society through the provision of quality services. Social infrastructure interacting with other infrastructures in the region ensures the functioning and development of the regional economic system. Elements of social infrastructure have no substitutes in meeting the primary basic needs of individuals, as they are the basis of life of society. Social infrastructure has to be divided on the territorial and sphere of productions basis. A feature of this division of the elements is their attachment to a specific territory. If social infrastructure is studied within the closed socio-economic system the level of major economic area is very important. There is a possibility of comparative analysis of indicators of social infrastructure with other economic units. This is the basis for the forming and adjustment of the concept of development of social infrastructure. At this level certain modifications to the coefficients of its development enter depending on the institutional specification of the region.
78
Olga Ulyanova and Sergey Yaschenko
Territorial asymmetry infrastructure is clearly seen at the intraregional level, but only slightly seen at the interregional level. The modern concept of infrastructure should include the leveling of regional differences. If there are no differences at the level of development of production infrastructure between particular economic areas, but there are significant regional differences of the development of social infrastructure, and overcoming them is one of the most important tasks of the regional policy. The importance and depth of the problem becomes evident under transformation of social infrastructure in the sphere of life support. Regional interest is to provide high quality environmental life support for society by forming regional social infrastructure. Topicality of regional interest is associated with the need to consider the territorial factor, providing independence for regional economies and development of property relations. Thus, social infrastructure creates the necessary conditions for the full life of the society and increasing human potential. Social infrastructure is considered as an independent system of higher order, uniting the industry and agents having one common goal - to ensure the life of society and creating conditions for socio-economic development of the region, and interconnecting each other by relationships of varying complexity and degree of interference. In turn, each of the elements of social infrastructure is a complicated socio-economical system with immanent characteristics, properties and factors of its functioning and development. Figure 1: Social infrastructure at various levels
Source: auth. comp.
STRATEGIC IMAGE OF DEVELOPMENT OF THE REGIONAL SOCIAL INFRASTRUCTURE IN RUSSIA
79
Social infrastructure as a subsystem of the national economy should be considered based on the following principles of its construction (Figure 1): -
Vertical - management level (megaeconomic, macroeconomic, regional and nanoeconomic level); Horizontal - the set of elements belonging to the social infrastructure (health, housing, education, recreation, transport and household systems).
The inherent features of social infrastructure show its social importance and chance of using the competitive mechanism, as well as capital intensity and duration of the payback for investment entities. The peculiarity of the social infrastructure is in existing and interacting marketing (private) and non-marketing (public) forms of solving social problems in its branches. Thus, the regional social infrastructure is a diversified system of elements with complicated connections and relationships, providing socio-cultural, economic and investment and innovation development of the region. Depending on the existing settlement system the territorial distribution of social infrastructure, composition, organization, technical and technological levels establish. This ensures actual services quality to society, the degree of satisfaction of its needs for goods, the formation of a required lifestyle. So, functioning elements of social infrastructure has specificity in the countryside compared with the same mark in urban areas defined by geographically dispersed rural settlements, remoteness from the regional center, the development of road infrastructure, climatic conditions. Social infrastructure is formed depending on the regions factors – both geographic location and functioning of the economic entity. The causes of regional imbalances of social infrastructures are: 1. Geographical (spatial) integrity; 2. The level of development of intra-regional, inter-regional, industrial, economic, sociocultural and other communications; 3. Economic integrity manifested in the structure of management, its specialization and systemic of development; 4. Investment and innovation potential of the region; 5. The capacity of the regional market, including the level of human capital. Asymmetry of the socio-economic environment in the country has a significant impact on the functioning of the state, economic structure and efficiency, the strategy and tactic of institutional change and the socio-economic policy. To reduce this asymmetry the synchronization and consistency of economic policy at the state and regional levels, the strategic regional development program, the expansion of economic resources and increasing their effectiveness are advisable. Asymmetry of development of regional social infrastructure is explained by integrity of its functions (Figure 2- Ulyanova O., Yaschenko S., 2007). Common functions are systemformation, integration, reproduction, regulation. 1. Systemformation function – the solution of optimization problem of social development, the diffusion of scientific and technical progress, and the efficient use of resources and opportunities of modern society depend on clearness of objectives formulation, chosen methods and opportunities to achieve it. Objective functions of the regional social infrastructure are: - providing housing conditions. Housing system is a priority of elements of the regional social infrastructure. According to the hierarchy of needs by A.Maslow housing conditions are the basic needs of the individual and society as a whole. Providing housing conditions is an important social goal, the achievement of which determines the stability of society.
80
Olga Ulyanova and Sergey Yaschenko
- providing medical services. The nation's health is an important component of economic welfare. The average life expectancy is one of the most important health indicators. It had increased in developing countries more than ever in history of these peoples for the period from 1950 to 1990. The importance of providing health care services increases with people income. According to the laws of E. Engel, increasing individuals income leads to greater flow of funds for medical, educational and recreational services. Medical system has such features as a high income elasticity of demand, the rapid scientific and technological progress and the growing consumer isolation of prices. Its role as a social system that prevents the degradation of the nation and a factor of economic development of the country is extremely high. Providing quality medical services may take place only at partnerships between the market and the state; - forming cultural structure of society. The role of the cultural sector to the development of society increases, due to an increase of cultural needs, its impact on the quality of human capital and the expansion of cultural space. Each stage of social development forms a cultural way of life, preserving cultural values and heritage of the previous one; - providing investment in human capital. Economic benefits of investment in education can be regarded as additional income for life of the individual. At each stage of economic development it is advisable to form a balance between investment in human and investment in equipment. According to F. Fukuyama, social status of individual is largely determined by the level of his education in developed countries. Social inequality is the result of unequal access to education; - providing recreational services. The demand for recreational services increases as the quality of life. The structure of recreational services consists of tourism, hotel services, etc. Figure 2: Functions of Social Infrastructure
Source: auth. comp.
STRATEGIC IMAGE OF DEVELOPMENT OF THE REGIONAL SOCIAL INFRASTRUCTURE IN RUSSIA
81
2. Integration function includes processes of consolidation, interdependence and mutual responsibility of economic entities occurring under the influence of values and institutions. This feature allows the association of infrastructure sectors in a single complex in a particular area. Integration is accompanied by ordering system interactions, increasing the number and frequency of contacts and it promotes strengthening economic relations between the business units and industries, increasing their efficiency and investment and innovation activity. All this leads to stability and the integrity of the social infrastructure. 3. Reproductive function ensures the permanence of the reproductive process of production factors and the irreversibility of time. The role of material factors of production changes in post-industrial society. It is in achieving a new quality of economic growth of the country and its regions. Elements of social infrastructure become strategic "points" of innovative breakthrough. "Knowledge-intensive" industries of infrastructure (health, education, research sphere, housing industry, etc.) show a high rate of employment and gross domestic product growth. Implementation of reproductive function involves the preservation, restoration and the increment of production factors. 4 . Regulation function. Regulation of relations between members of society and reducing number of social conflicts are determined by elements of infrastructure, which lead to the formation of a new structure. The subject of the conflict is its internal cause, the basic contradiction, that leads economic actors come into confrontation. The individuals immediately start to institutionalize the activity if it is not ordered or not settled. Dynamic society means that it is constantly changing and simultaneously creating conflicts and disagreements. Regulatory function is based on the cultural component, values and institution. Along with common features that the social infrastructure performs as part of an integrated infrastructure, the authors identify its specific functions: 1. Competition between infrastructure elements. The infrastructure elements compete among themselves developing some of them and slowing others. There are priority infrastructure elements in the social infrastructure that have a multiplier effect and are able to provide investment and innovation development of the social infrastructure and the region as a whole. 2. Reducing social conflicts. Social infrastructure has to reduce social conflicts arising as a result of divergent interests of technological and social development of society. Conflict is a decisive or one of the decisive factors in social development emphasizing its positive functions. The basic idea of social infrastructure is not to eliminate conflict but to reduce its devastating effects and to use its positive features. Conflicts keep the social system of ossification requiring technical innovation and creativity. High level of social infrastructure provides social security in the region giving individual social choice and prospects; 3. Transmitting function (transmitting social experience). The society can not develop if it is not possible to transmit social experience. Social infrastructure needs continuous technological upgrading and the introduction of technical innovations at every stage of social development. Achievements of material culture transmit from generation to generation, creating and increasing cultural heritage of society; 4. Communication function. Produced in the social infrastructure information should be distributed within the infrastructure to manage and monitor its operation and development, and to other types of integrated infrastructure. Carriers of information are the individual and society of the region as a whole. Functions of the regional social infrastructures are carried out by subjects - the state, the companies, society. The special role belongs to the state as it actively participates in production of public benefits, i.e. promotes emergence of positive effects.
82
Olga Ulyanova and Sergey Yaschenko
The development of social infrastructure due to decrease public expenditures was the purpose of the Government of Russia since 1991. The level of public transfers in GNP was 8.1% in 2005, 7.7% in 2006, and 7.5% in 2007, however 12.2 % in 2008, 17.3% in 2009, 17.6% in 2010. Experience of many foreign countries has proven the need and efficiency of the public transfers in the development of social infrastructure. The effective instruments of the modern social policy in Russia are prior national projects: “Health”, “Education”, and “Available and Comfortable Dwelling to Russian Citizens”. These largescale and short-time projects have attempted to solve system problems in the social infrastructure in Russia. Table 1: Basic Indicators of Social Infrastructure in Russia Indicator
2007
Registered unemployment, % Children