Momentum, information flow and quarterly reporting J. Hagaa,1,∗ a
Hanken School of Economics, Handelsesplanden 2, Vaasa 65100, Finland
Abstract This paper examines the impact higher reporting frequency have on the momentum returns. My results suggest that a higher reporting frequency strengthens the momentum return pattern. Further, I find no evidence that this increase in the momentum returns would be caused by a larger overreaction by the investors. Moreover, the increase of momentum returns is mainly caused by lower returns from prior underperformers around the time for the first quarter report. Keywords: momentum, quarterly reporting, information flow, EU market regulations 1. Introduction In this paper, I use the recent changes in reporting frequency among EU countries to investigate how the information flow impacts momentum returns. The EU stock markets present a good setup for investigations of the influence from higher disclosure frequency. Momentum is an important phenomenon in stock returns, because its return pattern is very robust and unexplained by the Fama and French (1996) 3-factor model. The momentum anomaly or factor was discovered by Jegadeesh and Titman (1993). They show that investors can earn abnormal profits by buying prior outperformers and selling prior underperformers. Since the study by Jegadeesh and Titman (1993), studies have shown that the momentum return premium has been robust in 212 years (Geczy and Samonov, 2013), robust on international equity markets (Rouwenhorst, 1998; Chui et al., 2010), and robust for different asset classes (Asness et al., 2013). Even though, the momentum return pattern is robust the explanation for the pattern is highly debated. In this debate, both rational (Johnson, 2002) and behavioral (Hong and Stein, 1999; Daniel et al., 1998) explanations are promoted. In this paper, I shed more light on the behavior explanations of momentum by investigating how the information flow frequency impacts the momentum return pattern. ∗
Corresponding author Email address:
[email protected] (J. Haga) 1 Jesper Haga is from the Hanken School of Economics and Fairfield University
1
The EU capital markets have several desirable features for this study. First, the variation in domestic legislation regarding quarterly reporting presents a good research setup. In addition, these legislations have changed for some countries, but at different time points. Together, these details present a better research setup than a setup where all the legislation changes have happened in one single event at one time point. Second, according to Ernstberger et al. (2011) financial and disclosure regulation is very similar across EU countries with one exception, which is the reporting frequency. This is also one argument for why I have only included the twelve developed countries out of the 27 member countries. All these twelve countries were members of the EU from 1995, this have given these countries several years to harmonize disclosure regulation. Further, majority of the non-included 15 member states have small stock markets or are transition economies and due to this less comparable. I study the impact from more frequent disclosure on momentum returns. In the literature I find two prominent momentum explanations that have different predictions on the impact from quarterly reporting on the momentum returns. First, in a seminal paper by Hong and Stein (1999) they link momentum returns and information diffusion among investors. In their framework a set of the investors so-called ”newswatchers” have a private set of information about fundamentals. Further, by trading activity this information is gradually diffused into market leading to the momentum return pattern. In addition to the ”newswatchers”, Hong and Stein (1999) also include another set of investors the ”momentum traders”. The momentum traders base their trading decisions on prior price movements. Furthermore, the behavioral of the momentum traders creates an overreaction to fundamental news. In summary, the slow diffusion information among the ”newswatchers” starts the momentum pattern, and then momentum traders strengthen the pattern and ultimately cause an overreaction which is corrected by the long-term reversal. Second, Daniel et al. (1998) present a model where investors initially underreact to public information and overreact to their private information. The model accounts for two psychosocial biases, which are that investors are overconfident about the private information and have a strong self-attribution bias. Investors’ self-attribution bias increases their overconfidence after events that confirm their prior believes. According to this model momentum returns should increase in situations where the new public information is supporting the prior private aggregated information among the investors, because of the investors’ self-attribution bias. Further, the long-term reversal should also increase, since the momentum returns increase due to overreactions. With this research design, I show that momentum returns increases when countries enforce 2
quarterly earnings reports. Further, I find that this increase is mostly due to low returns from the prior underperformance around the first quarter report. Interestingly, both prior outperformers and underperformers have lower returns in May and June in countries with higher proportion of firms that reports quarterly. This suggests that investors overall have an over-optimistic view of companies with prior extreme returns before the first quarter report. Overall, the prior underperformers perform worse in countries with a higher proportion of quarterly reporting firms. There is a wellknown psychological fact that more information increases peoples’ confidence (Gilovich et al., 2002). Moreover, more frequent reporting increases available information and this could lead to an increase in investors’ confidence. The increase in information could make investor underestimate the risk for the prior losers. This paper presents several contributions to the literature. First, my results provide evidence suggesting a link between frequency reports and momentum. Second, I add to the literature on the impacts from quarterly reporting. The paper is organized as follows. First, Section 2 presents the prior literature related literature. Second, Section 3 presents the data and the momentum returns for each country. In Section 4 the results from the panel and Fama-MacBeth regressions. Finally, Section 5 concludes. 2. Related literature In this section, effects from higher disclosure regulations are discussed. Disclosure regulation is a tool with which governments can decrease information asymmetries and the adverse selection issue. Asymmetric information refers to the information advantage that managers have over other stakeholders. Further, adverse selection problem occurs when capital suppliers and users have different preferences regarding the efficient capital allocation. In line with this, empirical literature has shown several advantages with higher disclosure such as higher liquidity, lower cost of capital, and a higher firm value (Verrecchia, 2001; Shleifer and Wolfenzon, 2002). Furthermore, one of the big drawbacks with higher disclosure is that it in some cases can impact managers’ real decisions, for example Graham et al. (2005) report that 80% of CFOs would decrease research and development spending to meet their interim report’s target earnings. Numerous studies investigate the impact on higher disclosure on several of company characteristics as stock liquidity, firm value, earnings management, real activities manipulation, and capital cost. But, the literature on how the reporting frequency affects stock price anomalies is very limited. Especially, there is no study that investigates the affect from reporting frequency on momentum 3
pattern in stock prices. According to Jegadeesh and Titman (1993) investors can earn abnormal returns by buying previous outperformers and selling previous underperformers. Further, there are three possible connections between the reporting frequency and momentum in the literature. First, Hong and Stein (1999) suggest that momentum returns arises because information is slowly spread among investors. According to their suggestion a more frequently reporting could decrease the strength of momentum. The logic behind the suggestion is that due to higher reporting frequency there is less private information that has to be gradually diffused into the market. In addition, in an article by Hong et al. (2000) the authors find that the momentum strategy works better for firms with fewer analysts. Further, they suggest that information travels slower for past underperformers than for past outperformers. In addition to Hong and Stein’s (1999) and in line with Hong et al.’s (2000) results, more frequently reporting should affect the short side of the momentum strategy more than the long side. Second, Daniel et al. (1998) derive a model where investors underreact to public information and overreact to private information. If investors constantly underreact to public information, a higher reporting frequency can lead to more aggregated mispricing which can result in higher future momentum returns. Third, Chordia and Shivakumar (2006) show that there is a robust link between earnings momentum and price momentum. Earnings momentum is obtained by sorting companies according to their SUE (seasonal change earnings that are standardized by prior quarter standard deviation) after the sortation investors should buy the companies with the highest SUE and vice versa. Further, the connection Chordia and Shivakumar (2006) reported between earnings momentum and price momentum suggests that there could be a relationship between reporting frequency and price momentum. According to their findings price momentum should be stronger around the release of earnings reports. In 1999, to improve and harmonize the European Union’s capital markets the EU established Financial Services Action Plan (FSAP). As a step to harmonize the EU’s capital markets the European Commission proposed a change in legislation for the capital markets to the European Parliament and the European Council. One of the proposals in the new capital market legislation was that quarterly earnings reporting would be mandatory for all companies listed in EU regulated markets. According to the European Commission this would improve the transparency of the companies from an investors and analysts point of view. As earlier mentioned the accounting and finance literature present both empirical and theoretical evidence supporting the view that quarterly reporting would increase the transparency and decrease the asymmetric information on the capital markets. Even though, there are clear benefits with quarterly reporting some countries (e.g., UK, Nether4
lands, Denmark, and Austria) strongly opposed the proposal by the European Commission. These countries opposition lead to dismission of the proposal. One of the main arguments mentioned by opposing countries was that a higher frequency of earnings reports would increase the short-termism among investors and managements. For the moment quarterly earnings reports are not mandatory in the European Union. Although, there are countries and capital markets in the European Union that demands companies to disclose quarterly earnings reports. Even though, the European Commission failed to make quarterly earnings reports mandatory, they were able to adopt the Transparency Directive (TD) in 2004. The TD regulates the minimum disclosure required from a company listed on EU regulated markets. There are three main parts of the TD: minimum information in the financial reports, notification and reporting of major holdings, and obligations on the timing and storage of this information. Further, all firms listed on the EU Regulated Markets have to follow the directives in TD. The most important aspect of the TD for this study is that it requires companies to provide at least quarterly interim management statements (IMS). In practice, this means that all companies that only report semi-annually have to provide an IMS report for the first and third quarter. According to the investigation by Mazars (2010) the point with IMS was to supply enough information to the market and still avoid the ”short-termist” effect. In addition to the IMS requirement, the TD also requires all EU countries to have an Officially Appointed Mechanism (OAM), OAM should be an information storage from which investors access up-to-date information free of charge. However, IMS only have to contain a general description of the financial position and performance of the company and an explanation of events and transactions that have taken place during the relevant period. The TD had to be included into the countries national law by January 2007, but only two countries (the United Kingdom and France) had included the TD in their law by that time. Furthermore, the last country in this study to implement the TD was Italy in August 2009 (Christensen et al., 2013). Due to criticism of the TD, the EU started an independent investigation of the directive Mazars (2010). The main findings regarding the information disclosure from the investigation were that due to only minimum requirements in the TD member states can create real and costly problems by implementing stricter information disclosure and the absence of flexibility make costs of disclosing the IMS high for small and medium size enterprises (SME). After this investigation, the EU Commission started reviewing the TD and in May they published a new report on the subject. After the review, an updated version of the TD was presented in October 2011. In this not yet approved 5
version of the TD, the EU Commission has totally changed direction and is now planning to abolish mandatory quarterly financial reports for companies listed in EU regulated markets. Furthermore, the new TD in its current form would restrict EU nations from individually implementing stricter rules than in the TD. In this section the current situation in each country is reported. Among the twelve countries in this study there are four different reporting regimes: the sample contains countries where quarterly reporting is voluntary, countries where quarterly reporting have been made mandatory either by the national regulator or the main stock market regulator and have remained mandatory after the TD, countries who had mandatory quarterly reporting before the TD, but only require the IMS after the implementation of the TD, and countries where only a part of the stock market have to report quarterly. Austria: The main stock market is Vienna Stock Exchange. Vienna Stock Exchange can be divided into three segments of which one requires quarterly earnings reports. Those three segments are: Prime Market, Mid Market, and Standard Market. Of these three segments, only companies listed on the Prime Market have to report their earnings quarterly. Further, to be included in the main stock market index ATX (Austrian Traded Index, which contains the 20 largest publicly traded firms in Austria) the companies have to be listed on the Prime Market. Austria’s market for small to mid-sized companies is the Mid Market. Companies listed on the Mid Market only have to report their earnings semi-annually. Both the Prime Market and Mid Market are EU regulated markets, while the Standard Market is a regulated unofficial market. Furthermore, companies listed on the Standard Market are usually micro companies with low liquidity. Belgium: In Belgium the main stock market operator is NYSE Euronext Brussels. Further, NYSE Euronext Brussels can be divided into two segments: the Euronext and Alternext. Neither of these segments requires companies to issue quarterly earnings reports. But, the Euronext is the main segment and it is an EU regulated market. The Alternext is a regulated unofficial market. Denmark : The main stock market in Denmark is NASDAQ OMX Copenhagen. Again, this market can be divided into two segments the main market which is an EU regulated market and the First North which is a regulated unofficial market. In neither of these markets listed companies have to disclose their earnings reports quarterly. Finland : In Finland all public companies are required to report their earnings quarterly. This has been the situation since 1 January 2000. The main stock market operator in Finland is NASDAQ OMX Helsinki, the stock market have two segments: the main market and First North. 6
France: The stock market in France as in Belgium is operated by NYSE Euronext, in France the main operator is NYSE Euronext Paris. As in Belgium, France follows the same structure with the Euronext and Alternext segments. Listed companies in France are not obligated to report quarterly, but all listed companies are obligated to report the sales after each quarter. Germany: Germany in similarity with Belgium has one market segment that requires quarterly earnings reports. This segment is the Prime Standard, but there are also three other market segments: First Quotation Market, Entry Standard, and General Standard. Two of these, the First Quotation Market and Entry Standard are so-called regulated unofficial markets. On the other hand, General Standard and Prime Standard are EU regulated markets. Further, the main market operator in Germany is Deutsche Borse. Italy: Italy is one of two countries which after the adoption of TD only require listed companies to issue the IMS statement. The main stock market operator in Italy is Borsa Italiana, the Italian stock market can be divided into three segments: the MTA, the STAR, and the AIM. Both the MTA and STAR are EU regulated markets, while the AIM as in LSE (LSE also owns Borsa Italiana since 2007) is a regulated unofficial market suited for small and growing companies. Further, the Italian market regulator is Commissione Nazionale per le Societa e la Borsa (CONSOB). Even though, quarterly reporting is voluntary CONSOB encourage companies to report quarterly to increase comparability and transparency. Netherlands: The main market operator in the Netherlands is NYSE Euronext Amsterdam. Neither the Dutch stock market regulator nor NYSE Euronext Amsterdam requires listed companies to report quarterly. Further, the NYSE Euronext Amsterdam has two segments the Euronext and Alternext. Portugal : In Portugal, the Comissao do Mercado de Valores Mobiliarios requires listed companies to report their earnings quarterly. But, not all companies have to report quarterly only companies which meet two of these three criteria: total book value over 100 million Euro, total sales over 150 million Euro, or over 150 employees in 2 consecutive years. Further, the main stock market operator is NYSE Euronext Lisbon. Spain: Spain as Italy have downgraded their requirements from mandatory quarterly reporting to only IMS after the adoption of the TD. The main stock market operator in Spain is Bolsas y Mercados Espanoles (BME). However, the regulator Comision Nacional del Mercado de Valores (CNMV) recommend companies to issue quarterly reports instead of only IMS for better comparability and transparency. Sweden: In Sweden, the main stock market operator is NASDAQ OMX Stockholm. The stock 7
market has two segments: Main Segment (EU regulated market) and First North (regulated unofficial market). Companies listed on the Swedish stock exchange are required by the financial supervisory authority (Finansinspektionen) to report companies’ earnings quarterly. However, Finansinspektionen does not specify the information that has to be issued each quarter. Due to this, NASDAQ OMX Stockholm requires companies to report information according to IAS 34. United Kingdom: The London Stock Exchange (LSE) is the main market operator in the United Kingdom. LSE has two markets one EU regulated market which is the main market and one regulated official market which is the Alternative Investment Market (AIM). The AIM suits young, fast growing, and small companies. Further, neither British regulations nor LSE requires listed companies to report their earnings quarterly. 3. Data In this study, stock market data and accounting variable data are obtained from ThomsonReuter Datastream/WorldScope (Datastream). I start with all common listed stocks, from both the active and defunct Datastream files. Due to the critique on Datastream data given by Ince and Porter (2006), I perform an initial cleaning procedure to increase the credibility of the data. This cleaning procedure aims to eliminate preferred stocks, warrants, retail investment trusts, duplicates and other suspicious equities from the sample. Further, I clean by eliminating companies with suspicious names in the Datastream data. These suspicious phrases are collected from previous studies (Ince and Porter, 2006; Griffin et al., 2010; Watanabe et al., 2013) and from the homepages of stock exchanges. In practice, when a company’s name contains one of the pre-specified phrases that company is removed from the dataset. I also delete those stocks for which Datastream have missing values for reporting frequency (item WC05200). Further, I only divide the reporting frequency in two groups quarterly and non-quarterly reporting companies, there is no separation between companies that report semi-annually and only annually. After initial screening procedure the sample contains 8442 unique firms, this gives 1031159 firm-month observations. Not surprisingly, the number of firm observations per month increase during the sample. For example, while the sample contains 2378 firm observations in January 1990, the number of firm observations in the last month of the sample is 3343. In this study, stock returns are calculated using the local currency. For all countries except Sweden, Denmark, and United Kingdom the local currency is Euro, but for these three countries the local currency is Swedish Krona, Danish Krone, and British Pound, respectively. Furthermore, all return and accounting data is winsorized at the 1% and 99% percentile and return 8
data is also corrected for reversals.2 In addition, when needed MSCI country indices are used as proxies for the local market index. Further, all momentum returns are created by first sorting the companies according to their stock market performance between month t-12 to t-1. In this case, the outperformers refers to the 30% best performing companies during that time span and underperformers refers to the 30% worst performing companies. One month after the sortation period the positions are initialized, the holding period for the positions is one month. Long positions are taken in the prior outperformers and short positions in the prior underperformers. It follows that momentum returns are the long position’s returns minus short position’s returns. In the remainder of this paper this momentum strategy is used, if nothing else is mentioned. In addition, momentum returns are not calculated with less than 30 companies, meaning that both the short and long side has to contain at least 9 companies.
[Table 1 about here.] Table 1 presents basic statistics for all countries. Column 1 reports the average number of firms per year. The United Kingdom has the highest average of 1367, while Austria and Portugal have the lowest average with averages of 67 and 46, respectively. Further, Column 2 and 3 show the median size of the firms in the last year of the sample and the average book-to-market ratio for the whole sample. For each country, Column 4 reports the average percentage of firms which reported quarterly. Sweden and Finland are the two countries with the highest average percentage of reporting quarterly. Further, these two countries have a history of high disclosure. On the other hand, France and United Kingdom have the lowest percentage of quarterly reporting firms. Furthermore, there are large differences between the average percentages of firms reporting quarterly, the averages range from 2.07% to 70.42%. Column 5 shows the month in which the TD was implemented into each country’s national law. Within the sample, France and United Kingdom were the first countries to implement the TD. Further, Italy and the Netherlands were the last two countries from the sample to implement the TD. After a country adopts the TD all EU regulated firms at least have to give quarterly IMS reports, but the countries and stock exchanges are still allowed to have stricter regulations. Of the five countries with mandatory quarterly reporting before 2
According to Ince and Porter (2006) return data from Datastream can contain large reversals due to incorrect price data. This issue is corrected by setting Rt Rt−1 to missing when absolute of Rt is less than 200% or Rt−1 is less than 200% and ((1+Rt )*(1+Rt−1 )-1)< 50%.
9
implementing the TD two countries choose to only demand IMS after the adoption of the TD, those two countries are Italy and Spain.
[Table 2 about here.] Table 2 reports the average equal-weighted monthly excess returns and alphas from the CAPM regression. Columns 1-3 show the excess returns for the momentum strategies, loser portfolios, and winner portfolios. Further, Table 2 shows positive momentum returns for all twelve countries. Moreover, the momentum returns range from 0.65% (Italy) to 1.23% (the United Kingdom). Interestingly, the three countries with the highest average monthly excess returns have never enforced quarterly earnings reports. On the other hand, the two countries with the lowest average monthly excess returns have during the time period enforced quarterly earnings reports. Furthermore, Table 2 columns 4-6 present CAPM-alphas for the momentum strategy, short side and long side. Again, all twelve countries have positive abnormal momentum returns after adjusting for the local market returns. As for excess returns, the highest alphas belong to countries without mandatory quarterly reporting and the lowest alphas belong to countries with mandatory quarterly reporting. Further, by comparing the alphas for the winner and loser portfolios it is possible to understand which side that contributes more to the total alphas. For the majority of the countries both sides contribute equally to the abnormal momentum returns. But, there are exceptions as Finland and Austria where the long side contributes more to the abnormal performance and Germany where the short side contributes more to the abnormal performance. In conclusion, Table 2 suggests that momentum returns among the twelve countries exists, but that there are some differences between the momentum returns from the counties.
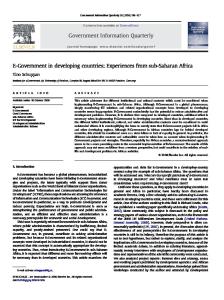
[Figure 1 about here.] Figure 1 reports the percentage of firms that reported quarterly each year. The percentage is increasing during the sample. However, the increase in percentage of firms that report quarterly is strongest from 1998 to 2002. Between 1998 and 2002 the regulations regarding quarterly reporting changed for companies listed in Finland and Sweden. In both countries quarterly reporting became mandatory on the main stock market. The discussion in the EU can also have increased the companies’ willingness to report quarterly, in those countries where quarterly reporting was voluntary. 10
4. Result In this section, I present results of the study. Here, two research methods are used to study if and how a higher reporting frequency impacts the momentum return pattern in stock returns. First, I estimate how each country’s proportion of quarterly reporting firms affects the momentum profits. This estimation is done with a panel regression. Second, I use a Fama-MacBeth regression to study the effects from quarterly reporting on stock return pattern for individual firms. [Table 3 about here.] In Table 3, a correlation matrix is presented. This correlation matrix contains correlations between all the independent variables in the panel regression. Further, Table 3 presents the monthly correlation of these variables percentage of quarterly reporting firms (PerQR), volatility of the equalweighted market index (V), trading volume divided by total market capitalization (TN), average number of analyst per firm (Ana), median firm market capitalization (Size), mean firm leverage (Leverage), mean book-to-market ratio (BM), and mean of days when the stock traded divided by total trading days (PerTDays). Not surprising, there are positive correlations between PerQR, V, TN, and PerTDays. As showed in Figure 1, PerQR increase over time in the sample. Here, I use PerTDays as a measure of liquidity. According to Chordia et al. (2001) and Hameed et al. (2010) the liquidity on stock markets has increased over time. Further, both trading activity and market volatility have increased over time. Since all four variables have increased over time the positive correlation is expected.
[Table 4 about here.] Table 5 reports results from a panel regression. In the panel regression PerQR, IMS dummy, and control variables are regressed on excess momentum returns. The results suggest that momentum returns increase when percentage of firms reporting quarterly increase. This result has both statistical and economic significance. Since an increase in PerQR with 20% can lead to a 0.22% increase in monthly excess momentum returns, giving an annual increase of 2.7%. In column 2 the IMS dummy is added to the regression, IMS have a negative coefficient although not significant. To proceed, I study which of the two sides in the strategy causes the positive PerQR coefficient. Clearly, the poorer performance of prior underperformers is driving the better performance of the momentum strategy for countries with high PerQR. 11
[Figure 2 about here.] To further investigate this matter, Figure 2 shows the coefficient (beta) for PerQR per calendar month. In Figure 2 black bars represent the coefficients when excess momentum returns are the dependent variable, grey bars represent the coefficients when loser portfolio’s excess returns are the dependent variable, and white bars represent the coefficients when winner portfolio’s excess returns are the dependent variable. Panel B in Figure 2 shows that higher PerQR have a statistically positive effect on momentum returns in May and June, but a statistically negative effect on momentum returns in January. Further, this effect is mainly driven by lower returns in the short portfolio. The difference in momentum returns in May and June supports my view that momentum returns and quarterly earnings reports are connected, because majority of companies release their first quarter’s report in May. To proceed, I run Fama-MacBeth regressions to examine the effects from quarterly reporting on a firm level. The results for the Fama-MacBeth regressions are reported in Table 7. Here, results are reported for Fama-MacBeth regressions of returns on an interaction between past returns (r12,2 ) and quarterly reporting dummy, further I control for past returns (r12,2 ), past month’s return (r1,0 ), size and book-to-market. Furthermore, four interactions are examined. These interactions are between quarterly reporting and past returns r12,2 , r1,0 , r12,7 , and r6,2 . Further, three of these four interactions are significant. All three significant interactions have positive coefficients. These significant interactions suggest that past returns have a larger impact on future returns for firms that report quarterly. These results are not in line with the theory from Hong and Stein (1999). According to their model more public information should decrease the momentum returns. In contrast, Table 5 shows that momentum returns increase with more information.
[Table 5 about here.] Figure 3 presents a deeper investigation of the coefficient for the Fama-MacBeth regressions. In the figure, results are reported for Fama-MacBeth regressions of returns on an interaction between past returns (rt−i ) and quarterly reporting dummy and controls for past returns (rt−i ), size and book-to-market. Panel A and B reports the coefficients and corresponding t-statistics for rt−i , i ranges from 1 to 22. In addition, Panel C and D reports similar statistics for the interaction term. First, Panel A and B presents the classic pattern, starting by a short-term reversal. Continuing with the momentum pattern from month t-2 to t-12, where the highest coefficient is found for t-12. This 12
is in line with the empirical studies by Novy-Marx (2012) and Heston and Sadka (2008). Further, the long-term reversal starts from t-14, this is in line with Bondt and Thaler (1985). Moreover, Panel C and D show that rt−3 , rt−6 , and rt−9 have a positive correlation with rt . Since quarterly reports are released with 3 months increments this pattern suggests a relationship between stock momentum and quarterly reporting. In addition, the month with largest negative coefficients for the interaction is rt−13 . Even though, this coefficient is insignificant it still suggest a slightly earlier longterm reversal for firms that report quarterly. In summary, Figure 3 presents a stronger momentum return pattern for firms that report quarterly, but this stronger momentum pattern is probably not caused by an overreaction since there is no evidence suggesting a stronger reversal for quarterly reporting firms. [Figure 3 about here.] In summary, the results from the panel regression and Fama-MacBeth regression suggest that momentum returns are stronger in countries with more quarterly reporting firms. Furthermore, the momentum return pattern is stronger for firms that reports quarterly. Interestingly, I find no evidence a stronger long-term reversal for firms that reports quarterly. 5. Conclusion Momentum returns deserve attention especially because the return patterns are robust and not captured by Fama and French (1996) 3-factor model. In this paper, I examine how a higher reporting frequency affects the momentum return patterns. According to a model by Hong and Stein (1999) momentum returns are driven by the gradual diffusion of information, therefore a higher reporting frequency could decrease momentum returns. In contrast, my analysis indicates that momentum returns are stronger when earnings are reported more frequently. Another striking feature is that, these higher momentum returns originates from months when quarterly reports are released. This finding supports the result from Chordia and Shivakumar (2006). Especially, May and June yields higher momentum returns in markets where there is a higher proportion of the companies that reports quarterly. Moreover, these higher momentum returns are primarily driven by lower returns from prior underperformers, but also the prior outperformers have lower returns in May and June in countries with higher proportion of companies reporting quarterly. Interestingly, there is no evidence of a significant stronger overreaction for companies that report quarterly. My results support parts of the model developed by Daniel et al. (1998), in their model investors constantly 13
underreact public information and overreact private information. The explanation that investors under react to public information suits my empirical evidence, because my results show larger momentum returns, but no increase in long-term reversals. Further, Hong et al. (2000) predict that the information is incorporated slower into the returns in the portfolio that contains prior underperformers. According to their suggestions quarterly reporting should decrease the profits generated on the short side of momentum. But, I find the opposite in this study. Overall, my results points away from an information flow explanation to momentum.
14
References Asness, C., Moskowitz, T., Pedersen, L., 2013. Value and momentum everywhere. Journal of Finance 68, 929–985. Bondt, W., Thaler, R., 1985. Does the stock market overreact? Journal of Finance 40, 793–805. Chordia, T., Roll, R., Subrahmanyam, A., 2001. Liquidity and market efficiency. Journal of Financial Economics 87, 249–268. Chordia, T., Shivakumar, L., 2006. Earnings and price momentum. Journal of Financial Economics 80, 627–656. Christensen, H., Hail, L., Leuz, C., 2013. Capital-market effects of securities regulation: prior conditions, implementation and enforcement, Working paper. Chui, A., Titman, S., Wei, J., 2010. Individualism and momentum around the world. Journal of Finance 65, 361–392. Daniel, K., Hirshleifer, D., Subrahmanyam, A., 1998. Investor psychology and security market under- and overreactions. Journal of Finance 53, 1839–1885. Ernstberger, J., Link, B., Vogler, O., 2011. The real business effects of quarterly reporting Working paper. Fama, E., French, K., 1996. Multifactor explanations of asset pricing anomalies. Journal of Finance 51, 55–84. Geczy, C., Samonov, M., 2013. 212 years of price momentum (the world’s longest backtest: 18012012), Working paper. Gilovich, T., Griffin, G., Kahneman, D., 2002. Heuristics and biases: The psychology of intuitive judgment. Cambridge University Press. Graham, J., Campbell, H., Shiva, R., 2005. The economic implications of corporate financial reporting. Journal of Accounting and Economics 40, 3–73. Griffin, J., Kelly, P., Nardari, F., 2010. Do market efficiency measure yield correct inferences? a comparision of developed and emerging markets. Review of Financial Studies 23, 3225–3277. 15
Hameed, A., Kang, W., Viswanathan, S., 2010. Stock market declines and liquidity. Journal of Finance 65, 257–293. Heston, S., Sadka, R., 2008. Seasonality in the cross-section of stock returns. Journal of Financial Economics 87, 418–445. Hong, H., Lim, T., Stein, J., 2000. Bad new travels slowly: size, analyst coverge, and the profitability of momentum strategies. Journal of Finance 55, 265–295. Hong, H., Stein, J., 1999. A unified theory of underreaction, momentum trading, and overreaction in asset markets. Journal of Finance 54, 2143–2184. Ince, O., Porter, B., 2006. Individual equity return data from thomson datastream: Handle with care! Journal of Financial Research 29, 463–479. Jegadeesh, N., Titman, S., 1993. Returns to buying winners and selling losers: implications for stock market efficiency. Journal of Finance 48, 65–91. Johnson, T., 2002. Rational momentum effects. Journal of Finance 57, 585–608. Mazars, 2010. Transparency directive assessment report. Novy-Marx, R., 2012. Is momentum really momentum? Journal of Financial Economics 103, 429– 453. Rouwenhorst, G., 1998. International momemtum strategies. Journal of Finance 53, 267–284. Shleifer, A., Wolfenzon, D., 2002. Investor protection and equity markets. Journal of Financial Economics 66, 3–27. Verrecchia, R., 2001. Essays on disclosure. Journal of Accounting and Economics 32, 97–180. Watanabe, A., Xu, Y., Yao, T., Yu, T., 2013. The asset growth effect: Insights from international equity markets. Journal of Financial Economics 108, 529–563.
16
List of Figures 1 2 3
Percentage of reporting quarterly per year . . . . . . . . . . . . . . . . . . . . . . . Excess momentum returns per calendar month . . . . . . . . . . . . . . . . . . . . . Fama-MacBeth coefficent . . . . . . . . . . . . . . . . . . . . . . . . . . . . . . . . .
17
18 19 20
Percentage of firms reporting quarterly per year
40%
Percentage of firms reporting quarterly
35%
30%
25%
20%
15%
10%
5%
0
1989
1992
1995
1998
2001 Year
2004
2007
2010
2013
Fig. 1. Percentage of reporting quarterly per year This figure presents the percentage of companies that reported quarterly for each year. The percentages start from 1987 and end in 2013.
18
Panel A: Beta per calender month
3
Panel B: Newey−West t−statistic per calender month
4
3
2
Newey−West t−statistics
2
Beta
1
0
−1
1
0
−1
−2 −2
−3
−3
−4 Jan
Feb
Mar
Apr
May
Jun Jul Month
Aug
Sep
Oct
Nov
Dec
Jan
Feb
Mar
Apr May
Jun
Jul Aug Sep Month
Oct
Nov Dec
Fig. 2. Excess momentum returns per calendar month This figure has two panels, Panel A plots the coefficients and Panel B plots the Newey-West t-statistics. Presented are the coefficients and t-statistics for each calendar month from an OLS regression where percentages of firms reporting quarterly are regressed on excess returns for momentum, loser and winner portfolio. The black bar represent the coefficient when excess momentum return is the dependent variable, white and grey bars represent coefficients when the loser and winner portfolio are the dependent variables. The datamaterial starts in July 1991 and ends in September 2013.
19
Panel A: Fama−MacBeth beta lagged returns
2
4
1.5
3
1
2
0.5
0
−0.5
1
0
−1
−1
−2
−1.5
−3
−2
−4
−2.5
1
2
3
4
5
6
7
8
−5
9 10 11 12 13 14 15 16 17 18 19 20 21 22 Lag
Panel C: Fama−MacBeth beta for interaction between lagged returns and QR
2
Panel B: Fama−MacBeth t−statistics for lagged returns
5
Fama−MacBeth t−statistics
Average Fama−MacBeth beta lagged returns
2.5
1
2
3
4
5
6
7
8
9 10 11 12 13 14 15 16 17 18 19 20 21 22 Lag
Panel D: Fama−MacBeth t−statistics for interaction between lagged returns and QR
3
1.5 2
Fama−MacBeth t−statistics
Fama−MacBeth beta
1
0.5
0
−0.5
1
0
−1
−1 −2 −1.5
−2
1
2
3
4
5
6
7
8
9 10 11 12 13 14 15 16 17 18 19 20 21 22 Lag
−3
1
2
3
4
5
6
7
8
9 10 11 12 13 14 15 16 17 18 19 20 21 22 Lag
Fig. 3. Fama-MacBeth coefficent This table presents Fama-MacBeth regression coefficient and t-statistics. Results are presented for regressions companies’ returns on past performance rt−i (presented in Panel A and B) and an interaction term between a quarterly reporting dummy and past performance rt−i (presented in Panel C and D). The results are controlled for size and book-to-market ratio. Lags i=1...23 are used. The sample covers July 1991 to September 2013. In addition, years with less than 100 firms with a quarterly reporting are dropped.
20
List of Tables 1 2 3 4 5
Summary statistics by country . . . . . . . . . Equal-weighted excess momentum returns . . Correlation coefficients between the dependent Panel regression . . . . . . . . . . . . . . . . . Fama-MacBeth regression . . . . . . . . . . .
21
. . . . . . . . . . . . . . . . . . variables in the . . . . . . . . . . . . . . . . . .
. . . . . . . . . . . . . . . . . . panel regression . . . . . . . . . . . . . . . . . .
. . . . .
. . . . .
. . . . .
22 23 24 25 26
Table 1 Summary statistics by country This table reports country-level summary statistics. The table presents the mean number of firms per year, mean percentage of firms that report quarterly and the month in which the country adopted the TD. In addition, the table also presents the reporting regime before and after the adoption of the TD. Results are derived from data for September 1987 to September 2013.
Country
Austria Belgium Denmark Finland France Germany Italy Netherlands Portugal Spain Sweden United Kingdom
Average Average TD number of percentage transposition firms of QR firms 67 38.6% Apr-07 101 13.1% Sep-08 166 34.1% Jun-07 100 62.6% Feb-07 566 3.1% Dec-07 514 32.5% Jan-07 207 50.3% Apr-09 134 22.4% Jan-09 46 56.6% Nov-07 118 64.2% Dec-07 294 75.3% Jul-07 1367 2.2% Jan-07
22
QR before TD
QR after TD
No No No Yes No No Yes No Yes Yes Yes No
Only IMS Only IMS Only IMS Yes Only IMS Only IMS Only IMS Only IMS Yes Only IMS Yes Only IMS
Table 2 Equal-weighted excess momentum returns This table shows excess returns, CAPM-alphas and corresponding Newey-West corrected t-statistics for the momentum portfolio, loser portfolio and winner portfolio. The momentum returns are calculated in the local currency. The market index used in the CAPM regressions is the local MSCI market index. Results are derived from data for July 1991 to September 2013.
Country Austria
Loser (L) Winner (W) W minus L 0.14 1.23 0.86 ∗ (0.35) (3.77) (2.99)∗ Belgium -0.19 1.26 1.21 ∗ (-0.57) (5.02) (4.90)∗ Denmark -0.20 1.16 1.12 ∗ (-0.61) (4.78) (5.48)∗ Finland 0.21 1.34 0.87 (0.47) (3.60)∗ (2.86)∗ France 0.07 1.16 0.85 (0.47) (4.31)∗ (3.62)∗ Germany -0.29 0.93 0.97 ∗ (-0.78) (3.83) (3.69)∗ Italy -0.28 0.61 0.65 (-0.63) (1.95) (2.80)∗ Netherlands -0.08 1.11 0.95 ∗ (-0.22) (3.91) (3.67)∗ Portugal -0.36 0.92 1.03 (-0.83) (2.83)∗ (3.01)∗ Spain -0.05 0.91 0.72 ∗ (-0.12) (3.02) (2.52)∗ Sweden 0.15 1.27 0.87 ∗ (0.28) (3.40) (2.72)∗ United Kingdom -0.42 1.04 1.23 ∗ (-1.12) (3.92) (5.47)∗ Mandatory QR -0.51 1.00 1.26 (-1.26) (3.67)∗ (4.75)∗ Voluntary QR -0.32 1.07 1.16 (-1.00) (4.57)∗ (5.93)∗ Note: Significant t-statistics on a 5% level is marked with *.
23
L-alpha -0.18 (-0.72) -0.57 (−2.64)∗ -0.85 (−3.55)∗ -0.37 (-1.16) -0.38 (-1.53) -0.74 (−2.37)∗ -0.62 (−2.50)∗ -0.68 (−2.65)∗ -0.52 (-1.69) -0.69 (−2.52)∗ -0.68 (−1.97)∗ -0.84 (−2.52)∗ -1.02 (−3.31)∗ -0.74 (−2.80)∗
W-alpha 0.95 (4.68)∗ 0.98 (5.61)∗ 0.66 (3.93)∗ 0.89 (3.17)∗ 0.81 (3.17)∗ 0.61 (3.08)∗ 0.36 (2.15)∗ 0.63 (3.46)∗ 0.79 (3.99)∗ 0.46 (2.62)∗ 0.64 (2.83)∗ 0.73 (3.43)∗ 0.65 (3.25)∗ 0.71 (4.02)∗
Mom-alpha 0.90 (3.19)∗ 1.31 (5.66)∗ 1.27 (6.44)∗ 1.01 (3.48)∗ 0.95 (4.24)∗ 1.10 (4.25)∗ 0.74 (3.55)∗ 1.08 (4.30)∗ 1.05 (3.16)∗ 0.91 (3.50)∗ 1.06 (3.48)∗ 1.33 (6.42)∗ 1.41 (5.36)∗ 1.19 (5.81)∗
Table 3 Correlation coefficients between the dependent variables in the panel regression This table presents the correlation coefficients of these variables percentage of quarterly reporting firms (PerQR), volatility of the equal-weighted market index (V), trading volume divided by total market capitalization (TN), average number of analyst per firm (Ana), median firm market capitalization (Size), mean firm leverage (Leverage), mean book-to-market ratio (BM), and mean of days when the stock traded divided by total trading days (PerTDays). This correlation is calculated from data from the time period July 1991 to September 2013.
PerQR V TN Ana Size Leverage BM PerTDays
PerQR V 1 0.315 1 0.348 0.208 -0.051 0.067 -0.249 -0.126 0.160 0.056 -0.043 0.100 0.260 0.168
TN
1 0.122 -0.127 0.052 0.100 0.214
Ana
Size
Debt
1 -0.173 1 0.056 -0.070 1 -0.180 -0.223 -0.132 0.285 0.149 0.211
24
BM
PerTDays
1 -0.267
1
Table 4 Panel regression This table shows coefficients and White cross-section cluster robust t-statistics. The time period for this panel regression ranges from July 1991 to September 2013.
M omExcess 1.03 (0.69) 1.10 (2.31)∗
M omExcess C 1.21 (0.80) PerQR 1.07 (2.25)∗ IMS -0.42 (-1.14) V -58.53 -59.50 (-1.41) (-1.43) TN 44.34 30.70 (0.14) (0.00) Ana 0.05 0.06 (0.10) (0.11) Size 0.00 0.00 (1.06) (0.30) Debt 0.50 0.10 (0.36) (0.07) BM 0.85 1.03 (1.12) (1.33) PerTDays -1.41 -1.49 (-1.41) (-1.47) Country FE Yes Yes Month FE Yes Yes Countries 12 12 Start date July 1991 July 1991 Note: Significant t-statistics on a 5% level is
LExcess -0.47 (-0.24) -1.61 (−2.58)∗
34.24 (0.49) 94.60 (0.35) -0.25 (-0.43) -0.00 (−2.18)∗ -0.59 (-0.37) -1.34 (-1.38) 3.39 (2.37)∗ Yes Yes 12 July 1991 marked with *.
25
LExcess -0.79 (-0.39) -1.56 (−2.51)∗ 0.73 (1.92) 35.93 (0.73) 118.13 (0.43) -0.26 (-0.44) -0.00 (−2.15)∗ 0.10 (0.06) -1.65 (-1.66) 3.53 (2.44)∗ Yes Yes 12 July 1991
WExcess 0.83 (0.68) -0.51 (-1.13)
-24.58 (-0.85) 134.73 (0.72) -0.21 (-0.59) -0.00 (-1.78) 0.16 (0.19) -0.54 (-0.81) 1.89 (1.90) Yes Yes 12 July 1991
WExcess 0.72 (0.58) -0.50 (-1.09) 0.27 (1.02) -23.95 (-0.83) 142.52 (0.77) -0.22 (-0.60) -0.00 (-1.77) 0.41 (0.49) -0.65 (-0.94) 1.95 (1.95) Yes Yes 12 July 1991
Table 5 Fama-MacBeth regression This table reports results from Fama-MacBeth regressions. The dependent variable in these regressions are rt . The independent variables are an interaction between a dummy (QR) for quarterly reporting and prior returns (r), prior returns (r12,2 ), last month’s return (r1,0 ), the log value of the market capitalization and book-to-market ratio. The sample covers July 1991 to September 2013. In addition, years with less than 100 firms that reported quarterly are dropped.
Independent variables QR*r12,2 QR*r1,0
(1)
(2)
(3)
(4)
0.87 (3.56)∗ 0.50 (0.68)
QR*r12,7
0.87 (2.84)∗
QR*r6,2 r12,2
1.44 1.58 1.51 ∗ ∗ (5.14) (5.35) (5.23)∗ r1,0 -1.14 -1.27 -1.17 (-1.87) (−2.30)∗ (-1.94) log(ME) -0.01 -0.01 -0.01 (-0.68) (-0.67) (-0.68) BM 0.72 0.72 0.72 ∗ ∗ (10.95) (10.87) (10.94)∗ Note: Significant t-statistics on a 5% level is marked with *.
26
1.08 (2.58)∗ 1.49 (5.18)∗ -1.14 (-1.93) -0.01 (-0.69) 0.72 (11.00)∗