2 Molecular Phylogeography of Snakes FRANK T. BURBRINK AND TODD A. CASTOE
Phylogeography is a relatively young field that investigates the historical and contemporary processes that affect the geographic distribution of genealogical lineages, particularly those at the intraspecific level (Graves et al. 1984; Avise et al. 1987; Avise 1998). Phylogeography occupies a place between microevolutionary (demography, population genetics, and ethology) and macroevolutionary (systematics, historical biogeography, and paleoecology) fields (Avise 2000). Ironically, since the term was coined, the lines that demarcate phylogeography from phylogenetic and population genetic studies has substantially blurred, and it may be more reasonable to consider this subdiscipline to be research that incorporates both macro- and microevolutionary processes rather than occupying a discrete space between these two scales. The main benefit of phylogeographic studies is that they reveal patterns that are too difficult to discover using other less integrative approaches. For instance, phylogeographic studies can detect cryptic genetic diversity in the geographic range of a taxon, which may be an early step in the recognition of new species (e.g., Zamudio and Greene 1997; Burbrink et al. 2000; Parkinson et al. 2000; Burbrink 2001; Rodríguez-Robles et al. 2001; Feldman and Spicer 2002; Castoe et al. 2003, 2005). In this sense, phylogeography may provide the initial information about the geographic range of a newly defined lineage; this in turn may supply critical information used to prioritize conservation efforts aimed at maintaining viable populations of newly discovered lineages (Fig. 2.1). Because assessing species boundaries and recognizing the true biodiversity of a region is a primary goal for conservationists, phylogeographic research is tied intimately to conservation biology. Phylogeographic methods also allow the examination of hypotheses Chapter 2 from Snakes: Ecology and Conservation, edited by Stephen J. Mullin and Richard A. Seigel, published in 2009 by Cornell University Press. This excerpt may not be reproduced in any form without permission in writing from the publisher. See www.cornellpress.cornell.edu for more information.
Molecular Phylogeography
39
concerning the effects of dispersal on population structure and the temporal and geographic origins of lineage diversity (Kolbe et al. 2004; Driscoll and Hardy 2005; Holland and Cowie 2007; Rodríguez-Robles et al. 2007; see Fig. 2.1). Comparative phylogeography has also emerged as a method for inferring the role of historical events and demographic processes in shaping genetic diversity in ecological communities. This approach asks, are species within a particular area affected by similar historical events and if so, how? Compared with single-species studies, this multispecies approach enables broader inferences to be made about the importance of particular geographic areas, the diversity these areas harbor, and the common historical processes that have generated biodiversity (Moritz and Faith 1998; Feldman and Spicer 2006; Rowe et al. 2006; Huhndorf et al. 2007). In comparison with other vertebrates, particularly mammals and birds, few snake species have been the subject of substantial and well-sampled phylogeographic research. For example, only 3 of the 148 species (Lawson 1987; Burbrink et al. 2000; Burbrink 2002) included in a comparative phylogeographic study of taxa occurring in the southeastern United States were snakes (Soltis et al. 2006), despite the fact that more than 30 snake species occur between the Mississippi River and the Florida panhandle (Crother et al. 2000, 2003; Gibbons and Dorcas 2005). A small percentage of snakes found in the United States have actually been examined phylogeographically and the species that have been the subject of phylogeographic studies worldwide is shockingly low, particularly in the most biologically diverse areas, the New and Old World tropical regions (Greene 1997). Of the approximately 3000 described species of snakes, we estimate less than 3% of them have been examined phylogeographically. Consequently, studies on snakes have contributed little to the methodological development of the field of phylogeography. This is unfortunate because phylogeographic research on snakes has the potential to yield valuable information on snake biodiversity, taxonomy, and evolution, and may further contribute strongly as a model system for elucidating and validating broader phylogeographic patterns that may have shaped many components of a region’s biota. Data needed for phylogeographic studies of animals are most often derived from DNA sequences. Other genetic markers, such as allozymes, tandomly repeated microsatellite markers (sequences made up of a single, short, repeated motifs), randomly amplified polymorphic DNA (RAPDs; Harris 1999; Ali et al. 2004), amplified fragment length polymorphisms (AFLPs; Bensch and Åkesson 2005), and short and long interspersed elements (SINEs and LINEs, respectively; Shedlock et al. 2004; Ray 2007) can also be used in phylogeographic studies. Given that most studies currently infer phylogeographic estimates (i.e., trees) from DNA sequences, particularly mitochondrial DNA (mtDNA), our focus in this chapter includes methods of analysis, experimental design, and other considerations predominantly for mtDNA-based phylogeographic data. Chapter 2 from Snakes: Ecology and Conservation, edited by Stephen J. Mullin and Richard A. Seigel, published in 2009 by Cornell University Press. This excerpt may not be reproduced in any form without permission in writing from the publisher. See www.cornellpress.cornell.edu for more information.
Clade B Dispersal to west of the Mississippi River
Clade A East of the Mississippi River
Fig. 2.1. Hypothetical scenarios demonstrating processes responsible for the phylogenetic and associated spatial (geographic) relationships at a common genetic barrier for snakes — the Mississippi River. In examples (a–e), the shading of the circles represents clade designation, whereas in (f) they represent sampling location relative to the barrier. (a) Reciprocal monophyly of lineages distributed east and west of the barrier, indicating the function of the river in limiting migration and promoting lineage diversification. Chapter 2 from Snakes: Ecology and Conservation, edited by Stephen J. Mullin and Richard A. Seigel, published in 2009 by Cornell University Press. This excerpt may not be reproduced in any form without permission in writing from the publisher. See www.cornellpress.cornell.edu for more information.
Subspecies 1
Subspecies 2
2 2
2 2
2 2
2 2
21 1 1
2 21
1
2
2
2 22 2
West of the Mississippi River
2
1
East of the Mississippi River
Fig. 2.1 continued. (b) Reciprocal monophyly of lineages with respect to spatial orientation at the barrier in (a); members of each traditionally recognized subspecies do not share a most recent common ancestor.
Chapter 2 from Snakes: Ecology and Conservation, edited by Stephen J. Mullin and Richard A. Seigel, published in 2009 by Cornell University Press. This excerpt may not be reproduced in any form without permission in writing from the publisher. See www.cornellpress.cornell.edu for more information.
Clade B
Clade A
Fig. 2.1 continued. (c) Two distinct lineages are inferred, but these clades are not restricted to specific geographic areas with respect to the barrier. Therefore, it must be assumed that the barrier was not integral to the formation of these lineages or subsequent dispersal has obscured the impact of the barrier.
Chapter 2 from Snakes: Ecology and Conservation, edited by Stephen J. Mullin and Richard A. Seigel, published in 2009 by Cornell University Press. This excerpt may not be reproduced in any form without permission in writing from the publisher. See www.cornellpress.cornell.edu for more information.
d d
d d d
d d
d
d
d d
d d dd
Fig. 2.1 continued. (d) The two deepest clades are not reciprocally monophyletic with respect to geographic region. The initial divergence was not caused by the putative barrier. Due to the dispersal and divergence of the d lineage across the Mississippi River, members of the western (open-circle) clade are more closely related to the lineage east of the barrier (the d clade) than to the other (shaded-circle) lineage west of the barrier.
Chapter 2 from Snakes: Ecology and Conservation, edited by Stephen J. Mullin and Richard A. Seigel, published in 2009 by Cornell University Press. This excerpt may not be reproduced in any form without permission in writing from the publisher. See www.cornellpress.cornell.edu for more information.
d
d
d d
d d d d d
d d d d
d
Fig. 2.1 continued. (e) The earliest and deepest divergence was caused by the barrier. Subsequently, dispersal of the d lineage occurred west of the Mississippi River. This indicates that some individuals found west of the barrier are more closely related to individuals east of the barrier (open-circle clade) than they are to neighboring individuals (shaded-circle clades).
Chapter 2 from Snakes: Ecology and Conservation, edited by Stephen J. Mullin and Richard A. Seigel, published in 2009 by Cornell University Press. This excerpt may not be reproduced in any form without permission in writing from the publisher. See www.cornellpress.cornell.edu for more information.
Fig. 2.1 continued. (f) In this example, shaded circles were sampled west of the barrier and open circles were sampled east of the barrier. However, poor resolution in the phylogenetic tree impairs our ability to make a connection between geography and evolutionary history.
Chapter 2 from Snakes: Ecology and Conservation, edited by Stephen J. Mullin and Richard A. Seigel, published in 2009 by Cornell University Press. This excerpt may not be reproduced in any form without permission in writing from the publisher. See www.cornellpress.cornell.edu for more information.
46
F. T. Burbrink and T. A. Castoe
In this chapter we provide researchers with a broad spectrum of guidelines and suggestions and a general overview of methods for conducting phylogeographic studies of snakes. Our intention is to provide the fundamental information that will allow the novice phylogeographer to design and implement studies that may reveal spatial patterns in the distribution of genetic variation in conspecific populations and uncover the historical processes responsible for producing these patterns. We also address the expanding statistical and computational methods that have permitted researchers to answer questions relating to lineage diversity, divergence dating, demographics, species boundaries, and comparative phylogeography. Last, we provide some examples and summarize current findings and future directions for the field of snake molecular phylogeography.
Data Collection Tissue Acquisition
Acquiring tissues for phylogeographic research from most species, particularly those with wide ranges, is a time-consuming task that can require several years. Ideally, a phylogeographic study includes numerous individuals from as many populations as possible for the researcher to attain the goal of adequately characterizing the major phylogeographic patterns and elucidating the detailed genetic structure and historical demographics of the study species. As with any quantitative study, the number of samples required depends on the power needed to address specific hypotheses of interest. The hard reality is that the sampling scope for any phylogeography project relies on the availability of tissues already collected and the feasibility of legally collecting further tissues in the field. Tissues can be acquired directly from field-caught animals or indirectly through colleagues or museum collections. The first method can be very time consuming and costly, involving completing permit requests, traveling, and conducting fieldwork. The direct acquisition of tissues, however, is most rewarding because it allows researchers to familiarize themselves with the natural history of their study species (e.g., habitat preferences and behavioral patterns). This knowledge is inherently valuable (Futuyma 1998; Wilcove and Eisner 2000) and provides a more holistic understanding of the ecology of the target organisms, which may ultimately play a vital role in interpreting the fundamental aspects that have played key roles in determining phylogeographic patterns. Field collectors must also keep detailed field notes and georeferenced locality records of their samples; these data contain the critical documentation that gives validity to scientific specimens (Simmons 2002). When tissues are acquired indirectly, researchers should make an effort to verify the identity and locality information of the voucher specimens before publishing their results. Chapter 2 from Snakes: Ecology and Conservation, edited by Stephen J. Mullin and Richard A. Seigel, published in 2009 by Cornell University Press. This excerpt may not be reproduced in any form without permission in writing from the publisher. See www.cornellpress.cornell.edu for more information.
Molecular Phylogeography
47
Tissues can also be obtained from colleagues or museum research collections, and many institutions have searchable tissue databases on their websites. Because acquiring tissues is a time-consuming and expensive endeavor, it is inappropriate for researchers to ask colleagues or museums for their samples as the sole source for a phylogeographic study. Workers should petition institutions and individuals for only a small number of samples to supplement their own material collected in the field (or obtained from captive animals with reliable locality data). The contributions of field collectors to a genetic study should not be undervalued. Considering the costs, time, and effort associated with obtaining, preparing, and maintaining tissue collections, researchers who provide a significant fraction of the tissues included in a phylogeographic (or systematic) study should be invited to coauthor the article that reports the findings of the research, depending on the relative contribution of their samples. Nearly all countries and most states in the United States require researchers to obtain a government-issued permit or license before attempting to collect tissues from live or dead animals (Duellman 1999; Simmons 2002). Collecting specimens without appropriate official authorization can lead to a substantial fine, a felony conviction, and severe restrictions on future research. Investigators who wish to collect specimens or tissues in the United States should consult A Field Guide to Reptiles and the Law (Levell 1997). The institutions issuing the permit often request a considerable amount of ancillary documentation, including a research proposal, a description of the numbers of specimens to be collected, and the areas where and dates when the collecting will take place. For wide-ranging taxa, the permit process may require a considerable investment of time and money. Therefore, investigators should submit permit applications several months before their scheduled field expeditions to avoid bureaucratic delays that could force a change or cancellation of collecting plans. Consulting the list of species defined as endangered, threatened, or of special concern prior to applying for permits or visiting targeted areas is recommended. A species with few collecting restrictions in one region may be listed as threatened in another (which drastically complicates the permitting process). Researchers must always keep on hand copies of all collecting permits issued to them or their collaborators when in the field, and some journals require these permit numbers in the acknowledgments section of the resulting article. A government agency can also examine the list of specimens included in a study and ask the author(s) to produce copies of all permits under which the specimens and tissues were collected. Sources of DNA
Many types of tissues, given the various tissue preservation strategies, produce sufficient sources of DNA. Although it is possible to obtain sufficient DNA Chapter 2 from Snakes: Ecology and Conservation, edited by Stephen J. Mullin and Richard A. Seigel, published in 2009 by Cornell University Press. This excerpt may not be reproduced in any form without permission in writing from the publisher. See www.cornellpress.cornell.edu for more information.
48
F. T. Burbrink and T. A. Castoe
from nearly any tissue, the higher the quality of the source (and resulting DNA), the faster and easier it will be to produce results. Poor-quality template DNA can easily increase the effort required to obtain data. The most commonly used tissues are liver and skeletal muscle; these also tend to produce the highest quantity and quality of DNA. If nonlethal collection of tissues is desired (or required), ventral scale clips that include a thin layer of connective tissue at the base of the scales or tail tips of live or road-killed specimens often yield usable DNA. Road-killed specimens in a relatively advanced state of decomposition can yield enough material for genetic studies, provided that the tissue is not taken from the decaying internal organs. Obtaining blood from larger specimens and shed skins are also viable nonlethal means of obtaining quality DNA. The highest DNA yields from shed skins are often obtained from the harder, threadlike, opaque base of the ventral scales. Ultraviolet radiation damages DNA, and very dry and brittle shed skins (or other tissues), substantially exposed to sunlight, are poor sources of DNA. All tissues should be placed in sterile (typically 1.5–2 ml) plastic vials and immediately stored in 95% ethanol, in lysis buffer (see later in the chapter), on dry ice (solid carbon dioxide), in liquid nitrogen, or an ultracold (–70 to –150 °C) freezer. Samples stored in alcohol (or lysis buffer) should be minced or cut in strips (and not overfilled) to allow the preservative to permeate the entire tissue; otherwise parts of the sample may decay with time, yielding unusable DNA. Samples preserved in alcohol should always be kept in dark, dry, and cold places, preferably a –10 °C (or colder) freezer. Storing tissues in ethanol is convenient and inexpensive, but it has its shortcomings; this type of long-term storage precludes samples from being used to obtain non-DNA molecular data (from protein or RNA molecules). Shed skins should be placed in plastic bags and stored in an ultracold freezer. Freezing tissues immediately in liquid nitrogen and storing these either in liquid nitrogen or in a –80 °C freezer is the best way to preserve all molecules (protein, DNA, and RNA) for later use. Qiagen and other companies sell preservative buffers for the long-term preservation and storage of RNA. See Dessauer et al. (1996) for a thorough discussion of issues pertaining to the collection and storage of tissue samples for genetic studies. An alternative to alcohol for preserving DNA from tissues in the field is a detergent-based lysis buffer, which is fairly inexpensive, is easy to make, and produces higher-quality DNA than alcohol storage even after long-term (> 5 years) storage. Unlike alcohol, this type of buffer digests the tissue within several days at room temperature and releases DNA into the buffer. This method also appears to work equally well with fresh tissue, sheds, scale clips, and blood. There are numerous recipes, and we provide one that we have used extensively (with excellent results). The concentrations of reagents for this lysis buffer are 0.5 M tris (hydroxymethyl) aminomethane (Tris), 0.25% ethylenediaminetetraacetic acid (EDTA), and 2.5% sodium dodecyl sulfate (SDS), all in purified distilled water. The recipe for 1 l is Chapter 2 from Snakes: Ecology and Conservation, edited by Stephen J. Mullin and Richard A. Seigel, published in 2009 by Cornell University Press. This excerpt may not be reproduced in any form without permission in writing from the publisher. See www.cornellpress.cornell.edu for more information.
Molecular Phylogeography
49
as follows. Combine 60 g Tris, 2.5 g EDTA, 25 g SDS, and water to a volume of 1 l. Autoclave the buffer, and aliquote it into sterile vials prior to use. Samples in lysis buffer can be kept at or below room temperature for months (at least) and can also be frozen for long-term storage. This preservation method is also convenient because a small volume of frozen sample (mostly buffer) can be easily scraped off and used to extract DNA without the need for sample separation or thawing. DNA Extraction
Extraction and purification of high-quality (substantial amounts of relatively pure and high–molecular weight) DNA from tissues can be accomplished relatively easily with simple laboratory equipment. Two basic options are available: traditional and (commercial) kit methods. Traditional methods include long-established procedures such as SDS-proteinase K /phenol/RNAase and phenol or chloroform extraction protocols (Sambrook et al. 2001). These procedures are cost-effective and generally produce good results, but are time consuming and inefficient for processing numerous samples simultaneously. Furthermore, phenol and chloroform are toxic chemicals and severe environmental pollutants. The kit methods consist of commercial extraction protocols and regents (other than phenol and chloroform); they include the DNeasy Blood & Tissue Kit (Qiagen) and the AquaPure Genomic DNA Tissue Kit and Chelex 100 Molecular Biology Grade Resin (Bio-Rad Laboratories). These kits typically yield sufficient amounts of quality DNA, are fast, and are far more practical for large numbers of samples, but are more expensive. The extraction of DNA with traditional or kit methods works well for most tissues, but there are special considerations for shed skins. To perform DNA extractions from shed skins, we normally use approximately 2 cm of shed from the base of the ventral scales. Larger amounts tend to require more digestion buffer than can fit into a 1.7-ml tube, resulting in poorly digested samples. Suitably fragmented shed skin allowed to digest at 55 °C for 2 or more days in cetyl-trimethylammonium bromide (CTAB) with proteinase K on a rocker platform usually produces enough high-quality DNA for polymerase chain reaction (PCR). Alternatively, grinding sheds into a powder using liquid nitrogen and a mortar and pestle, prior to digestion, appears to dramatically increase the concentration of high-quality DNA (even when standard traditional or kit extraction protocols are used). Thus, highquality DNA can be extracted from sheds but with slightly more work and a higher failure rate than from standard tissues. Amplification of Molecular Markers
After DNA has been extracted from the source tissue, the next step is to select the appropriate segment of DNA that will be amplified with PCR—this Chapter 2 from Snakes: Ecology and Conservation, edited by Stephen J. Mullin and Richard A. Seigel, published in 2009 by Cornell University Press. This excerpt may not be reproduced in any form without permission in writing from the publisher. See www.cornellpress.cornell.edu for more information.
50
F. T. Burbrink and T. A. Castoe
is accomplished using gene- or region-specific oligonucleotide primers. Primers anneal to a complementary sequence in a single-stranded DNA or RNA template, and the DNA polymerase then extends the complementary sequence from the primer. We recommend that researchers not familiar with PCR and DNA sequencing consult a basic text that describes these methods. After gene- or region-specific primers have been either designed or obtained (e.g., from the literature), a PCR thermal cycling reaction (i.e., denaturation, annealing, and extension times and temperatures) must be constructed that will efficiently amplify the gene of interest. Thermal cycling conditions are quite variable due to the different annealing temperatures of primers and the types of PCR kits used. Researchers should consult the literature for PCR reaction chemistry and thermal cycling conditions as a starting point. We have also found that colleagues have been very helpful and have readily shared advice, primer sequences, and PCR protocols. Mitochondrial Gene Sequences: Pros, Cons, and Considerations
Despite some potential shortcomings of mitochondrial markers, these genes have been the workhorse of phylogeographic and phylogenetic studies for several reasons, including the relatively high rate of nucleotide evolution (~5–10 times greater than nuclear protein-coding genes), a general lack of recombination, single-copy status, the large number of mitochondrial genomes per cell that facilitates easy amplification of these genes, and the availability of published primers (and complete mitochondrial genome sequences) that simplifies cross-species primer design. The rapid rate of mitochondrial gene evolution is critical for discerning relatively recent evolutionary events and demographic changes required for addressing many questions in intraspecific phylogeographic studies (Birky 1991; Moore 1995; Broughton and Harrison 2003). The high rate of evolution and smaller effective population size (because mitrochondrial DNA, mtDNA, is inherited maternally as a single allele) lead to a relatively rapid coalescence process that should increase the probability of an mtDNA gene correctly tracking the species tree compared to a nuclear gene (Moore 1995). There are also drawbacks to using exclusively mtDNA data, and we stress that mitochondrial genes are not a panacea. One constraint is that all mitochondrial genes are from single linked genome that is inherited together as a single haplotype or allele only along the maternal lineage. Therefore, phylogenetic patterns from different mitochondrial genes do not provide independent evolutionary information, and they represent only the matrilineal perspective of genealogies. In addition, mitochondrial genes represent a single genetic coalescent event and may not completely characterize the phylogeographic history of the species (Rosenberg and Nordborg 2002; Knowles and Carstons 2007; Edwards et al. 2007). In general, any singlelocus estimate may confound the “true” phylogeographic pattern due to Chapter 2 from Snakes: Ecology and Conservation, edited by Stephen J. Mullin and Richard A. Seigel, published in 2009 by Cornell University Press. This excerpt may not be reproduced in any form without permission in writing from the publisher. See www.cornellpress.cornell.edu for more information.
Molecular Phylogeography
51
hybridization, horizontal transfer, lineage sorting (deep coalescence), gene duplication, and allelic extinction (Zhang and Hewitt 1996; Avise and Wollenberg 1997; Maddison 1997; Hare 2001; Nichols 2001; Rosenberg and Nordborg 2002; Edwards et al. 2007). Given these considerations, we encourage the corroboration of the conclusions from any phylogeographic study that uses only mtDNA genes with estimates from the nuclear genome wherever possible. In snake phylogeographic studies, the most commonly used mitochondrial genes include cytochrome b, nicotinamide adenine dinucleotide (NADH) dehydrogenase subunit 4, the control region, adenosine triphosphotase (ATPase) 6, ATPase subunit 8, 12S ribosomal RNA (rRNA), and 16S rRNA. Primers suitable for the amplification of mtDNA segments across most species of Colubroidea (i.e., the Atractaspididae, “Colubridae,” Elapidae, and Viperidae) are described or referenced in several sources (e.g., RodríguezRobles and de Jesús-Escobar 1999; Burbrink et al. 2000; Burbrink 2001; de Queiroz et al. 2002; Douglas et al. 2002, 2006; Utiger et al. 2002; Vidal and Hedges 2002, 2004; Nagy et al. 2004; Lawson et al. 2005; Wüster et al. 2005a, 2005b; Burbrink and Lawson 2007). Primers to amplify regions of any of the 22 transfer RNAs (tRNAs), two rRNA genes, 13 proteins, and two control regions (in the alethinophidia) could be easily constructed for all species of snakes due to the expanding diversity of complete mitochondrial genome sequences of snakes available from the National Center for Biotechnology Information (NCBI; GenBank). With alignments of these genomes, conserved regions can be identified and primers with similar melting temperatures and appropriate GC nucleotide contents can be developed and synthesized cheaply. There are several important points to consider before choosing a mitochondrial gene or region to use in a phylogeographic study. It is possible that there are already many sequences available on the GenBank website for one particular gene; therefore, it may be most fruitful to use that gene so that a larger data set with more individuals can be constructed. Given the highly variable rates of evolution among mitochondrial genes and taxa (e.g., Mueller 2006) and the unevenness in population structuring, all mtDNA regions will not necessarily produce sufficient variation to facilitate an interesting phylogeographic estimate. For example, the rRNA genes (12S and 16S) and, to a lesser extent, cytochrome oxidase genes tend to evolve fairly slowly compared with other commonly used genes (such as cytochrome b) and the NADH dehydrogenase subunits (Pesole et al. 1999; Jiang et al. 2007). Protein-coding genes have some advantages because many tests of neutrality and population expansion require a protein-coding sequence (to compare synonymous and nonsynonymous rates of evolution). Moreover, they are also easy to align and rarely contain gaps in alignment in phylogeographic studies. Most of the mtDNA protein-coding genes evolve rapidly, particularly at the third codon position, and should produce phylogeographic Chapter 2 from Snakes: Ecology and Conservation, edited by Stephen J. Mullin and Richard A. Seigel, published in 2009 by Cornell University Press. This excerpt may not be reproduced in any form without permission in writing from the publisher. See www.cornellpress.cornell.edu for more information.
52
F. T. Burbrink and T. A. Castoe
structure, if it exists. Furthermore, models of evolution, particularly complex partitioned models (see later in the chapter) seem to fit protein-coding genes well, whereas tRNA and rRNA genes tend to evolve under more complex patterns that are difficult to model due to the impact of secondary structure that leads to compensatory changes. We recommend against using the control region in alethinophidian snakes as a phylogeographic marker, despite the fact that this region is often used in studies of other vertebrates. All alethinophidian snakes sampled contain two mitochondrial control regions that have identical (or extremely similar) sequences that evolve in synchrony through a poorly understood mechanism of concerted evolution (Kumazawa et al. 1998; Kumazawa 2004; Dong and Kumazawa 2005; Jiang et al. 2007). There is also some indication that control regions in alethinophidians may evolve fairly slowly within some species (Ashton and de Queiroz 2001; Jiang et al. 2007). Avoiding this region may be the best strategy for phylogeographic studies due to the complexity, heterogeneity, and duplication associated with the control regions of alethinophidian snake mtDNA. Nuclear Gene Sequences: Pros, Cons, and Considerations
The use of nuclear genes, with their comparatively reduced rate of evolution, for phylogeographic studies in many vertebrates is becoming more com mon, but it has lagged behind mtDNA studies. The slow evolutionary rate provides little or no variation within species, and it ultimately yields little phylogeographic information. There is currently insufficient nuclear genomic data on snakes to design primers for new nuclear genes that are single copy and evolve rapidly enough for phylogeographic studies. In addition, when single-copy nuclear genes are used for phylogeographic studies, they generally provide much less resolution than mtDNA (Heckman et al. 2007) due to many factors, including recombination, gene conversion, large effective population sizes, and incomplete lineage sorting (see Johnson and Clayton 2000; deBry and Seshadri 2001; Palumbi et al. 2001; Allen and Omland 2003; Whittall et al. 2006). Collectively, we have sequenced 14 independent, single-copy nuclear genes in snakes, all of which either provided little or no information at phylogeographic scales or actually turned out to be multicopy. The lack of known nuclear genes suitable for phylogeographic studies represents a substantial hindrance for obtaining non-mtDNA-based phylogeographic inferences. Until nuclear gene regions are identified in snakes that are sufficient to infer phylogenetic structure below the species level, other nuclear markers (not based on DNA-sequence determination) appear to be the most effective resource for assessing nuclear-based population structure. Microsatellites, RAPDs, allozymes, and AFLPs have been used successfully in this role in snakes (see King, Chapter 3). The development of these markers is slow and time consuming, although data collection Chapter 2 from Snakes: Ecology and Conservation, edited by Stephen J. Mullin and Richard A. Seigel, published in 2009 by Cornell University Press. This excerpt may not be reproduced in any form without permission in writing from the publisher. See www.cornellpress.cornell.edu for more information.
Molecular Phylogeography
53
after initial development is often more rapid and inexpensive. Developing these types of nuclear markers and combining them, especially microsatellites, with mtDNA sequence information are areas that should be major priorities for future research. DNA Sequence Alignment
Phylogeographic inferences rely critically on accurate DNA sequence alignment because this alignment is an explicit inference of the homology of DNA characters across sequences. Numerous computational methods, included in programs such as ClustalW (Chenna et al. 2003) and Praline (Simossis and Heringa 2005), have been developed to automate this procedure. The alignment of phylogeographic-scale data sets is, however, often trivial and straightforward because insertions or deletions are rare at such shallow divergences, particularly in protein-coding genes. Moreover, gaps in any protein-coding genes among individuals should occur only at the level of a complete codon (in multiples of 3 bp) for the gene to remain in the correct reading frame required to yield a functional protein. A researcher should be suspicious of any alignments of protein-coding genes that have gaps not placed in multiples of three or that contain internal stop codons. These suggest that an error was made in amplification (possibly due to a pseudogene copy of a mtDNA gene found in the nuclear genome), DNA sequence determination, alignment, or application of the correct genetic code to translate the DNA sequence. Even if automated alignment methods are used, it is always best to visually inspect the alignment for apparent problems. If regions of the alignment appear tenuous to the extent that the homology of the positions is not obvious, then these regions should be excluded from later analyses; this is often relevant only for alignments of non-protein-coding genes (e.g., tRNAs and rRNAs) with insertions or deletions of nucleotides.
Phylogenetic Inference
Phylogenetic relationships among DNA sequences can be estimated and represented in a number of ways. First, we must consider the most appropriate way that sequences should be related: in a network fashion or in a tree-based fashion. Phylogenetic trees represent a subset of phylogenetic networks that are constrained to produce only bifurcating relationships; in trees, only two descendent lineages may stem from a single ancestor and no reticulations (back mutation, hybridization, horizontal gene transfer, recombination, or gene duplication) are allowed in the graphic structure. Phylogenetic trees also assume that ancestral and descendent DNA sequences (i.e., haplotypes) do not coexist in time. The assumptions about bifurcating relationships and the extinction of ancestral sequences are not always satisfied at the Chapter 2 from Snakes: Ecology and Conservation, edited by Stephen J. Mullin and Richard A. Seigel, published in 2009 by Cornell University Press. This excerpt may not be reproduced in any form without permission in writing from the publisher. See www.cornellpress.cornell.edu for more information.
54
F. T. Burbrink and T. A. Castoe
intraspecific level (Templeton et al. 1995; Page and Holmes 1998). It may be useful to construct both phylogenetic networks and phylogenetic trees and to compare the two because trees are most appropriate at the higher levels of sequence divergence and networks are more realistic portrayals of finescale relationships (e.g., within a population). Alternatively, phylogenetic trees can be used to portray relationships among major evolutionary lineages and networks can be used to represent relationships within each major lineage. Traditional Tree-Building Methods
Producing the best phylogenetic estimate from aligned DNA sequences is essential. An incorrect estimate of the phylogeny will ultimately result in erroneous interpretations of the geographic distribution of lineages and historical demographic processes. A detailed explanation of all methods used to infer trees is beyond the scope of this chapter. We do, however, provide a brief overview of the most useful and reliable methods. Phylogenetic methods can be divided into distance-based methods, such as neighbor-joining (NJ) or unweighted pair group method with arithmetic mean (UPGMA), and discrete-character methods, such as maximum parsimony (MP), maximum likelihood (ML), and Bayesian inference (BI). Distance methods rely on the assumption that evolutionary distances can be estimated accurately between all sequences in the matrix and that these can be used to infer phylogenetic relationships, essentially by minimizing the overall distance across the tree (Page and Holmes 1998; Felsenstein 2004). The major objections to using distance-based methods are (1) loss of information from converting character data into distance data, (2) inaccurate estimation of evolutionary distances and branch lengths, and (3) the simplified assumption that overall similarity among individuals is equivalent to evolutionary relationship (Page and Holmes 1998; Felsenstein 2004). Because distance methods yield trees in a matter of seconds, however, they are often very useful for obtaining rapid estimates of phylogeny that can be used to check progress during a study or to verify the accurate labeling of samples or concatenation of data sets. Distance measures can also be used as a starting point for model-based discrete-character methods (BI and ML). MP relies on the assumption that a tree that connects sequences with the fewest number of changes best represents the evolutionary relationships of these individuals. In MP, support for common ancestry is derived only for characters that are presumed to represent shared derived characters (synapomorphies). The method works well when rates of evolution are not highly variable among the terminal taxa, sequence divergence is low, all sites evolve at similar rates, and different types of change occur at similar rates. Many phylogenetic software programs have been created that implement MP; one of the most common is PAUP* (Swofford 2000). The pathological Chapter 2 from Snakes: Ecology and Conservation, edited by Stephen J. Mullin and Richard A. Seigel, published in 2009 by Cornell University Press. This excerpt may not be reproduced in any form without permission in writing from the publisher. See www.cornellpress.cornell.edu for more information.
Molecular Phylogeography
55
behavior of the method when evolutionary rates vary substantially across a tree (or when some very long branches are included) is referred to as longbranch attraction, or the Felsenstein Zone. This results in individuals with long-branch lengths being incorrectly placed as sister taxa due to homoplasy or convergence being erroneously inferred to be due to common ancestry (Felsenstein 1978; Huelsenbeck and Hillis 1993; Siddall 1998; Swofford et al. 2001). Variation in rates of evolution across sites, and variation in the rates of different types of substitutions (e.g., transitions vs. transversions), may also contribute to the failure of parsimony, especially when more divergent sequences are analyzed. These shortcomings are probably not major issues for inferences using extremely closely related sequences. Certain studies of “single” snake species, however, have revealed remarkably evolutionary distant separate geographic lineages, as much as 13% sequence divergence, in mtDNA genes (Burbrink et al. 2000). Accurately estimating branch lengths (i.e., estimated number of substitutions per site), often used to infer rates of evolution and various demographic parameters, is an impossible task under the assumption of MP. Therefore, any subsequent analyses using an MP tree, such as those for demographic estimates, divergence dating, or statistical character mapping, will require more accurate branch-length estimates, disqualifying MP as a particularly useful method. (See Swofford et al. 2001 and Felsenstein 2004 for a comprehensive review of the methods and problems associated with MP estimation.) It is unlikely that most journals in the field would accept results solely from MP estimates (or distance-based methods); they would minimally require additional ML or BI phylogeny estimates. Modern Model-Based Tree Methods Maximum Likelihood
Currently, the most commonly used phylogenetic methods are based on likelihood criteria (Cavalli-Sforza and Edwards 1964; Felsenstein 1973). Likelihood-based methods (both ML and BI) require some understanding of model building and statistics because these probabilistic methods generally attempt to take into account the stochastic rates and patterns of DNA evolution. Numerous studies have shown that ML is particularly robust to many of the potential problems that lead to errors in traditional distance- or parsimony-based methods. In their most basic form, ML methods aim to maximize the likelihood of the observed data (the DNA matrix), given a tree (with branch lengths) and a model of evolution. Essentially, ML methods attempt to find the single most likely estimate (MLE) of the tree that produced the observed DNA data set by evaluating different topologies and branch lengths using credible stochastic models of evolution. Because likelihood-based methods rely on models of DNA evolution, it is critical to carefully select which model is appropriate for each data set. Chapter 2 from Snakes: Ecology and Conservation, edited by Stephen J. Mullin and Richard A. Seigel, published in 2009 by Cornell University Press. This excerpt may not be reproduced in any form without permission in writing from the publisher. See www.cornellpress.cornell.edu for more information.
56
F. T. Burbrink and T. A. Castoe
These nucleotide models typically comprise three groups of parameters: (1) the nucleotide frequencies, (2) the relative rates (i.e., instantaneous rates or stochastic probabilities) of change among different nucleotide states, and (3) the variation of evolutionary rates across sites. In terms of the rates of change among nucleotide states, the least complex model that implies equal probability of change among all nucleotides is the Jukes-Cantor ( JC) model ( Jukes and Cantor 1969): the most complex of the typical models, is the general time reversible (GTR) model, which allows for different probabilities of change between all possible nucleotides but equal rates for forward and reverse substitutions (e.g., the rate of A → C = C → A). These models may also account for variation among the frequencies of the four nucleotides (Lanave et al. 1984; Tavaré 1986; Rodríguez et al. 1990). Many other models of complexities intermediate between JC and GTR exist and are also commonly used. Two other important parameters are often included in typical models to account for the variation of evolutionary rates across sites: the gamma parameter (Γ), which permits rates of evolution to vary in a predefined number of classes across all sites, and the invariable sites parameter (I), which aids Γ by allowing a certain percentage of sites to be classified as invariable (Hasegawa et al. 1987; Jin and Nei 1990; Yang 1996). Identifying the most appropriate substitution model is crucial to finding the MLE of the tree and associated branch lengths. The best-fit model will vary given the data set, and there is no consensus about a single model that is appropriate for all snake phylogeographic projects. In general, the size of a data set and the sequence variation present determine how complex of a model should be used because there must be sufficient variation to accurately estimate all the parameters of a model. Thus, it is not necessarily a matter of applying the most realistic model; it is often more of an issue of determining how complex a model can be accurately inferred based on the data being analyzed. The DNA data matrix will almost always fit the more complex model with a higher likelihood but at the possible price of overparameterization (Rannala 2002). If more model parameters are included than can be reliably estimated, the resulting inferences may be highly inaccurate or otherwise unreliable. Therefore, several statistical methods including the likelihood ratio test (LRT), Akaike information criteria (AIC), Bayesian information criteria (BIC), or Bayes factors (BF; used for Bayesian inference) are applied to choose the most appropriate model prior to phylogenetic estimation (Posada and Crandall 2001; Bollback 2002; Huelsenbeck et al. 2002; Nylander 2004; Nylander et al. 2004; Posada and Buckley 2004). This phase of model testing can be automated using software programs Modeltest (Posada and Crandall 1998) and MrModeltest (http://www.abc.se /~nylander/ ). Several models can be used simultaneously in a single analysis to accommodate different patterns and rates of evolution that may characterize various parts of a single data set; this is commonly referred to as model partitioning. For instance, a complex set of models could characterize a DNA Chapter 2 from Snakes: Ecology and Conservation, edited by Stephen J. Mullin and Richard A. Seigel, published in 2009 by Cornell University Press. This excerpt may not be reproduced in any form without permission in writing from the publisher. See www.cornellpress.cornell.edu for more information.
Molecular Phylogeography
57
data set composed of a protein-coding gene, intron, tRNA, and rRNA. In this example involving a single phylogenetic estimate, one model could account for each of the three codon positions of the protein-coding gene, a second model for the intron, a third for the tRNA, and yet a fourth for the rRNA gene (Nylander et al. 2004; Brandley et al. 2005; Castoe and Parkinson 2006; Burbrink and Lawson 2007). The most difficult part of choosing the appropriate partitioned model centers on determining the number of distinct models and the groups of genes or sites that should be included in the various partitions. At present, manual estimation is necessary to determine which scheme is best. (Detailed examples and suggestions for these partitioned model approaches and model selection can be found in Nylander et al. 2004; Castoe et al. 2004, 2005; Brandley et al. 2005; Castoe and Parkinson 2006; Castoe et al. 2007a). Generally, low (evolutionarily shallow) divergence often characterizes phylogeographic data, and such low divergence and sequence variation may not justify extremely complex models. Finally, quantitative estimates of branch lengths, and even tree topologies, may be quite different depending on the evolutionary models used, particularly for deeper, more ancient divergences (Castoe et al. 2004, 2005; Castoe and Parkinson 2006), even in moderate-scale phylogeographic studies (Castoe et al. 2005). Competently searching or exploring the enormous number of possible phylogenetic trees to identify the most likely topology is a difficult problem for any phylogenetic method. Fortunately for MP and ML, heuristic methods reduce the set of all possible trees to be searched, although heuristic searches do not necessarily guarantee that the best tree will be found (Felsenstein 2004). These methods function by first producing a relatively reasonable tree that joins all individuals together using a method of low computational intensity, such as NJ or stepwise addition. Subsections of the tree are then moved throughout the topology and reconnected to find more likely trees, and topologies with high likelihood scores (ML) or fewer changes (MP) are retained. These hill-climbing algorithms accept only trees with higher likelihoods (or fewer changes, in MP) than those previously visited, and it is possible that the overall (global) best tree may never be reached (see Page and Holmes 1998; Felsenstein 2004). Because a single heuristic search does not guarantee the identification of the most optimal tree, these searches are often repeated many (e.g., 10–1000) times and the best estimate from this set is taken, under the assumption that one of the searches should have reached the global optimum. Support for trees inferred using distance-based, MP, and ML methods are often derived from jacknifing or nonparametric bootstrapping. The former resamples the data set without replacement, whereas the latter resamples with replacement. In nonparametric bootstrapping, the most common approach, pseudo-replicated data sets are produced by resampling the original DNA data sequence with replacement (Felsenstein 1985). Trees are then Chapter 2 from Snakes: Ecology and Conservation, edited by Stephen J. Mullin and Richard A. Seigel, published in 2009 by Cornell University Press. This excerpt may not be reproduced in any form without permission in writing from the publisher. See www.cornellpress.cornell.edu for more information.
58
F. T. Burbrink and T. A. Castoe
estimated for each pseudo-replicate, and the frequency of observance for any relationship is summed across all pseudo-replicates—this frequency is used to represent the bootstrap support (bootstrap percentage) for relationships. For instance, 1000 pseudo-replicated data sets will yield 1000 trees, from which support for any node is assessed by determining the frequency that any node is found among all pseudo-replicated trees. If there are 995 trees that contain a relationship where snake A is sister to snake B, then we can use this as measure of confidence to indicate that 99.5% of the bootstrap trees contain this relationship (Hedges 1992; Hillis and Bull 1993). Generally, relationships (or nodes) found in at least 70 to 80% of the pseudo-replicated trees are considered credible, depending on the data and models used to infer the tree, although warnings against the assumption of a standard measure of support by bootstrapping have been argued (Felsenstein 2004). Bayesian Inference
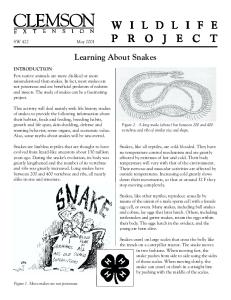
Bayesian inference of phylogeny is becoming increasingly common and is gradually displacing the use of ML methods. For the most part, these two probabilistic methods appear to produce the most reliable tree topologies with the most accurate support values and branch-length estimates. Like ML, BI is also a likelihood model–based method of tree inference, but it has some very key differences. The two most important differences are that BI relies critically on the prior expectations of inferred parameters (including trees) and that the results of BIs represent a distribution of optimal estimates (the posterior distribution) rather than a single-point estimate of the “best” hypothesis (as in ML). (See Holder and Lewis 2003 for an excellent philosophical and practical contrast between these approaches; see also Felsenstein 2004). One major desirable property of the BI approach is that the result of a Bayesian analysis (the posterior) represents a distribution of all the highly optimal estimates; when this distribution is summarized, the resulting estimate is integrated across all these very highly likely estimates. For example, the tree topology and support are averaged over all the highly optimal values of model parameters in the posterior distribution. This approach also allows an enormous increase in computational efficiency over ML while maintaining much of the same positive qualities. Ultimately, the goal for the phylogeographer is the posterior probability distribution of trees (P (ti | X) = the probability of the tree, given the data), which not only yields a final tree estimate but also support for that tree (Fig. 2.2). BI examines the posterior probability by inferring the likelihood of a tree given the data multiplied times prior information about that tree and scaled over all possible arrangements given the data. Unfortunately, the integration (or summation) over all possible trees and parameters is impossible due to computational complexity, or the sheer number of possibilities. To compensate for this and to obtain a posterior probability distribution of trees, the Markov chain Monte Carlo (MCMC) method is used Chapter 2 from Snakes: Ecology and Conservation, edited by Stephen J. Mullin and Richard A. Seigel, published in 2009 by Cornell University Press. This excerpt may not be reproduced in any form without permission in writing from the publisher. See www.cornellpress.cornell.edu for more information.
AZ 26 AZ 32 AZ 22 AZ 29 NM 47 NM 49 82 AZ 35 TX 54 Posterior Probabillity 100% TX 53 AZ 41 0.005 substitutions/site SON 58 SON 57 99 AZ 25 D AZ 19 JAL 64 JAL 67 SIN 62 SIN 63 99 BC 09 BC 08 BC 07 C 99 BCS 14 BCS 15 BCS 13 BCS 11 BCS 12 CA 05 CA 06 72 CA 04 CA 01 CA 03 76 BCS 17 85 BCS 18 BCS 16 A GTM 82 NIC 90 GTM 85 HND 87 96 HND 88 CRI 91 GTM 86 GTM 83 GTM 81 GTM 84 89 GTM 80 66 OAX 75 B OAX 76 GRO 74 52 GRO 73 MICH 70 99 MICH 71 JAL 68 Trimorphodon tau 96
•
•
•
Sonoran + Chihuahuan Deserts
•
•
•
•
•
Northern
•
Western Mexico
•
•
•
•
Baja California
•
•
•
•
•
•
•
•
•
•
Southern Mexico
Southern
Central America
Fig. 2.2. Phylogeographic relationships among lineages of Trimorphodon biscutatus using the ND4 gene and flanking tRNA sequences (Ser and Leu). (a) Tree produced using Bayesian inference with the model GTR + Γ + I with posterior probability support values placed above branches. Γ, gamma parameter; GTR, general time reversible model; I, invariable sites parameter. (By permission of Thomas J. Devitt from Devitt 2006)
Chapter 2 from Snakes: Ecology and Conservation, edited by Stephen J. Mullin and Richard A. Seigel, published in 2009 by Cornell University Press. This excerpt may not be reproduced in any form without permission in writing from the publisher. See www.cornellpress.cornell.edu for more information.
60
F. T. Burbrink and T. A. Castoe
Fig. 2.2 continued. (b) Geographic distribution of lineages and dates of divergence using the Bayesian relaxed clock method in MultiDivTime. Ma, millions of years ago. (From Thorne and Kishino 2002)
(Metropolis et al. 1953; Hastings 1970; Griffith and Tavaré 1994; Kuhner et al. 1995; Larget 2006). This method implements a series of links to form a chain, in which each link in the chain represents a newly sampled tree with substitution and branch-length parameter states. A new parameter state is proposed and forms the next connected link in this chain. Each adjacent link in the chain is similar to the previous one, but slight changes to parameters have been made in some cases, and proposal mechanisms (such as those described in the Metropolis-Hastings method; see Nielsen 2006) determine whether a new set of parameters will be accepted in the new link. Of importance here is that this method does not necessarily always climb hills (or directly optimize) because not all proposals (even if more optimal) are necessarily accepted. Generations are the number of links in a chain, and the MCMC chain may run for many millions of generations (Gilks et al. 1996; Huelsenbeck et al. 2002; Larget 2006). The chain generally moves into areas of high posterior probability, and the amount of time spent in these regions of tree space is equivalent to the support for any topology. The tree samples taken before the chain moves into the region of high probability is referred Chapter 2 from Snakes: Ecology and Conservation, edited by Stephen J. Mullin and Richard A. Seigel, published in 2009 by Cornell University Press. This excerpt may not be reproduced in any form without permission in writing from the publisher. See www.cornellpress.cornell.edu for more information.
Molecular Phylogeography
61
to as burn-in and is discarded (Gilks et al. 1996; Huelsenbeck et al. 2002; Nylander et al. 2004; Larget 2006). A well-constructed chain, or multiple chains, will move through tree space and sample many different topologies and model parameters. At the end of a run, after burn-in generations are removed, the researcher is presented with the posterior probability distribution that can be summarized in the form of a consensus of topologies and branch lengths, with support values (posterior probabilities) for various branches or clades (Huelsenbeck et al. 2002; Holder and Lewis 2003; Larget 2006). Conducting a Bayesian analysis requires knowledge of some very detailed statistical issues. For instance, the proposal mechanism for the MCMC is quite crucial for adequately searching tree space (i.e., to avoid local optima), and the length of the chain is also important to determine that burn-in has occurred (Huelsenbeck et al. 2002; Archibold et al. 2003; Larget 2006). The Bayes theorem also requires the researcher to specify priors for all parameters, which ultimately may affect the posterior probability distribution. Methods of BI are becoming necessary for phylogeographic studies due to the massive sizes of data sets and complexity of models. The most common software programs used to implement BI are the freely available and easy-to-use MrBayes (Ronquist and Huelsenbeck 2003) and BEAST (Drummond and Rambaut 2006). These programs run in a reasonable amount of time and allow the incorporation of some very flexible models, including complex partitioned models and Bayesian relaxed molecular clocks for divergence time estimation. A third program, BEST (Edwards et al. 2007; Liu and Pearl 2007), uses a hierarchical Bayesian method to infer a species (or population) tree from the joint estimate of gene trees while incorporating information from the coalescent.
Comparative Phylogeography
Examining the phylogeographic patterns of independent species with overlapping or partially overlapping ranges may reveal common events that have affected the evolutionary patterns of many taxa in similar ways. This broader field of study—comparative phylogeography—examines codistributed taxa and infers historical, geological, and climatic events that have shaped biogeographic patterns in communities of species (Bermingham and Moritz 1998; Schneider et al. 1998; Avise 2000; Arbogast and Kenagy 2001; Zink 2002; Steele and Storfer 2006). It is expected that, if codistributed species share similar reciprocally monophyletic phylogeographic topologies with genetic discontinuities occurring at the same geographic barriers, they also share a similar relatively stable and long-term history in these areas (Zink 2002). Even if different taxa share similar phylogeographic breaks, however, it is possible that the origins of these lineages in different species Chapter 2 from Snakes: Ecology and Conservation, edited by Stephen J. Mullin and Richard A. Seigel, published in 2009 by Cornell University Press. This excerpt may not be reproduced in any form without permission in writing from the publisher. See www.cornellpress.cornell.edu for more information.
62
F. T. Burbrink and T. A. Castoe
occurred at different times or in slightly different geographic areas, thus producing only pseudo-congruent phylogeographic patterns. As an example, the Mississippi River embayment (forming at the confluence of the Ohio and the Mississippi rivers in southern Illinois, and distinct from the upper Mississippi) has been implicated as a barrier to gene flow for several snake species, including Coluber constrictor, Pantherophis guttatus, and Pantherophis obsoletus (Burbrink et al. 2000, 2008; Burbrink 2002), although the timing of the divergence at this barrier is not known. The pattern of genetic discordance at this river has been found for many unrelated reptiles and amphibians (Burbrink et al. 2000, 2008; Leaché and Reeder 2002; Moriarity and Cannatella 2004; Howes et al. 2006; Soltis et al. 2006). Even if the discordance occurred at a variety of times among the taxa, their phylogeographic structures still demonstrate the power that the Mississippi River embayment has, or once had, in separating formerly connected populations. To determine whether phylogeographic lineages sharing the same geographic range also share similar dates of divergence, several methods should be used to infer lineage age. Therefore, comparative temporal phylogeography assesses the degree of overlap in the dates of origin for codistributed lineages using various nonclocklike methods, including penalized likelihood with error estimation (Sanderson 2002, 2003) and Bayesian relaxed molecular clocks (Drummond et al. 2006; Thorne and Kishino 2005). In addition, incongruence among codistributed taxa may occur due to lineage sorting, variation in effective population size, extinction, dispersal, sympatric speciation, or a lack of response to vicariant events (MasonGamer and Kellog 1996; van Veller et al. 1999; Crisci et al. 2003). The method of approximate Bayesian computation (ABC), implemented in the software program MsBayes (Hickerson et al. 2006, 2007) is designed to test for simultaneous divergence (vicariance) across various population pairs that span the same barrier. Simultaneous separation at a barrier in MsBayes is tested on all population pairs from all taxa of interest by estimating three hyperparameters that characterize the degree of variability (the mean, variability, and number of splitting events) in divergence times across codistributed population pairs while allowing for variation in several withinpopulation-pair demographic parameters (subparameters) that affect the coalescent. Properly conducting a comparative phylogeographic study not only requires a good knowledge of phylogeographic methods but also a detailed understanding of geology and other relevant historical events (e.g., climate change and glacial cycles). Several other barriers have been implicated in the formation of distinct lineages within species having overlapping ranges in the United States (Bermingham and Moritz 1998; Soltis et al. 2006). Many phylogeographic studies on terrestrial vertebrates, including snakes, in western North America have shown that common barriers to gene flow occur Chapter 2 from Snakes: Ecology and Conservation, edited by Stephen J. Mullin and Richard A. Seigel, published in 2009 by Cornell University Press. This excerpt may not be reproduced in any form without permission in writing from the publisher. See www.cornellpress.cornell.edu for more information.
Molecular Phylogeography
63
at the Rocky Mountains, the Great Basin, the division between the Chihuahuan and Sonoran deserts and the associated Cochise filter barrier / Continental Divide, and the Transverse Mountains in southern California (Zamudio et al. 1997; Pook et al. 2000; Avise 2000; Devitt 2006; Feldman and Spicer 2006; Castoe et al. 2007b). In eastern North America, major barriers to gene flow have been identified at the Mississippi River, the Tombigbee River and Mobile Bay, the Appalachian Mountains, the Apalachicola River, the Teays /Ohio River, and the river systems situated at either side of the eastern Continental Divide (Burbrink et al. 2000, 2008; Moriarty and Cannatella 2004; Howes et al. 2006; Kozak et al. 2006; Soltis et al. 2006; Lemmon et al. 2007). These ancient geological barriers may have had complex and non-uniform effects in separating populations among unrelated taxa (Soltis et al. 2006). The identification or corroboration of mutual genetic breaks is usually conducted in organisms only in particular areas of North America (e.g., east or west of the Continental Divide, the southwestern United States, and southeastern United States) and not across the entire continent. Peninsular Florida also provides another example in which distinct and endemic lineages of snakes are found, including Coluber constrictor, Thamnophis sirtalis, and Agkistrodon piscivorus (Burbrink et al. 2008; Guiher and Burbrink 2008). These distinct lineages highlight a former barrier to gene flow that is no longer as evident as the Mississippi River. The rise in sea level during interglacial periods throughout the Pliocene and Pleistocene most likely separated continental populations from those occurring on isolated highland islands in central Florida (Webb 1990; Wiens and Graham 2005). Today, the sea levels are 35 m lower, and there is a broad land connection between southern-central and northern Florida and Georgia, in contrast to the earlier periods when marine incursions separated these areas. Feldman and Spicer (2006) examined comparative phylogeographic and demographic patterns in several lizards and snakes in California: Contia tenuis, Diadophis punctatus, Elgaria multicarinata, Charina bottae, and Lampropeltis zonata. They concluded that the basic deep genealogical divisions are the same spatially and temporally for all taxa at the Transverse Ranges, the Monterey Bay and Sacramento–San Joaquin Delta regions, and southern Sierra Nevada in California. Interestingly, demographic methods assessing population growth (discussed later in the chapter) suggested that lineages of these species in the north have all experienced rapid population growth due to the increase of woodland habitat in Holocene.
Historical Demography The Coalescent
Inferring demographic change is another major area of study often associated with phylogeography. Although many of the statistics used for these Chapter 2 from Snakes: Ecology and Conservation, edited by Stephen J. Mullin and Richard A. Seigel, published in 2009 by Cornell University Press. This excerpt may not be reproduced in any form without permission in writing from the publisher. See www.cornellpress.cornell.edu for more information.
64
F. T. Burbrink and T. A. Castoe
analyses are connected with population genetics (King, Chapter 3), we include a brief discussion of the important methods to encourage their use in snake phylogeographic studies. The strict divisions between population genetics, phylogeography, and phylogenetics are, deservedly, becoming blurred. For the most part, we focus here on the expansion or contraction of populations of phylogeographic lineages. Modern descriptions of historical population demographics usually begin with a discussion of coalescent theory. This theory models genealogical relationships backward in time to common ancestors. This is an extension of the classic population genetics concept of neutral evolution and is an approximation of the Fisher-Wright model for large populations (Fisher 1930; Wright 1931; Kingman 1982; Emerson et al. 2001). Although coalescent theory fits well within the field of population genetics, the benefits for phylogeographers in understanding historical demographic changes in a lineage are substantial. Modeling lineage sorting in reverse time permits the researcher to examine questions relevant to populations and phylogeographic lineages, including estimates of population size, structure, selection, mutation rate, and recombination (Wakely 2007). Effective population size predicts the probability that two gene sequences will coalesce. Compared with a large population, two individual sequences drawn from a smaller population have a higher probability of sharing a more recent common ancestor (i.e., they coalesce more quickly or there are fewer substitutional differences that exist between them; Kingman 1982; Emerson et al. 2001). Therefore, the dynamics of population size over time leaves an imprint in the sequence differences among individuals and ultimately in the trees inferred from these sequences. The shapes of the trees and differences among sequences can then be used to estimate recent or ancient population growth and declines (Emerson et al. 2001; Drummond et al. 2005). When conducting coalescent or demographic analysis, it is critical to consider how limited sampling may bias the experimental results. Because these methods are dependent on the tree used and the distribution of variation across the data set, nonexhaustive sampling or uneven sampling in certain areas may substantially bias inferences. The Mismatch Distribution and Other Measures of Population of Expansion
Under an infinite-sites model (i.e., each mutation occurs at a new site), coalescent theory yields an understanding that demographic changes in a population may be evident in the amount and type of genetic variation retained in individuals (Hudson 1990; Donnelly and Tavaré 1997). The earliest studies using coalescent theory to assess population size changes relied on the effect of pairwise differences (i.e., the number of nucleotide sites Chapter 2 from Snakes: Ecology and Conservation, edited by Stephen J. Mullin and Richard A. Seigel, published in 2009 by Cornell University Press. This excerpt may not be reproduced in any form without permission in writing from the publisher. See www.cornellpress.cornell.edu for more information.
Molecular Phylogeography
65
for which alleles differ in their nucleotide state) in DNA sequences among haplotypes and the number of segregating sites (i.e., the number of sites with polymorphisms) in a population (Tajima 1989; Slatkin and Hudson 1991; Rogers and Harpending 1992; Emerson et al. 2001). These measures of pairwise differences can predict the sudden expansion of lineages using the theoretical expectations of a Poisson distribution. Population expansion should yield an unresolved phylogeny, a reduction of segregating sites, a large proportion of low-frequency mutations, or a unimodal distribution of differences (Slatkin and Hudson 1991; Rogers and Harpending 1992; Fu and Li 1993; Bertorelle and Slatkin 1995; Aris-Brosou and Excoffier 1996; Tajima 1996; Fu 1997). Effective population sizes through time directly impact coalescent times and thus influence the shapes of phylogeographic trees (Avise 2000). Therefore, different topologies with variable branch lengths (expected numbers of substitutions) are indicative of alternative population demographics (Tajima 1989; Harpending et al. 1993; Eller and Harpending 1996). For instance, clustering of older nodes through time may indicate that the phylogeographic lineage of interest grew rapidly in the past and slowed toward the present (Avise 2000). Rapid population growth often follows genetic bottlenecks and produces an unresolved star phylogeny with most of the lineage diversification occurring directly at the time of population expansion (Slatkin and Hudson 1991). One of the most widely used statistics to incorporate these measures is the mismatch distribution. The mismatch distribution examines the number of site differences among all pairs of haplotypes and provides information about spatial and historical population expansion. A histogram of these differences is plotted against an observed distribution of differences, and inferences based on the differences between the theoretical and experimental distributions yield insights into past population demographics. A unimodal mismatch distribution indicates a recent range expansion, a multimodal (including bimodal) distribution suggests diminishing or structured population sizes, and a ragged distribution reveals that the lineage was widespread (see Fig. 2.3) (Rogers and Harpending 1992; Rogers et al. 1996; Excoffier and Schneider 1999). The multimodal distribution may also indicate that the population is influenced by migration, is subdivided, or has undergone historical contraction (Marjoram and Donnelly 1994; Bertorelle and Slatkin 1995; Ray et al. 2003). The statistical significance of these distributions can be tested using the sum of squares distances (SSD) and Harpending’s raggedness index (rg; Harpending 1994) against a null distribution of recent population expansion using bootstrap replicates, as in the program Arlequin v3.0 (Excoffier et al. 2005), or Monte Carlo simulations, as in the program DnaSP 4.10.8 (Rozas et al. 2006). The R2 statistic of Ramos-Onsins and Rozas (2002) can also be used to examine population expansion and is particularly powerful when population sizes are small. Although the error estimate is generally Chapter 2 from Snakes: Ecology and Conservation, edited by Stephen J. Mullin and Richard A. Seigel, published in 2009 by Cornell University Press. This excerpt may not be reproduced in any form without permission in writing from the publisher. See www.cornellpress.cornell.edu for more information.
66
F. T. Burbrink and T. A. Castoe
Expected Observed
0.08
0.04
0.00 0
10
20
30
40
Pairwise differences
1
0.1 log(Ne) 0.01
0.001
0.0001 0.006
0.004
0.002
0
Time (subst/site)
Fig. 2.3. Estimation of population expansion through time using the mismatch distribution with tests against the expectation of growth (upper graphs) and Bayesian skyline plots (BSPs; lower graphs) for three lineages of snakes occupying similar ranges in the eastern United States from the cytochrome b gene. Ne, expected population; subst, substitutions. (a) Coluber constrictor — the unimodal mismatch distribution is not significantly different from the expectation of recent population growth; similarly, the increasing BSP toward time zero indicates that this lineage has undergone recent expansion in time.
high, the dates of population expansion can examined using the formula T = τ / 2μ, where T is time since expansion, τ is the expansion time produced in Arlequin v 3.0, and μ is the mutation rate generation time sequence length. It is important to note that the mutation rate cannot be assumed to be identical across all snake species or across genes. It is best to estimate the rates of substitution for lineages using either penalized likelihood in the software program 8S v 1.07 (Sanderson 2003) or uncorrelated relaxed Bayesian clocks (Drummond et al. 2006) in BEAST using fossils or geological calibration points to remove the effect of time from the rate. In addition, the formula for T indicates that knowledge of the generation time is known Chapter 2 from Snakes: Ecology and Conservation, edited by Stephen J. Mullin and Richard A. Seigel, published in 2009 by Cornell University Press. This excerpt may not be reproduced in any form without permission in writing from the publisher. See www.cornellpress.cornell.edu for more information.
Molecular Phylogeography
67
Expected 0.12 Observed 0.08
0.04
0.00 0
30
20
10
Pairwise differences 1
0.1
0.01 log(Ne)
0.001
0.0001 0.008
0.006
0.004
0.002
0
Time (subst/site)
Fig. 2.3 continued. (b) Pantherophis alleghaniensis — the multimodal mismatch distribution indicates this lineage does not exhibit the genetic signature of recent population expansion, but the more sensitive coalescent method using BSP indicates a constant population size through time, with a rapid expansion in nearly modern times.
and that generations do not overlap. This information may or may not be known and may also differ among populations of snakes in different environments (Fitch 1999). Population growth in each lineage can also be examined using Tajima’s (1989) D* and Fu and Li’s (1993) F* in DnaSP 4.10.8 (Rozas et al. 2006) or Arlequin (Excoffier et al. 2005). Because the results of both statistics may not separate the effects of population expansion from purifying selection (Braverman et al. 1995; Simonsen et al. 1995; Fu 1997; Fu and Li 1999; Hahn et al. 2002), it is recommended that each test for both π S (within lineage synonymous sites) and π N (within lineage nonsynonymous sites) be conducted separately (Hahn et al. 2002). If population expansion has occurred, then statistics for both π S and π N should be significantly negative. In contrast to the homogeneous effects on both types of substitutions testing Chapter 2 from Snakes: Ecology and Conservation, edited by Stephen J. Mullin and Richard A. Seigel, published in 2009 by Cornell University Press. This excerpt may not be reproduced in any form without permission in writing from the publisher. See www.cornellpress.cornell.edu for more information.
68
F. T. Burbrink and T. A. Castoe
0.25
Expected
0.20
Observed
0.15
0.10
0.05
0.00 0
20
10
30
Pairwise differences 11
0.1 0.1
log(Ne) 0.01 0.01
0.001 0.001
0.014 0 .01 4
0.012 0.01 2
0.010 0.01
0.008 0.008
0.006 0.006
0.004 0.004
0.002 0.002
0 0
Time (subst/site)
Fig. 2.3 continued. (c) Pantherophis guttatus — the unimodal mismatch distribution indicates that this lineage has undergone recent population expansion; the BSP indicates that the species exhibits constant population growth since the origin of the lineage, with a sharp population increase before time zero.
expansion, purifying selection is expected to yield significantly negative test statistics for π N only (Rand and Kann 1996; Hahn et al. 2002). Population expansion should be evident in most or all unlinked genes with rapid rates of evolution, whereas purifying selection should be evident only in one gene or closely linked genes. Bayesian Skyline Plots
Methods using pairwise differences do not easily consider populations under constant growth, nor do they provide a clear picture of growth patterns through time (Felsenstein 1992). These methods also suffer from a lack of independence of sites, which can be corrected by using a genealogical estimate (see Emerson et al. 2001 for the assumptions made by different methods). There are several methods that may incorporate genealogical Chapter 2 from Snakes: Ecology and Conservation, edited by Stephen J. Mullin and Richard A. Seigel, published in 2009 by Cornell University Press. This excerpt may not be reproduced in any form without permission in writing from the publisher. See www.cornellpress.cornell.edu for more information.
Molecular Phylogeography
69
(or phylogeographic) information to examine effective population sizes through time, including lineage through time plots (LTT) and skyline plots (Nee et al. 1995; Pybus et al. 2000); there is also the isolation with migration model (Hey and Nielsen 2004; see the example in Castoe et al. 2007b). Therefore, given a phylogeographic estimate and different slices of coalescent times though the tree, it is possible to model population sizes through time. Recent modifications to these coalescent models by Drummond et al. (2002) and Pybus et al. (2003) have provided a powerful and flexible method using MCMC methods for the joint estimation of genealogy, demographic patterns, and substitution parameters. Drummond et al. (2005) introduced a visual modification of these methods called the Bayesian skyline plot, which eliminates the prespecification of population demographic models. These models assess demographic parameters that determine whether the lineages have experienced a reduction in population size, remained constant, or undergone logistic or exponential growth. This flexibility allows us to view changes in effective population sizes through time without specifying any of the possible growth curves a priori. Currently implemented in BEAST (Drummond and Rambaut 2006), the method assesses various population demographic patterns through time using the coalescent while estimating the probability and uncertainty of tree topology. Combining the relaxed Bayesian clocks method with Bayesian skyline plots in BEAST also permits the researcher to attach an estimation of time to demographic events. Example of Population Demographic Inferences in Co-Occurring Snake Lineages
Comparative demographics is another burgeoning field of study, but is not discussed as often as comparative phylogeography. This type of research examines the population dynamics of codistributed lineages found in a similar area. These studies are capable of addressing questions relating to population growth or decline of codistributed lineages in different species. For instance, we can ask, do the codistributed lineages currently occupying formerly glaciated habitats in the United States and Canada show similar patterns of population growth due to the recent re-opening of habitable areas following glacial retreat? If they do not, then we ask, what is it about these organisms (e.g., niche) that prevents them from having similar demographic responses to the same climatic event? Although the methods used to examine population demographics are commonly used in other vertebrates, we have found few instances in which phylogeographers have applied them to snakes (Douglas et al. 2006; Castoe et al. 2007b; Burbrink et al. 2008). Here, we present two different measures of effective population size changes for geographically defined lineages of Coluber constrictor, Pantherophis guttatus, and P. alleghaniensis, all occupying similar geographic areas east of the Appalachian Mountains Chapter 2 from Snakes: Ecology and Conservation, edited by Stephen J. Mullin and Richard A. Seigel, published in 2009 by Cornell University Press. This excerpt may not be reproduced in any form without permission in writing from the publisher. See www.cornellpress.cornell.edu for more information.
70
F. T. Burbrink and T. A. Castoe
(Burbrink et al. 2000, 2008; Burbrink 2002). Two of these species, P. alleghaniensis and C. constrictor, occupy areas in formerly glaciated regions of the northeastern United States and we expect that they will show evidence of population expansion. After choosing the appropriate phylogenetic model (GTR + Γ + I) and using a relaxed exponential clock, we examined Bayesian skyline plots in BEAST v1.3 (Drummond et al. 2005; Drummond and Rambaut 2006) for each lineage using sequence data from the mtDNA gene Cytochrome b. Population growth patterns are very different for these three snakes in the eastern United States (Fig. 2.3). Coluber constrictor reveals logistic population expansion over a long period of time, whereas P. guttatus has experienced only recent and rapid expansion. In contrast, it appears that P. alleghaniensis shows a population expansion after a population crash, possibly caused by a reduction in effective population size following glacial advances. Mismatch distributions predict growth in C. constrictor and P. guttatus, but did not estimate the population crash and recovery in P. alleghaniensis. Statistical tests of the null mismatch distributions (Fig. 2.3) and Fu and Li’s F* and Tajima’s D* with significantly negative values (P < .001) also confirm this; however, they do not indicate the shape or nature of the growth curve. This example suggests that although lineages of snakes living in similar areas might show evidence of population expansion, there may be notable variation in the rate and timing of growth and possible population contraction in different lineages or species. Nested Clade Analysis
The geographic structure of haplotypes that researchers observe may be due to (1) current or historical restricted gene flow, (2) past population fragmentation, (3) range expansion, or (4) colonization. These hypotheses can be addressed simultaneously using nested clade analysis (NCA). This methodology attempts to reduce the errors that occur in inferring processes that produced phylogeographic structure by simply overlaying trees on a map (Templeton 2004). Grounded in coalescent theory, this method uses haplotype networks (rather than phylogenetic trees) as the basis to test these hypotheses. Haplotype networks are not constrained to bifurcations; instead, multifurcations are permissible and possibly better represent the actual dynamics and relationships of haplotypes than do purely bifurcating trees, especially for fine-scale phylogeographic studies (Fig. 2.4) (Panchal 2007). The estimation of minimum spanning haplotype networks using the principle of statistical parsimony with the software program TCS (Clement et al. 2000) is the first step in addressing these hypotheses; note that this statistical parsimony approach is very distinct from standard MP (see Templeton et al. 1995). Second, these networks must be nested by grouping haplotypes into clades by the number of mutational differences (or steps) from the lowest (haplotypes or 0 step clades at the tips of the network) to highest (internal Chapter 2 from Snakes: Ecology and Conservation, edited by Stephen J. Mullin and Richard A. Seigel, published in 2009 by Cornell University Press. This excerpt may not be reproduced in any form without permission in writing from the publisher. See www.cornellpress.cornell.edu for more information.
4-1 (Western US AZ Pinal C42
Clade)
US CA Imperial C13
1-1 2-1
3-1
USA NM Sierra C39
1-3 2-2
1-2
US AZ Pima C49
US AZ Pinal C43
US CA Riverside C81 US NM DonaAna C22 US NM Sierra C21 US NM Sierra C41 US TX JeffDavis C18
1-4
3-2 1-5
US NM Hidalgo C47
Crotalus sp, SCI
US AZ Cochise C6 US AZ Cochise C9 MEX Sonora C79
1-6 Crotalus tortugensis
2-4
US AZ Maricopa C44 US AZ Maricopa C46 US CA Riverside C82
2-3 5-1
1-7
US CA Imperial C12 1-9
MEX Sonora C75
4-2 (Eastern
1-8
US TX ElPaso C51
3-3
US AZ Maricopa C48
3-4
Clade) 1-10 2-5
MEX SLPotosi C31
US TX Zapata C71 US TX LaSalle C62
US TX Karnes C60 1-11
US TX Duval C57
1-17 US NM Socorro C40 US TX Culberson C73 US TX JeffDavis C28 US TX Stephens C53 US TX ValVerde C68
US TX Potter C65 US TX ValVerde C69
1-12 MEX Veracruz C32 2-7 1-14
3-6
2-9
1-18
US TX Goliad C58 US TX Karnes C61 US TX LaSalle C20
US TX Mason C64
1-13 MEX SLPotosi C35
2-6
US TX Garza C74 US TX Travis C66
3-5
US TX Dallas C72 US NM Grant C7 US NM Hildalgo C5
1-15
US TX Llano C63
1-19
Mex Zacatecas C33 US AZ Cochise C38
2-8
US TX JeffDavis C52 1-20
2-10
Fig. 2.4. Phylogeographic analysis of Crotalus atrox in the southwestern United States and Mexico using nested clade analysis. (Nested clade analysis adapted from Castoe et al. 2007b, with permission of Molecular Phylogenetics and Evolution [Elsevier]) (a) Grouped haplotype network showing the geographic distribution of clades (see Castoe et al. 2007 for more demographic and dichotomous key interpretations of this network)
Chapter 2 from Snakes: Ecology and Conservation, edited by Stephen J. Mullin and Richard A. Seigel, published in 2009 by Cornell University Press. This excerpt may not be reproduced in any form without permission in writing from the publisher. See www.cornellpress.cornell.edu for more information.
72
F. T. Burbrink and T. A. Castoe
Fig. 2.4 continued. (b) Geographic range of grouped haplotype networks shown in (a).
clades). This process is continued until all clades have been hierarchically joined and the highest nesting levels represent those with the greatest genetic distances, which will include all haplotypes in the form of an entire network. The clades or haplotypes at the tips of the network are assumed to be younger than those in the interior (Castelloe and Templeton 1994); thus, NCA relies on a relative temporal relationship between tips and interiors. The spatial distribution of the haplotypes and clades are quantified using two measures of distance: the geographic distance and the nested distance (Templeton et al. 1995; Templeton 2004). The geographic distance (Dc) measures how far a single individual with a given haplotype is located from the geographic center of all individuals with this haplotype. The nested measure of the distance (Dn) indicates how far away a haplotype or clade is located from those in which it is nested into the next higher hierarchical level. That is, this essentially measures how far away a single haplotype sampled from the clade of interest is from the center of the next hierarchically nested clade. Inferences based on the statistical significance of these distance measures against random distance distributions permit inferences about restricted gene flow, past fragmentation, range expansion, or colonization in reference to any particular clade. Contrasting Dc and Dn between tip and interior clades provides evidence for population or lineage structuring and gene flow (Templeton 1998). Posada et al. (2000; http://darwin.uvigo.es /software/geodis.html) provided a key to guide the interpretation of these phylogeographical inferences based on statistical tests comparing different distance measures estimated in the program GEODIS.
Chapter 2 from Snakes: Ecology and Conservation, edited by Stephen J. Mullin and Richard A. Seigel, published in 2009 by Cornell University Press. This excerpt may not be reproduced in any form without permission in writing from the publisher. See www.cornellpress.cornell.edu for more information.
Molecular Phylogeography
73
This updated key also determines where haplotype information is lacking and when inferences cannot be satisfactorily made. The use of NCA in snake phylogeography is uncommon (Creer et al. 2001; Castoe et al. 2007b), possibly because NCA was, until recently, quite laborious and required substantial manual annotation of the haplotype network structure. Thankfully, Panchal (2007) provided a fully automated program to perform NCA and interpret the phylogeographic and demographic patterns. Criticisms of NCA suggest that the method cannot effectively distinguish between historical and current gene-flow processes responsible for the creation of simulated data (Knowles and Maddison 2002). High falsepositive rates with respect to concluding isolation by distance or restricted gene flow for a clade are, however, possible (Panchal 2007). The soundest approach to using NCA is to cross-validate inferences obtained using the other coalescent and demographic approaches already described (Knowles and Maddison 2002; Castoe et al. 2007b). For an example of NCA used to examine phylogeographic structure in snakes, we turn to the phylogeographic research on Crotalus atrox (Castoe et al. 2007b) (see Fig. 2.4). Their results demonstrated that this species is composed of two major lineages (eastern and western) separated in the southwestern United States by the Continental Divide. These primary divisions apparently occurred during the mid to late Pliocene, as inferred from an approximation of the mutation rate at 1.4% divergence per million years for the gene ND4. This major split in the southwestern U.S. deserts is geographically concordant with divisions found in other squamates (Ashton and de Queiroz 2001; Leaché and Reeder 2002; Leaché and McGuire 2006). Within the western clade, the authors discovered two well-resolved lineages, 3-1 + 3-2 and 3-3. The former is predominantly distributed in the central and western Sonoran Desert and the latter is found in California, New Mexico, and western Texas. The western clade most likely existed in Pleistocene refugia in the Sonoran Desert, with NCA inferring restricted gene flow and isolation by distance for this clade. However, clade 3-2 in the western lineage may have undergone recent population expansion from a refugium, as predicted by NCA. The NCA results also appear to be validated by the unimodal mismatch distribution and significantly negative Fu’s F* value, and by coalescent analyses using the isolation with migration model (Hey and Nielsen 2004). The clade east of the continental divide occupies an area approximately five times the size of the western clade and is structured into three smaller geographic clades (3-4, 3-5, 3-6; see Fig. 2.4). The NCA results indicate that one of the smaller clades (3-4) may have undergone a recent range expansion, as confirmed by the mismatch distribution and negative Fu’s F* value. Clades 3-4 and 3-5 may also have shared a common refugium in the Mapimian subregion of the Chihuahuan Desert (Castoe et al. 2007b).
Chapter 2 from Snakes: Ecology and Conservation, edited by Stephen J. Mullin and Richard A. Seigel, published in 2009 by Cornell University Press. This excerpt may not be reproduced in any form without permission in writing from the publisher. See www.cornellpress.cornell.edu for more information.
74
F. T. Burbrink and T. A. Castoe
The Present and Future of Snake Phylogeography
One prevalent theme that has emerged from snake phylogeographic research is that species- and, especially, subspecies-level taxonomies can be poor indicators of phylogeographic and phylogenetic groups. In many cases, in both temperate species (Rodríguez-Robles and de Jesús-Escobar 1999; Burbrink et al. 2000, 2008; Burbrink 2002; Fontanella et al. 2008) and tropical species (Wüster et al. 2002, 2005a; Castoe et al. 2003, 2005, 2008), phylogeographic studies have often discovered substantial genetic diversity and structure below the level of the recognized species, much of which is not concordant with subspecific taxonomy. The genetic divergence among lineages in a single species is extremely large (e.g., 10–13% uncorrected in lineages of C. constrictor and the P. obsoletus complex) and possibly greater than the divergence of many recognized species of other vertebrate clades. Many authors have suggested that most recognized species examined phylogeographically comprise fairly ancient radiations of related evolutionary lineages; thus, most species contain multiple evolutionary lineages that diverged from one another millions of years ago. For instance, using a Bayesian relaxed clock method (i.e., relaxed phylogenetics) Burbrink et al. (2008) found that lineage diversification at various geographic boundaries began in the late Miocene and early Pliocene for C. constrictor. These findings beg the question, are any single-species groups with such large and ancient geographically separated lineages actually a single species comprising shallow evolutionary diversity? It would also appear that, relative to their genetic diversity, many single species of snakes are quite conserved morphologically (i.e., these ancient lineages have no obvious morphological differences). An obvious general conclusion from previous snake phylogeographic studies is that the same geographic barriers have effected the diversification of lineages in multiple species of snakes, in similar ways in some cases. At this time, there is insufficient information currently to assess (or predict) the degree to which multiple species may have been historically affected by the same geographic, tectonic, or physiographic boundaries. As discussed earlier, several barriers (e.g., the Mississippi River) have produced the same patterns of genetic discordance in unrelated taxa with different habitat requirements (Burbrink et al. 2000, 2008). However, barriers to gene flow in some snakes may have no effect in other species. Given the diversity of habitat requirements, life history traits, and population sizes, we should expect that non-uniform responses through time would occur at these barriers (Fontanella et al. 2008; Guiher and Burbrink 2008), and future research to test such historical responses to common barriers is needed. Similarly, historical demographic fluctuations due to changes in glacial cycles (or other habitat modifications) have been reported in several species. Major trends observed include population crashes (although not always) at glacial maxima and population expansions at glacial minima. Some lineages Chapter 2 from Snakes: Ecology and Conservation, edited by Stephen J. Mullin and Richard A. Seigel, published in 2009 by Cornell University Press. This excerpt may not be reproduced in any form without permission in writing from the publisher. See www.cornellpress.cornell.edu for more information.
Molecular Phylogeography
75
of Agkistrodon contortrix, A. piscivorus, and D. punctatus in North America have the signature of an increase in effective population size following the last glacial maxima (~21,000 years ago; Fontanella et al. 2008; Guiher and Burbrink 2008). These responses are non-uniform in terms of the timing and intensity of the effective population response to glaciers. In contrast, C. constrictor has shown constant growth in populations for all lineages throughout the last half of the Pleistocene (Burbrink et al. 2008). Understanding variation in response to glaciation across diverse snake species may provide significant insights into the historical assembly and glacial impact on genetic diversity across temperate snake communities. Future Directions of Snake Phylogeography
Several major areas have yet to be explored in snake phylogeography. One major problem is that few species of snakes have been examined phylogeographically, particularly in the tropics. Although most examples used in this chapter focus on taxa found in North America, several other species of snakes have been examined phylogeographically in Europe (e.g., Malpolon monspessulanus and Hemorrhois hippocrepis, Carranzo et al. 2006; Natrix maura and N. tesselata, Guicking et al. 2002; Vipera aspis and V. berus, Ursenbacher et al. 2006), Africa (e.g., Macroprotodon abubakeri, M. brevis, and M. mauritanicus, Carranza et al. 2004; Naja nigricollis, Wüster et al. 2007), Asia (e.g., Cerberus rynchops, Alfaro et al. 2004; Deinagkistrodon acutus, Huang et al. 2007; Naja kaouthia, Wüster and Thorpe 1994; Trimeresurus stejnegeri, Malhotra and Thorpe 2004), Australia (e.g., Aipysurus laevis, Lukoschek et al. 2007; Hoplocephalus stephensii, Keogh et al. 2003; Morelia viridis, Rawlings and Donnellan 2003; Notechis ater and N. scutatus, Keogh et al. 2005; Pseudechis australis, Kuch et al. 2005), and Central and South America (e.g., Atropoides species, Castoe et al. 2003, 2008; Bothrops jararaca, Grazziotin et al. 2006; Bothrops pradoi, Puorto et al. 2001; Cerrophidion godmani, Castoe et al. 2005, 2008; Crotalus durissus, Wüster et al. 2005a, 2005b; Lachesis species, Zamudio and Greene 1997; Porthidium nasutum, Castoe et al. 2005). Many of these wide-ranging taxa are composed of geographically distinct lineages that might represent distinct and unrecognized species under a lineage species concept (de Queiroz 1998). Several major problems may have impeded the process of examining wide-ranging taxa that cross political boundaries, including the difficulty in obtaining tissues of many species due to the cryptic habits of snakes and in acquiring the legal permits and funding to do so. It is critical that more species, especially wide-ranging species, of snakes be examined phylogeographically to provide further evolutionary perspectives on snake taxonomy, conservation, and overall snake biology. It is not yet clear whether genetic barriers have caused lineages to diverge simultaneously in multiple species of snakes. With further comparative Chapter 2 from Snakes: Ecology and Conservation, edited by Stephen J. Mullin and Richard A. Seigel, published in 2009 by Cornell University Press. This excerpt may not be reproduced in any form without permission in writing from the publisher. See www.cornellpress.cornell.edu for more information.
76
F. T. Burbrink and T. A. Castoe
phylogeographic work, it may be possible to address the question, can we summarize what types of geographic, physiographic, or historical processes have repeatedly affected the phylogeographic structure of different snake species? For example, if multiple species diverge simultaneously at the Mississippi River, then this poses the question, what is special about this time for a river that has existed prior to the origin of colubroids? On the other hand, why do certain species fail to diverge at these common barriers? Other areas of exploration related to these concepts are the importance of geographic and physiographic barriers to snake community assemblages and the extent to which phylogeographic patterns in snakes are comparable to other terrestrial animals. The lack of reliable and practical knowledge regarding the rates of molecular evolution in snake mitochondrial and nuclear genes is currently impeding snake phylogeographic research. This gap in our understanding of snake evolution complicates phylogeographic research because a broad diversity of phylogeographic analyses are probably dependent on these estimates. The extremely wide range of previous estimates of mitochondrial evolutionary rates presently precludes even an approximate understanding of what reasonable rates may be (Zamudio and Greene 1997; Wüster et al. 2002; Castoe et al. 2007b; Jiang et al. 2007). Although new flexible methods of obtaining divergence time and evolutionary rate estimates exist, these require calibration points (e.g., known dated fossils) to derive these estimates, which are typically unavailable for phylogeographic studies. Ultimately, the field will strongly benefit from future studies that clarify the rates of evolution for commonly used snake mitochondrial genes and that quantify the variance of rates across lineages. It is imperative that non-mtDNA markers be applied in future studies on snakes to corroborate, and also reinterpret, previous mtDNA-based estimates of phylogeographic structure and historical demography. In addition to identifying rapidly evolving nuclear genes for phylogeography, other markers such as microsatellites should be applied to examine population demographic history and assess levels of gene flow among mtDNA-defined phylogeographic lineages. As a demonstration of the importance of such research, Gibbs et al. (2006) found that discrete mitochondrial phylogeographic lineages of P. obsoletus appear to be freely exchanging nuclear genes in Canada. The pervasiveness of this type of scenario across different phylogeographic barriers and species is a critically important question for further research. Future studies should include the comparison of phylogeographic structures inferred using both mitochondrial and nuclear-based genetic markers in snakes. It is currently unclear how well mitochondrial phylogenetics represents the entire process of snake phylogeography, demographic history, selection, gene flow, and taxonomy. Given snake life histories that may include sex-biased dispersal in some species, mitochondrial and nuclear marker comparisons can also provide new insights into snake Chapter 2 from Snakes: Ecology and Conservation, edited by Stephen J. Mullin and Richard A. Seigel, published in 2009 by Cornell University Press. This excerpt may not be reproduced in any form without permission in writing from the publisher. See www.cornellpress.cornell.edu for more information.
Molecular Phylogeography
77
reproductive biology, and its relationship to determining phylogeographic structure and population differentiation. Along with the estimate of species trees from gene trees, snake phylogeographers should target the assessment of modes of speciation in snakes. Allopatric speciation appears to be a common mode, and it has been suggested by numerous phylogeographic studies that have demonstrated the separation of lineages at physically isolating barriers (Burbrink et al. 2000; Castoe et al. 2007b; Burbrink et al. 2008). Other types of speciation (parapatric, peripatric, or sympatric), however, have not yet been thoroughly examined with phylogeographic data. Such questions addressing speciation are becoming more common in phylogeographic studies of lizards (Morando et al. 2003; Sinclair et al. 2004; Sites and Marshall 2004; Pelligrino et al. 2005). Moreover, examining questions relevant to speciation and lineage formation can readily be aided by assessing differences in current and past niche space for these phylogeographic clades (Wiens and Graham 2005; Carstens and Knowles 2007). Ultimately, conducting sound phylogeographic research requires a clear understanding of a diverse group of fields: geology, genetics, ecology, statistics, molecular biology, and, of course, herpetology. Snake phylogeographers must simultaneously maintain an awareness of advances in tree inference, population demographics, comparative phylogeography, gene discovery, divergence dating, and niche modeling. Technological advances in these fields occur rapidly and often provide new ways of elucidating the evolutionary history of snakes. Despite these demanding requirements, some of the most intriguing questions in biology may be best addressed by phylogeographic research. By considering the evolutionary and ecological processes that occur at both the microevolutionary and macroevolutionary scales, snake phylogeographic research may provide key insights into the role that physiographic, ecological, evolutionary and genetic processes play in the establishment of biodiversity.
Acknowledgments
Drafts of this chapter benefited from constructive comments from J. Castoe, Juan Daza, A. P. Jason de Koning, S. Mullin, J. Rodríguez-Robles, R. Seigel, and E. Smith. We also thank J. Castoe for copyediting the chapter and formatting the references. We extend our gratitude to A. Pyron, S. Ruane, and T. Guiher for examining drafts of the chapter and discussing topics relevant to snake phylogeography.
Chapter 2 from Snakes: Ecology and Conservation, edited by Stephen J. Mullin and Richard A. Seigel, published in 2009 by Cornell University Press. This excerpt may not be reproduced in any form without permission in writing from the publisher. See www.cornellpress.cornell.edu for more information.