Chapter 4
Molecular Diagnosis in Hematology Dan Jones
Introduction Molecular diagnostics, including DNA- and RNA-based testing and genomics, play an increasingly important role in diagnosis and monitoring of patients. The tremendous explosion of knowledge about the molecular pathogenesis of both benign and neoplastic hematologic conditions over the last 20 years has now been translated into routine laboratory assays of high complexity. Such clinical molecular diagnostic assays, including advanced DNA sequencing, microarrays, and highly sensitive polymerase chain reaction (PCR) tests, now impact diagnosis, subclassification, minimal residual disease (MRD) monitoring, outcome prediction, and therapy selection. In this chapter, we review the basis of these molecular techniques and discuss their uses in hematology currently and in the future.
An Overview Of Molecular Biology DNA, the chromosomal material in the cell nucleus, is transcribed by polymerases to form RNA species with different functions. These include messenger RNA (mRNA) produced from each of the ∼20,000 protein coding genes, microRNAs (mIRs) transcribed from the ∼500 regulatory mIR genes, and ribosomal and transfer RNAs that are components of the ribosome and the protein biosynthesis machinery. mRNAs are then translated into proteins by the ribosome and then typically degraded quickly because of the actions of mIRs and cellular nucleases. The set of mRNAs and mIR genes that get transcribed in any particular cell is regulated by growth factor–responsive transcription factors, cell type–specific enhancer complexes, and the epigenetic state of the DNA surrounding genes as well as their scaffold histone proteins. Epigenetic modulation of DNA and histones occurs commonly through methylation and acetylation and is dynamically regulated during hematopoietic cell development and during the development of leukemias and lymphomas.1,2 Acquired (somatic) defects in one or more of these processes underlie the development of hematologic conditions (Table 4.1). In addition, inherited gene defects or normal population variations in these cellular functions lead to p redisposition to subsequent development of hematologic conditions.11,12 With improved understanding of the basic mechanisms underlying disease, therapies which target the type of molecular aberrations in hematologic conditions have increasingly been developed (Table 4.2).
Extraction of Nucleic Acids: The Starting Point for Molecular Assays Because mutations and alterations in the DNA of disease-causing genes usually lead to detectable aberrations in RNA and protein levels, a variety of analytes are available to diagnose most conditions. DNA is the most stable analyte and can be easily extracted from fresh cells, frozen cells, and formalin-fixed paraffin-embedded (FFPE) tissues. Therefore, DNA is the preferred starting material for most PCR assays and is used for DNA sequencing, for mutation detection by PCR, and for genomic microarrays. DNA is stable at room temperatures for several days, for months to years when refrigerated, and essentially indefinitely when
frozen. One exception to the stable preservation of DNA is in decalcified bone marrow trephines where the acid treatment usually fragments the DNA, often making it unsuitable for PCR and microarrays. DNA can be extracted from cells by a variety of methods, with the first step usually being disruption of the cells using a powerful protease, such as proteinase K, along with a detergent to help solubilize the cell membranes. An RNase enzyme can also be used during this step to degrade the interfering mRNA present. DNA can then be selectively isolated from this mixture using column chromatography, organic extraction of proteins followed by alcohol precipitation, or by the binding of DNA to solid substrates such as glass beads. RNA is much more labile than DNA and can be quickly degraded in unprocessed blood and bone marrow samples and in FFPE tissues. However, RNA is still the preferred substrate to detect fusion transcripts that occur in hematologic neoplasms (e.g., BCR-ABL1) and when mRNA or mIR expression analysis is needed. Most RNAs begin to degrade within two to three days of blood or bone marrow collection even if the unprocessed sample is refrigerated; RNA must be stored frozen once extracted from cells. RNA can be isolated from cells using methods similar to those described for DNA extraction above. Care must be taken during extraction to neutralize the RNA-degrading enzymes present in the environment and within the cells themselves. For most molecular assays, RNA is next converted into complementary DNA (cDNA) using reverse transcriptase as the first step in the protocol.
TAB L E 4 . 1
Defects in the Cellular Molecular Machinery Underlying Hematologic Disorders Alteration Type
Hematologic Condition(s)
Methods to Detect
Large DNA deletions DNA repeats/ insertions
Thalassemias
Southern blot, genomic assays Southern blot, genomic arrays, PCR
3
AS-PCR, DNA sequencing, arrays Methylation sequencing, methylationsensitive PCR, pyrosequencing Transcript profiling, protein expression Transcript profiling, protein expression
6,7
DNA point mutations Epigenetic regulation
Inherited cytopenias, drug response in leukemia Acute and chronic leukemias, lymphomas Bone marrow failure, myelodysplasia
Ribosomal biogenesis
Diamond Blackfan anemia
Alternate mRNA species
Coagulopathy
References
4,5
8
9
10
AS-PCR, allele-specific PCR; mRNA, messenger RNA; PCR, polymerase chain reaction.
58
72683_ch004_0058-0064.indd 58
7/16/13 10:30 AM
Chapter 4 Molecular Diagnosis in Hematology
TA B LE 4.2
Targetable Pathways Activated in Hematolymphoid Tumors
Tumor type
Genetic alteration/ mutation
Myeloid neoplasms (all )
TET2, IDH1/2, DNMT3A gene mutations
Myeloproliferative neoplasms
BCR-ABL1 fusion JAK2 kinase PM MPL receptor PM PDGFR kinase fusion KIT receptor kinase PM KIT receptor PM FLT3 receptor PM, ITD AKT1 & TCL1 activation SYK kinase activation LCK kinase fusion/mutation
Acute myeloid leukemia Lymphoma
Tumor type(s) MPNs, MDS, AML, CMML CML MPNs MPNs HES/MCD MCD
CBF-AML AML B-NHL PTCL ALL-T
Effect(s) Epigenetic regulation of transcription13 Activation of kinase or ligand- independent signaling or hypersensitivity to lower levels of growth factor14 Ligandindependent signaling15 Hypersensitivity to BCR, TCR, and growth factor signaling16–18
MPN, myeloproliferative neoplasm; MDS, myelodysplastic syndrome; AML, acute myeloid leukemia; CMML, chronic myelomonocytic leukemia; CML, chronic myelogenous leukemia; PM, point mutation; ITD, internal tandem duplication; HES, hypereosinophilic syndrome; MCD, mast cell disease; CBF, core binding factor leukemia; B-NHL, B-cell non-Hodgkin’s lymphoma; BCR, B-cell receptor; TCR, T-cell receptor; PTCL, peripheral T-cell lymphoma; ALL-T, T-cell acute lymphoblastic leukemia/lymphoma.
59
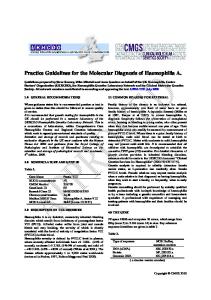
To detect the products that have been amplified by PCR, the reaction is typically run out on a solid agarose or polyacrylamide substrate or gel. These PCR amplicons can be detected by a laser using capillary electrophoresis if one of the primers has been labeled with a fluorochrome (Fig. 4.1B), or by slab gel electrophoresis followed by post-staining with a DNA-binding dye (e.g., ethidium bromide) that can be visualized with ultraviolet light (see Fig. 4.2, Step 1). As described above, if RNA is to be analyzed by PCR, it is first converted into cDNA in a technique known as RT-PCR. If fluorescent probes are added into the reaction, real-time or quantitative PCR (qPCR) can be performed to calculate the amount of an RNA or DNA target present in the initial sample. A common qPCR design is the TaqMan short, gene-specific probe that has a reporter fluorophore at its 5′ end and a quencher molecule at the 3′ end. The probe hybridizes to its target amplicon during the annealing step of each PCR cycle and is then hydrolyzed by the 5′ exonuclease activity of Taq polymerase during DNA extension. When the TaqMan probe is hydrolyzed, the reporter fluorophore is detached from the adjacent quencher molecule and fluoresces in an amount proportional to the degree of PCR product a mplification. Thus, as probe is bound to template and its reporter released by the polymerase extension, the detected fluorescence rises exponentially. In qPCR, the amount of initial target present in a PCR is backcalculated by observing the PCR cycle in which the fluorescence signal first becomes detectable. This threshold cycle (Ct) can then be used for absolute or relative quantitation. For absolute quantitation, the observed Ct is converted to a target copy number by plotting it on a standard curve (log Ct vs. starting copy number) constructed from samples with a known target copy number (Fig. 4.1C). For relative quantitation, target quantities are expressed relative to a co-amplified normalizer control (e.g., a highly expressed housekeeping gene such as ACTB [b-ACTIN] or ABL1). The quantity is then represented as a relative ratio most commonly the delta-Ct calculation: [relative quantity] = 2−(Ct of gene
Laboratory Hematology
target – Ct of reference gene).
Isolation of mIRs often requires modified extraction methods, but they can also be quantified using reverse transcriptase (RT)-PCR and may be more stable than mRNAs. More recently, clinical assays have begun to assess the cellular epigenetic state through the detection of methylated DNA, which is typically analyzed after the methylated cytosines have been converted following deamination by bisulfite treatment. Abnormalities in protein expression are commonly assessed using immunohistochemistry on fixed tissues, or blotting or immunoassays on fresh samples. A more complete view of the genome can be obtained using conventional karyotyping of chromosomes in fresh samples, or by fluorescence in situ hybridization (FISH) and genomic DNA microarrays on fresh and fixed materials. These techniques are described in more detail in Chapter 3.
Polymerase Chain Reaction: The Indispensable Molecular Technique From its first application to bacterial genetics in the early 1980s, PCR has been the central technique for amplifying genes so they can be sized to look for pathogenic insertions or deletions; sequenced to look for base pair mutations; and labeled with radioactivity, fluorochromes, or chromogenic moieties to use as probes in blots and reverse microarrays. The PCR technique involves the sequential amplification by repeated cycles of DNA denaturation, reannealing, and polymerase extension of DNA targets using flanking oligonucleotides (Fig. 4.1A). In the initial cycles of the PCR, the target is exponentially amplified before gradually plateauing when the large amount of product present tends to favor reannealing of double-stranded templates rather than primer binding/extension.
72683_ch004_0058-0064.indd 59
A specialized form of qPCR used to detect single base pair changes in DNA is allele-specific (AS)-PCR. This method compares the amplification levels of a PCR probe or primer that recognizes one allele versus the signal from a probe that recognizes only the other allele. This same protocol can also be used to sensitively detect the level of mutated sequences in neoplasms.19 This method can routinely detect the presence of a mutation down to 0.1% of the template in the sample (Fig. 4.1D).
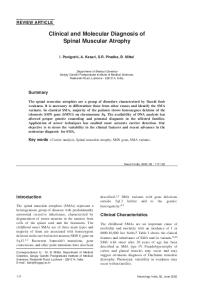
DNA Sequencing: The Technique Driving the Genomic Revolution The DNA sequence of genes is built up from combinations of four nucleotides, adenine (A), cytosine (C), guanine (G), and thymine (T), and their epigenetically modified variants, par ticularly 5-methylcytosine. DNA sequencing to determine the base composition of the genome was first routinely applied in the late 1970s but has remained a difficult and expensive technique until the last several years. The accurate but costly gold-standard technique for determining DNA base composition, developed by Frederic Sanger, is called the dideoxy chain termination method.20 After an initial PCR step to amplify the gene of interest, this method relies on a second asymmetric PCR step in which stops in the PCR extension are randomly introduced at each position in the product by adding fluorescently labeled chain terminating variants of the A, C, G, and T nucleotides, each terminating nucleotide being labeled with a different color (green, blue, black, and red). This range of DNA molecules each terminated at a different position are then separated by size using electrophoresis and the sequence read by laser detection of the terminally labeled nucleotide (Fig. 4.2).
7/16/13 10:30 AM
60
Part i Laboratory Hematology
5’ 3’
3’ 5’
5’
3’
3’
5’
5’ 5’ 3’
5’ 3’ 5’ 3’
B
∗
3’ 3’
3’ 5’ 5’
3’ 5’ 3’ 5’
∗
160
170
Patient samples C 1
Ct
0.1 0.01
Denaturation 94°C for 30 sec
0.001 0.0001
2 4 6 8 10 12 14 16 18 20 22 24 26 28 30 32 34 36 38 40 42 44
Cycles Primer annealing 55°C for 30 sec
Extension 72°C for 2 min
Standard Curve
CT
1st cycle
A
polymerase ∗F-primer R-primer DNA dNTPS
35.0 32.5 30.0 27.5 25.0 22.5 20.0
180
1 2 345 10 20 30 100 200
1000
Quantity
10000
100000
D JAK2 F wild-type
G
R
V617F mutation 167.1
T
171.2 Figure 4.1. Polymerase chain reaction (PCR). A. A three-stage conventional PCR, with denaturation, annealing, and extension steps. Components of the typical PCR are illustrated including a DNA template (e.g., target gene), unlabeled nucleotides (dNTPs), a DNA polymerase to copy the templates and forward (F) and reverse (R) DNA primers, one of which is fluorescently labeled (*). B. Fluorescent products from the above PCR are then detected by capillary electrophoresis. Shown is a trace with a normally sized 167 base pair NPM1 gene product and an abnormal copy with a 4 base pair insertion (171b) characteristic of acute myeloid leukemia. C. Quantitative PCR using the TaqMan method with four samples showing differing amounts of the target gene as indicated by Cts ranging from 23 to 39 cycles (arrows). A graph showing 10-fold dilutions of a reference sample is plotted below, which are used to convert Ct in patient sample into copy number. D. Design of a TaqMan qPCR assay for detection of the JAK2 V617F mutation, with identical F and R primers but two different fluorescent probes; the red one detecting the normal JAK2 sequence (“G” at that position), and a green probe recognizing the mutated “T” sequence. The black 3′ moiety on the probes represents the quencher dye.
Newer generations of sequencing technologies that are much faster and cheaper to perform are currently replacing the Sanger method and typically use a sequencing-by-synthesis approach. As each nucleotide is added to a growing chain of DNA by the polymerase, its incorporation is detected by release of product or by its chemical or electrochemical properties.21,22
Blotting and Array Methods An alternate method for investigating DNA sequences is solid phase hybridization, in which enzymatically-digested total genomic DNA or RNA from a cell (or specific PCR products) are size-separated using slab gel electrophoresis and then the products are transferred in place from the gel to a nylon or nitrocellulose membrane. This membrane is hybridized with a labeled DNA probe that detects the gene target. The binding of that probe is then visualized using autoradiography or colorimetric detection. In the Southern blot application, prior to electrophoresis genomic DNA is digested with one or more restriction endonucleases that cut(s) within the gene(s) of interest, so that any
72683_ch004_0058-0064.indd 60
disruption of the gene (by insertion, deletion, or recombination) is detected by an a lternately-sized banding pattern following electrophoresis and probing (Fig. 4.3). Southern blot is a labor-intensive technique which typically requires several days. For this reason, currently the principal uses of Southern blot in hematology are detecting deletions or amplifications in large genes and their enhancer control regions, such as the globin genes in thalassemia. In these applications, the size of the chromosomal area to be investigated and thus the number of DNA nucleotides to be analyzed are usually too large to be conveniently spanned by PCR and PCR-based DNA sequencing. A related blotting application is reverse hybridization, in which DNA sequences from a tumor or patient’s normal DNA are PCRamplified and then labeled and hybridized against an array of probes that have been spotted on a membrane or other matrix. These applications are widely used to detect the specific strain of a particular virus present in a sample but in hematology are mostly used for large scale cytogenetic microarray applications that are covered elsewhere in Chapter 3.
7/16/13 10:30 AM
Chapter 4 Molecular Diagnosis in Hematology
Step 2: Cycle-sequence by PCR with chain terminator fluorescent dNTPs
Target strand
3’
T
G
Labeled PCR products G
A A A CCCGA C
5’
Step 3: Detect products with capillary electrophoresis A T T T T GGG C T GG C C A A A C T G C
A T T T T GGG C T GG C C A A A C T G C
Figure 4.2. DNA Sequencing. Steps in the dideoxy chain termination (Sanger) method include: Step 1: Standard polymerase chain reaction (PCR) to produce large amounts of a genespecific template, detected by slab electrophoresis followed by ethidium bromide staining of the gel. Step 2: Unidirectional (or asymmetric) PCR using the template from the first PCR along with either a forward or reverse primer in a reaction containing normal nucleotides mixed with chain terminating A, C, G, and T bases. Step 3: The range of products from the asymmetric PCR which are terminated at every possible base in the PCR amplicon are then separated by capillary electrophoresis and detected by a laser recognizing the fluorochrome/nucleotide present at the end of products. Base-calling is performed using software which normalizes the peak heights to produce the depicted electropherogram.
Molecular Diagnostic Applications In Hematology The diagnosis of specific types of lymphoid and myeloid malignancies is discussed elsewhere in this volume, but here we summarize generally how molecular techniques are used to assist in their diagnosis. The current schema for diagnosis of hematologic neoplasms is the World Health Organization (WHO) Classification of Hematologic and Lymphoid Neoplasms.23 This classification incorporates morphology and immunophenotypic features but also increasingly relies on molecular and cytogenetic testing for definitive diagnosis.
Myeloid malignancies can be divided into myeloproliferative neoplasms (MPNs), in which the pathogenetic mutations do not significantly impair cell maturation but instead drive growth, and acute myeloid leukemia (AML) and myelodysplastic syndrome (MDS), in which maturation is impaired (see also Chapter 72). MPNs show a range of recurrent chromosomal translocations, such as the BCR-ABL1 fusion in chronic myelogenous leukemia (CML) that can be detected by RT-PCR as well as by FISH.24 In CML, levels of the BCR-ABL1 fusion transcript detected by a realtime RT-PCR method are now used to monitor the course of CML therapy with imatinib and other drugs, and to trigger a change in treatment in drug-resistant cases.25 Given the importance of this test for clinical management, significant progress has been made in standardizing both the PCR protocol26,27 and the reference materials used to calibrate the BCR-ABL1 PCR assay.28 Mutations in the tyrosine kinase JAK2 are the most commonly detected pathogenetic marker for a group of MPNs that include polycythemia vera, essential thrombocythemia, and primary myelofibrosis.29 Detection of the most common JAK2 mutation (V617F) can be done by AS-PCR, providing a highly sensitive method of monitoring disease course in JAK2-mutated MPNs (Fig. 4.1D). In AML and MDS, karyotypic findings along with hematologic parameters remain the principle determinants of diagnostic classification and outcome prediction, as codified in WHO classification and the International Prognostic Scoring System (IPSS) for MDS.23,30,31,32 Some of the chromosomal translocations that occur in AML, such as the inv(16)/t(16;16) in acute myelomonocytic leukemia and the t(15;17) in acute promyelocytic leukemias, are best monitored by RT-PCR.33,34 However, characteristic mutations, such as NPM1 duplications seen in a subset of normal diploid karyotype AML, can be detected by PCR sizing assays (Fig. 4.1B).35 Other mutations provide important prognostic information in AML, including activating insertions/duplications in the FLT3 receptor tyrosine kinase (RTK), which can be detected by PCR sizing assays; and mutations in the KIT RTK, which can be detected by DNA sequencing (Fig. 4.4A,B). Another set of genes, including TET2, IDH1, IHD2, KRAS, NRAS, EZH2, and ASXL1, are mutated in MPNs as well as AML and MDS, making a common molecular panel useful for diagnosis and risk stratification in all myeloid neoplasms.36,37
Laboratory Hematology
Molecular Diagnostics of Myeloid Neoplasms
Step 1: PCR to generate lots of target gene product
T T
61
Molecular Diagnostics in Lymphomas and Benign Lymphoid Expansions The lymphoid neoplasms were the first tumor types to have a standardized diagnostic schema based on lymphocyte maturation stage, beginning in the 1960s. The current standard for diagnosis
Isolate Genomic DNA Restriction enzyme digestion Gel electrophoresis
Transfer to membrane
Probe hybridization
�
�
�
�
72683_ch004_0058-0064.indd 61
Autoradiography reference
sample
� � � � �
Figure 4.3. Blot hybridization. Steps in the Southern blot are illustrated for a reference and patient sample. See text for additional explanation.
7/16/13 10:30 AM
62
Part i Laboratory Hematology
A 100
120
140
160
180
200
220
6400 4800 3200 1600 0 B
Defining Molecular Events in Lymphoid Neoplasms In acute lymphoid leukemia/lymphoblast lymphoma of B-cell lineage (ALL/LBL), these diagnostic changes include chromosomal fusions that can be detected by RT-PCR, FISH, or by expression microarray.40 In T-cell lineage ALL/LBL, diagnostic molecular events include mutations in the NOTCH1 gene41 and gene activation of HOX regulatory genes through the chromosomal rearrangements that juxtapose the target oncogene next to the T-cell receptor (TCR) enhancer, which selectively drives aberrant expression in the T-cell clone. The gene expression changes induced by oncogene activation can also be detected with RNA expression microarrays.42 In mature B-cell lymphomas, chromosomal translocations that juxtapose a variety of different oncogenes next to an immunoglobulin gene (Ig) enhancer (usually) are important initiating events and can be detected by PCR or FISH.43 In follicular lymphoma, Burkitt lymphoma, marginal zone lymphoma, and mantle cell lymphoma, these Ig-enhancer-driven oncogenes typically include BCL2, MYC, MALT1, and Cyclin D1/CCND1, respectively (Table 4.3). Molecular variants of these lymphomas that lack these classical translocations often activate homologous genes, e.g., the activation of Cyclin D3/CCND3 in variants of mantle cell lymphoma.44 In mature T-cell lymphomas, reciprocal chromosomal translocations are much less common, occurring generally only in classical anaplastic large cell lymphoma and T-cell prolymphocytic leukemia. In these two neoplasms, PCR, FISH, or immunohistochemistry to detect the abnormally expressed protein (ALK and TCL1, respectively) are diagnostic modalities.45 Recently, other translocations which affect signaling pathways have been identified.46 However, in other T-cell neoplasms, gene instability resulting in multiple chromosomal alteration and gene mutations, similar to that seen in poor-risk AML, is commonly seen. This finding suggests that genomic arrays may be useful diagnostic tests for these uncommon tumors.47,48
Using Polymerase Chain Reaction to Detect B-cell and T-cell Clonality One of the other key diagnostic issues in hematology is d istinguishing benign lymphoid expansions, as seen in autoimmune diseases and Figure 4.4. Detection of mutations in acute myeloid leukemia (AML). A. FLT3 duplication detected by PCR followed by capillary electrophoretic fragment analysis. B. KIT mutation (D816V) in AML is illustrated by a double peak (boxed) in the lower electropherogram present in both forward and reverse sequences, as opposed to the single wild-type peak noted in the reference unmutated sequence above. The method is dideoxy chain termination DNA sequencing, as in Figure 4.3. Images courtesy of Dr. Zhong Zhang.
TAB L E 4 . 3
Diagnostic Tests Used for the Workup of Lymphoma Test type All cases
in hematopathology, the WHO Classification of Hematologic and Lymphoid Neoplasms,23 represents an evolution and integration of the previous largely separate efforts in morphology and molecular genetics. The general principle of classification in the WHO schema and its predecessors is to map neoplasms to the maturation stage of the normal counterpart which they most resemble.38 Although this simplistic model does not account for all the observed heterogeneity in lymphomas, it has been incredibly successful in placing tumor entities in a comprehensible and easy to remember framework for diagnosis. Therefore, we summarize below how the genetic changes detected by molecular diagnostics correlate with the morphologic groups of both mature and immature B-cell and T-cell neoplasms,39 with a more detailed review provided in Chapter 87.
72683_ch004_0058-0064.indd 62
Subtyping by FISH, PCR, or IHC CLL/SLL Mantle cell lymphoma Follicular lymphoma Marginal zone lymphoma High-grade B-cell/Burkitt ALCL
• Morphologic examination • IHC or flow cytometry panel FISH for D13/del13q, del17p13/ TP53, del11q/ATM, CEP12 Cyclin D1 IHC or t(11;14)/ CCND1-IGH@ FISH BCL2/BCL6 IHC or t(14;18)/IGHBCL2 FISH t(18q21;var)/MALT1 FISH del7q FISH for splenic variants MYC; IGH@ BCL2; BCL6 FISH ALK IHC or t(2;5)/ALK-NPM1
IHC, immunohistochemistry; FISH, fluorescence in situ hybridization; PCR, polymerase chain reaction; CLL/SLL, chronic lymphocytic leukemia/small lymphocytic lymphoma; ALCL, anaplastic large cell lymphoma; ALK, anaplastic lymphoma kinase.
7/16/13 10:30 AM
∗
F
R
V
D
C
PCR step D D
D D
Capillary Electrophoresis 100 9000 8000 7000 6000 5000 4000 3000 2000 1000 0
200
240
280
140
320
One prominent band − monoclonal
infections, from clonal proliferations associated with lymphoid leukemias and lymphomas. The core methodology in making this distinction is multiparameter flow cytometry, which can determine even subtle emerging clonal expansions. However, PCR analysis of the B-cell receptor (BCR) and TCR has an important ancillary role, especially when fixed tissue specimens, which cannot be used for flow cytometry, are the only available samples. B cells arise as precursors in the bone marrow called lymphoblasts or hematogones and then migrate into the peripheral blood as long-lived naive forms, a process that is largely completed in childhood. Further maturation of B cells is dependent on recognition of an appropriate antigen that binds to a specific antibody molecule, also known as the BCR, comprised of immunoglobulin heavy chain (IGH@) and one of two types of immunoglobulin light chain (IGK@ or IGL@). Similarly, precursor T cells arise in the bone marrow and migrate to the thymus early in development, where they rearrange their TCR to produce a unique clonotypic TCR in each precursor T cell and all of its progeny. The basis of B-cell and T-cell clonality determination by PCR is that since clonal lymphoid expansions arise from a single founder cell, all cells in that expansion will share the same BCR or TCR, which has a particular size following PCR. The structure of the TCR or BCR in a precursor lymphocyte is determined by the process of VDJ recombination that occurs in the DNA during lymphocyte maturation. Due to variation in the size of the diversity (D) region between the variable (V) and joining (J) segments, all cells within a clonal B-cell proliferation will have an identically sized IGH@ gene rearrangement that can be detected by PCR (Fig. 4.5). In contrast, mixed/polyclonal non-neoplastic B-cell expansion will have IGH@ PCR products of varying sizes, giving a normal distribution of PCR products. A similar process occurs in T cells, with PCR for either the TCR-gamma or TCR-beta gene used to determine the presence of a clonal, oligoclonal, or polyclonal T-cell expansion.49 Standardized protocols for IGH@, IGK@, TCRG@, TCRB@ PCR have been developed,50,51 and these can be performed on fresh cells isolated from blood or bone marrow aspirate or from fixed tissue sections. Also, given the exquisite sensitivity of PCR, very small samples (such as minute amounts of cerebrospinal fluid) can be used to detect clonality in limited samples.
Minimal Residual Disease Testing for Leukemias and Lymphomas One of the principal benefits of real-time PCR is that it is both a highly sensitive and quantitative technique to track residual
160
Many small bands − polyclonal
disease.27,52,53 If a PCR assay can be designed to selectively amplify an initiating molecular aberration in a leukemia or lymphoma, then a highly sensitive and specific PCR assay can be designed to track disease levels over the treatment course and to monitor for relapse (Table 4.4). The mostly widely used group of these PCR assays are those to detect fusion transcripts in leukemias, including BCR-ABL1 in CML, PML-RARA in acute promyelocytic leukemia, and MLL and ETV6-RUNX1 fusions in lymphoblastic leukemia.27,54 Similarly, mutation-specific PCRs that detect only the mutant but not the wild-type base pair changes can be used when specific point mutations characterize the molecular pathogenesis of a tumor, such as JAK2 mutations in MPNs55 and FLT3 and NPM1 mutations in a subset of AML.56,57 This PCR MRD approach is limited to those mutations that occur early in the disease course, since mutations occurring later may be present only in subclones that disappear or evolve under treatment. Deep sequencing using TAB L E 4 . 4
Types of Molecular Monitoring Assays for Leukemias and Lymphomas Methodology
Examples
Fusion transcript RT-PCR (RNA)
BCR-ABL1, PML-RARA, CBFB-MYH11 RUNX1-RUNX1T1 NPM1-ALK, BIRC3-MALT1 IGH@-BCL2
Translocation detection by PCR of DNA Leukemia-associated quantitative mutation detection Leukemia-associated elevated gene expression Clone-specific IGH PCR Surrogate markers
72683_ch004_0058-0064.indd 63
J
Laboratory Hematology
Figure 4.5. Principle of B-cell and T-cell clonality assessment by polymerase chain reaction (PCR). (Top) Schematic representation of the immunoglobulin heavy chain (IGH@) gene locus following rearrangement in a B cell; the locations of primers used in IGH@ PCR are indicated by the forward (F) and reverse (R) arrows with one labeled with a fluorochrome (*). The variable region (V) segments are represented in orange, the diversity region (D) segments are represented in blue, and the joining (J) region segments are shown in pink. A unique template- independent sequence is added to the VD and DJ junctions in each individual precursor B cell during IGH@ rearrangement in the bone marrow. A similar process involving the T-cell receptor happens in a precursor T cell in the thymus. (Middle) After PCR, a monoclonal B-cell population characteristic of B-cell lymphoma shows a single predominant “clonal” VDJ amplicon of a particular size due to all the B cells being derived from a common precursor cell. Polyclonal/reactive B-cell expansions show VDJ amplicons of varying sizes derived from the range of different B cells in the population. (Bottom) The range of VDJ amplicons is visualized by running the IGH@ PCR on capillary electrophoresis. The peaks are detected using the fluorochrome-labeled PCR products run on capillary electrophoresis with the peak height proportional to the amount of PCR products of any particular size. Red peaks represent internal size standards; blue peaks are from the IGH@ PCR.
63
Chapter 4 Molecular Diagnosis in Hematology
Disease Types (References)
NPM1, FLT3
CML, AML ALL/LBL Lymphoma Follicular lymphoma52 AML56,57
BAALC, WT1
AML56
IGH@ VDJ/FR3 custom-designed primers EBV and HHV8 viral load
Lymphoblastic leukemia59 Virus-associated lymphomas
RT-PCR, reverse transcriptase polymerase chain reaction; CML, chronic myelogenous leukemia; AML, acute myeloid leukemia; ALL/LBL, acute lymphoid leukemia/lymphoblastic lymphoma of B-cell lineage; IGH, immunoglobulin heavy chain; EBV, Epstein-Barr virus; HHV, human herpesvirus.
7/16/13 10:30 AM
64
Part i Laboratory Hematology
next-generation platforms shows promise for a more comprehensive approach to the use of mutations for MRD analysis.58 Finally, highly complex, leukemia-specific MRD qPCR assays can be designed for B-cell and T-cell neoplasms which rely on designed primers based on the specific TCR or BCR expressed by a patient’s tumor.59 These types of assays, if well-designed, provide the most sensitive methods available for tracking low-levels of residual ALL/ LBL, but given their expense have not been widely implemented.
• combining single cell analysis using flow cytometry with molecular profiles to characterize normal and abnormal stem cells.62
selected References The full reference list for this chapter can be found in the online version.
Molecular Diagnosis In The Next 5 Years: The Coming Assays And Methodologies The above methodologies have evolved relatively slowly, giving practicing hematologists time to integrate these methods into the routine workups. However, the large number of new high-throughput testing methodologies that are likely to be implemented in the next few years, particularly single nucleotide polymorphism arrays and genomic sequencing identifying both germline and somatic mutations, may be more difficult to integrate into routine clinical practice. These methodologies will require integrating complex datasets to derive a treatment plan including: • interpreting how advanced sequencing panels will be used to relate diagnosis to treatment selection and a molecular monitoring strategy60; • integration of acquired and germline polymorphisms into further understanding of bone marrow failure61;
72683_ch004_0058-0064.indd 64
2. Joshi D, Gosh K, Vundinti BR. MicroRNAs in hematological malignancies: a novel approach to targeted therapy. Hematology 2012;17:170–175. 19. Gibson NJ. The use of real-time PCR methods in DNA sequence variation analysis. Clin Chim Acta 2006;363:32–47. 24. Vardiman JW, Thiele J, Arber DA, et al. The 2008 revision of the World Health Organization (WHO) classification of myeloid neoplasms and acute leukemia: rationale and important changes. Blood 2009;114:937–951. 25. Baccarani M, Castagnetti F, Gugliotta G, Palandri F, Soverini S. Response definitions and European Leukemianet Management recommendations. Best Pract Res Clin Haematol 2009;22:331–341. 27. van Dongen JJ, Macintyre EA, Gabert JA, et al. Standardized RT-PCR analysis of fusion gene transcripts from chromosome aberrations in acute leukemia for detection of minimal residual disease. Report of the BIOMED-1 Concerted Action: investigation of minimal residual disease in acute leukemia. Leukemia 1999;13:1901–1928. 29. Goldin LR, Bjorkholm M, Kristinsson SY, Samuelsson J, Landgren O. Germline and somatic JAK2 mutations and susceptibility to chronic myeloproliferative neoplasms. Genome Med 2009;1:55. 31. Greenberg PL, Tuechler H, Schanz J, et al. Revised International Prognostic Scoring System (IPSS-R) for myelodysplastic syndromes. Blood 2012;120: 2454–2465. 37. Schlegelberger B, Gohring G, Thol F, Heuser M. Update on cytogenetic and molecular changes in myelodysplastic syndromes. Leuk Lymphoma 2012;53:525–536. 42. Ferrando AA, Neuberg DS, Staunton J, et al. Gene expression signatures define novel oncogenic pathways in T cell acute lymphoblastic leukemia. Cancer Cell 2002;1:75–87. 45. Herling M, Khoury JD, Washington LT, Duvic M, Keating MJ, Jones D. A s ystematic approach to diagnosis of mature T-cell leukemias reveals heterogeneity among WHO categories. Blood 2004;104:328–335. 60. Harris TJ, McCormick F. The molecular pathology of cancer. Nat Rev Clin Oncol 2010;7:251–265.
7/16/13 10:30 AM