Module
9
� Interpreting Price Elasticity of Demand Module Objectives Students will learn in this module: • The difference between elastic and inelastic demand. • The relationship between elasticity and total revenue. • Changes in the price elasticity of demand along a demand curve. • The factors that determine price elasticity of demand.
Module Outline I. Interpreting the Price Elasticity of Demand
44
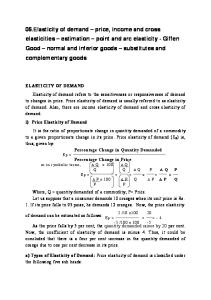
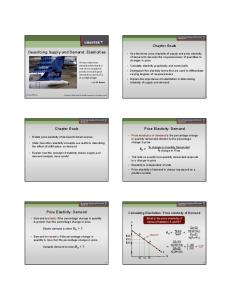
A. How elastic is elastic? 1. Definition: Demand is perfectly inelastic when the quantity demanded does not respond at all to changes in the price. When demand is perfectly inelastic, the demand curve is a vertical line. 2. Definition: Demand is perfectly elastic when any price increase will cause the quantity demanded to drop to zero. When demand is perfectly elastic, the demand curve is a horizontal line. 3. Definition: Demand is elastic if the price elasticity of demand is greater than 1, inelastic if the price elasticity of demand is less than 1, and unit-elastic if the price elasticity of demand is exactly 1. 4. Text Figure 9-2, shown on the next page, illustrates three demand curves with different numerical values to show the difference between elastic and inelastic demand.
module 9
interpreting Price elasticity of demand
Unit-Elastic Demand, Inelastic Demand, and Elastic Demand (a) Unit-Elastic Demand: Price Elasticity of Demand = 1
(b) Inelastic Demand: Price Elasticity of Demand = 0.5
Price of crossing
A 20% increase in the price . . .
Price of crossing
B
$1.10 0.90
A 20% increase in the price . . .
A
$1.10 0.90
B A
D1 D2 0
900 1,100 . . . generates a 20% decrease in the quantity of crossings demanded.
Quantity of crossings (per day)
0
950 1,050 . . . generates a 10% decrease in the quantity of crossings demanded.
(c) Elastic Demand: Price Elasticity of Demand = 2
Price of crossing
A 20% increase in the price . . .
$1.10 0.90
B A D3
0
800
1,200
. . . generates a 40% decrease in the quantity of crossings demanded.
Quantity of crossings (per day)
B. Elasticity affects total revenue. 1. Definition: Total revenue is the total value of sales of a good or service. It is equal to the price of a good multiplied by the quantity sold. 2. Except in the rare case of a good with perfectly elastic or perfectly inelastic demand, when a seller raises the price of a good, two effects are present. a. A price effect: After a price increase, each unit sold sells at a higher price, which tends to raise revenue. The price effect is the change in price times the new quantity. b. A sales effect: After a price increase, fewer units are sold, which tends to lower revenue. The sales effect is the change in quantity sold times the original price. 3. The price elasticity of demand determines which effect predominates and therefore, indicates what happens to total revenue when price changes. a. If demand for a good is elastic, an increase in the good’s price reduces total revenue; a fall in price increases total revenue. In this case, the sales effect is stronger than the price effect.
Quantity of crossings (per day)
45
46
module 9
interpreting price elasticity of demand
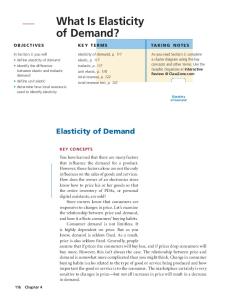
b. If demand for a good is inelastic, a higher price increases total revenue; a fall in price results in a decrease in total revenue. The price effect in this case is stronger than the sales effect. c. If demand for a good is unit-elastic, an increase or a decrease in the good’s price does not change total revenue. Here, the sales effect and the price effect exactly offset each other. 4. Total revenue is illustrated as an area below a demand curve: price times quantity sold. Price
P Total revenue D
Q
Quantity
C. Elasticity changes as you move along a linear demand curve. 1. At the top of a linear demand curve, the price elasticity of demand is elastic between two price points. As you move to the bottom of a linear demand curve, the price elasticity of demand is more inelastic. 2. At higher prices, consumers are more sensitive to a price change because the purchase represents a larger share of the budget. At lower prices, the purchase is a smaller share of the budget, and consumers are not as responsive to a price change. D. What factors determine the price elasticity of demand? 1. The availability of close substitutes a. The price elasticity of demand will tend to be high if there are close substitutes. b. The price elasticity of demand will tend to be low if there are no close substitutes. 2. Whether the good is necessary or a luxury a. The price elasticity of demand tends to be low if the good is a necessity. b. The price elasticity of demand tends to be high if the good is a luxury. 3. Time a. The long-run price elasticity of demand is often higher than the shortrun elasticity.
module 9
interpreting Price elasticity of demand
Teaching Tips Interpreting the Price Elasticity of Demand Creating Student Interest Ask students to identify some of the goods they buy that have inelastic demand. In other words, when the price of that good goes up, the student still buys about the same quantity of the good. Students will probably suggest gas and other necessities. Now ask students to name some of the goods they buy that have elastic demand. These are goods that they buy a lot less of when the price goes up. They will probably suggest different luxury goods (Starbucks coffee or meals eaten out), or perhaps expensive goods (cars and electronics). Ask them what they think happens to a firm’s total revenue when price increases. You will probably get some students who say increase, and some who say decrease. Ask them if they think it would be a good idea for the firm to increase price. The answer is, it depends on elasticity. If the firm increases price, and quantity demanded falls by a relatively small amount, then total revenue rises. Toll roads are a good example to use. If the toll increases, what happens to the toll revenue collected? Another good example is the price of an adult movie ticket. Could the theater earn more revenue by increasing the price on some tickets and decreasing the price on other tickets? The answer is yes, if the elasticity of demand is elastic for some movies and inelastic for other movies.
Presenting the Material Students usually do not have trouble understanding the difference between elastic and inelastic. Emphasize that if the percentage change in quantity demanded is greater than the percentage change in price, demand is responsive or elastic. Students find the discussion of the factors that help determine whether a good is elastic or inelastic most interesting if you pick a varied selection of goods and use these to motivate the discussion. Some goods are suggested in the table that follows. Alternatively, ask students to suggest goods they think are relatively elastic or inelastic. Product Eggs
Price elasticity of demand 0.1
Determinants of elasticity a small part of the consumer’s budget
Beef 0.4
large category: not as many substitutes as T-bone steak
Stationery
0.5
small part of the consumer’s budget
Gasoline
0.5
a necessity
Housing
1.2
a large proportion of a consumer’s budget
Restaurant meals
2.3
there are substitutes
Airline travel
2.4
there are many substitutes
Foreign travel
4.1
there are many substitutes
Once students have grasped the concept of elastic versus inelastic, you can discuss elasticity along the demand curve. Tell students that the elasticity, or price responsiveness, depends on the current price. Use a bottle of water as an example. If the price of the bottle is $1 and it increases by 10%, will there be a big change in quantity demanded?
47
48
module 9
interpreting price elasticity of demand
What if the price is $100 and it increases 10%? Since the actual change in the price is larger ($10 versus $1) at higher prices, demand will be more elastic. To get the students to understand what happens to total revenue when price changes, they will need to see a few examples. Some students will conceptually grasp the idea, some will understand the concept through the total revenue graph, and others will want to see a more specific numerical example, such as the one provided here. Price
Quantity
Total revenue
$195 205 $19,475 105
195
20,475
95
220
20,900
105
180
18,900
The example in the table has price increasing by 10% ($95 to $105 using the midpoint method), and quantity demanded either falling by 5% (205 to 195 using the midpoint method) or 20% (220 to 180 using the midpoint method). Calculate the elasticity of demand in each case (0.5 in the first case and 2.0 in the second case) and show them what happens to total revenue. Next, you can plot these data points on two different demand curves and draw the corresponding total revenue graph to show total revenue either increasing or decreasing depending on whether you are on the inelastic or elastic portion of the demand curve.
Common Student Pitfalls • Interpreting elasticity. Students often focus on the formula and calculating elasticity and may not spend time thinking about what the values mean. Make sure students understand that learning to calculate elasticities is important and will be required, but that interpreting what the values mean and seeing how elasticities figure into economic analysis is even more important. • Total revenue and elasticity. Students may confuse total revenue with profits. Clarify that revenue is the amount the firm “brings in” and is equal to P × Q. Profit is TR – TC.
Case Studies in the Text Economics in Action Responding to Your Tuition Bill—This EIA uses elasticity of demand to explain how enrollment responds to tuition changes. Ask students the following questions: 1. According to the 1988 study, a 10% increase in tuition at a four-year university would decrease enrollment by how much? (Price elasticity of demand was estimated to be .67, so a 10% increase in tuition would decrease enrollment by 6.7%. X/10 = .67 so X = 6.7). 2. What do you estimate is the price elasticity of demand for your school? (It should be near the estimates of .67 for 4-year schools and .9 for 2-year schools. Changes in the value of a college education and institutionspecific factors would change the estimate.)
module 9
interpreting Price elasticity of demand
Activities Ranking Goods by Their Price Elasticity (5–10 minutes) Pair students and put the following six goods in order of most elastic to least elastic: Salt Audi A4 car A doctor’s visit T-Bone steaks A luxury room at the Crowne Plaza hotel Electricity
The order will be close to: Audi A4 car A luxury room at the Crowne Plaza hotel T-Bone steaks Salt A doctor’s visit Electricity
Why Do Business Travelers Pay More? (3–5 minutes) Here is a concrete example to illustrate the difference between elastic and inelastic demand. The elasticity of demand for airline travel differs when we look at business travelers versus vacation travelers. Vacation travelers
Business travelers
P1 = $200
P1 = $200
P2 = $220
P2 = $220
Q1 = 10,000 tickets
Q1 = 10,000 tickets
Q2 = 8,000 tickets
Q2 = 9,500 tickets
The response of vacation travelers to an increase in the price of airline tickets from $200 to $220 results in a fall in quantity demanded from 10,000 tickets to 8,000 tickets. The same increase in price for business travelers causes the quantity demanded to fall a little; from 10,000 tickets to 9,500 tickets. Ask students to calculate the price elasticity of demand for vacation travelers and for business travelers, using the midpoint formula.
Calculating Total Revenue (5 minutes) For vacation travelers:
10,000 – 8,000 (10,000 + 8,000)/2 220 – 220 (200 + 200)/2
= 2.33
10,000 – 9,500 For business travelers:
(10,000 + 9,500)/2 220 – 220 (200 + 200)/2
= 0.54
49
50
module 9
interpreting price elasticity of demand
Use the previous example involving the demand for airline tickets to calculate the change in total revenue resulting from the price increase from $200 to $220. Have students calculate the price effect and the sales effect of the price change, and then use that information to determine if demand is elastic or inelastic. For vacation travelers: • Total revenue before the price change is: $200 × 10,000 tickets = $2 million • Total revenue after the price change is $220 × 8,000 tickets = $1.76 million • Price effect is $20 × 8,000 tickets = $160,000 • Sales effect is $200 × (–2,000 tickets) = –$400,000 • The sales effect dominates the price effect. Total revenues will fall after a price increase, so demand is price elastic. For business travelers: • Total revenue before the price change is: $200 × 10,000 tickets = $2 million • Total revenue after the price change is $220 × 9,500 tickets = $2.09 million • Price effect is $20 × 9,500 tickets = $190,000 • Sales effect is $200 × (–500 tickets) = –$100,000 • The price effect dominates the sales effect. Total revenues will rise after a price increase, so demand is price inelastic.
Determining Elasticity (3–5 minutes) Form pairs of students and ask them to calculate the percent change in quantity demanded for each of the goods on page 47 if the price of the product rises by 10%.
Web Resources The following website provides data related elasticities. The U.S. Department of Agriculture has elasticity estimates for food and commodities at http://www.ers.usda.gov/Data/Elasticities/.