Remote Sensing-Remote Sensing Systems
Multispectral, thermal and hyperspectral remote sensing
MODULE – 2 LECTURE NOTES – 4 MULTISPECTRAL, THERMAL AND HYPERSPECTEAL REMOTE SENSING 1. Introduction Multi-band imaging employs the selective sensing of the energy reflected in multiple wavelength bands in the range 0.3 to 0.9 μm. Generally broad bands are used in multi-band imaging. Multi-spectral scanners operate using the same principle, however using more number of narrower bands in a wider range varying from 0.3 to approximately 14 μm. Thus multi-spectral scanners operate in visible, near infrared (NIR), mid-infrared (MIR) and thermal infrared regions of the electro-magnetic radiation (EMR) spectrum. Thermal scanners are special types of multi-spectral scanners that operate only in the thermal portion of the EMR spectrum. Hyperspectral sensing is the recent development in the multispectral scanning, where hundreds of very narrow, contiguous spectral bands of the visible, NIR, MIR portions of the EMR spectrum are employed. This lecture gives a brief description of the multispectral remote sensing. Different types of multispectral scanners and their operation principles are covered in this lecture. The lecture also gives brief overview of the thermal and hyperspectral remote sensing. 2. Multispectral scanners A Multispectral scanner (MSS) simultaneously acquires images in multiple bands of the EMR spectrum. It is the most commonly used scanning system in remote sensing. For example the MSS onboard the first five Landsat missions were operational in 4 bands: 0.5-0.6, 0.6-0.7, 0.7-0.8, 0.8-1.1 μm. Similarly, IRS LISS-III sensors operate in four bands (0.52-0.59, 0.62-0.68, 0.77-0.86, 1.55-1.70 μm) three in the visible and NIR regions and one in the MIR region of the EMR spectrum. Spectral reflectance of the features differs in different wavelength bands. Features are identified from the image by comparing their responses over different distinct spectral bands. Broad classes, such as water and vegetation, can be easily separated using very broad wavelength ranges like visible and near-infrared. However, for more specific classes viz.,
D Nagesh Kumar, IISc, Bangalore
1
M2L4
Remote Sensing-Remote Sensing Systems
Multispectral, thermal and hyperspectral remote sensing
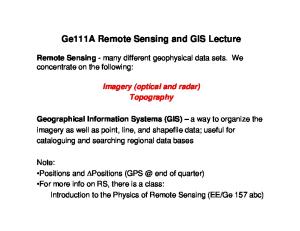
vegetation type, rock classification etc, much finer wavelength ranges and hence finer spectral resolution are required. Fig.1 shows the bands 4, 5, 6 and 7 obtained from Lansdat1 MSS and the standard FCC. Band 5 (0.6-0.7 μm)
Band 4 (0.5-0.6 μm)
Band 7 (0.8-1.1 μm)
Band 6 (0.7-0.8 μm)
Bands 456, Standard FCC
Fig.1. Landsat-1 MSS images of an area obtained in different spectral bands and the standard FCC (source: http://www.fas.org/)
D Nagesh Kumar, IISc, Bangalore
2
M2L4
Remote Sensing-Remote Sensing Systems
Multispectral, thermal and hyperspectral remote sensing
The figure clearly displays how water, vegetation and other features are displayed in different bands, and how the combination of different bands helps the feature identification. Airborne or space-borne MSS systems generate two-dimensional images of the terrain beneath the aircraft. Two different approaches are adopted for this: Across-track (whiskbroom) scanning and Along-track (push broom) scanning. 2.1 Across-track scanning Across-track scanner is also known as whisk-broom scanner. In across track scanner, rotating or oscillating mirrors are used to scan the terrain in a series of lines, called scan lines, which are at right angles to the flight line. As the aircraft or the platform moves forward, successive lines are scanned giving a series of contiguous narrow strips. Schematic representation of the operational principle of a whisk-broom scanner is shown in Fig.2.
Fig.2 Operational principle of a whisk-broom scanner (Source: www.e-education.psu.edu) The scanner thus continuously measures the energy from one side to the other side of the platform and thus a two-dimensional image is generated.
D Nagesh Kumar, IISc, Bangalore
3
M2L4
Remote Sensing-Remote Sensing Systems
Multispectral, thermal and hyperspectral remote sensing
The incoming reflected or emitted radiation is separated into several thermal and non-thermal wavelength components using a dichroic grating and a prism. An array of electro-optical detectors, each having peak spectral sensitivity in a specific wavelength band, is used to measure each wavelength band separately. 2.2 Along-track scanning Along-track scanner is also known as push-broom scanner. Along-track scanners also use the forward motion of the platform to record successive scan lines and build up a two-dimensional image, perpendicular to the flight direction. However, along-track scanner does not use any scanning mirrors, instead a linear array of detectors is used to simultaneously record the energy received from multiple ground resolution cells along the scan line. This linear array typically consists of numerous charged coupled devices (CCDs). A single array may contain more than 10,000 individual detectors. Each detector element is dedicated to record the energy in a single column as shown in Fig. 3. Also, for each spectral band, a separate linear array of detectors is used. The arrays of detectors are arranged in the focal plane of the scanner in such a way that the each scan line is viewed simultaneously by all the arrays. The array of detectors are pushed along the flight direction to scan the successive scan lines, and hence the name push-broom scanner. A twodimensional image is created by recording successive scan lines as the aircraft moves forward.
Fig. 3. Schematic representation of a Push-Broom Scanner
D Nagesh Kumar, IISc, Bangalore
4
M2L4
Remote Sensing-Remote Sensing Systems
Multispectral, thermal and hyperspectral remote sensing
(Source: http://stlab.iis.u-tokyo.ac.jp/) The linear array of detectors provides longer dwell time over each ground resolution cell, which increases the signal strength. This also increases the radiometric resolution. In a pushbroom scanner, size of the ground resolution cell is determined by the IFOV of a single detector. Thus, finer spatial and spectral resolution can be achieved without impacting radiometric resolution. 2.3 Thematic Mapper Thematic Mapper (TM) is an advanced multispectral scanner designed to achieve higher spatial, spectral and radiometric accuracy. It was introduced by NASA during the Landsat-4 mission. The TM used in the Landsat mission was operational in 7 bands. These bands are more refined compared to the MSS and are designated for some potential application. Principal applications of each of the Landsat TM bands are shown in Table below. Table 1. Landsat TM spectral bands and their potential applications (Source: http://www.fas.org) Band Spectral Principal application range (μm) Coastal water mapping, soil-vegetation differentiation, 1 0.45-0.52 deciduous-coniferous differentiation Green reflectance by healthy vegetation 2 0.52-0.6 3
0.63-0.69
Chlorophyl absorption for plant species differentiation
4
0.76-0.90
Biomass surveys, water body delineation
5
1.55-1.72
6
10.4-12.5
Vegetation moisture measurement, snow-cloud differentiation Plant heat stress measurement, other thermal mapping
7
2.08-2.35
Hydrothermal mapping
3. Thermal scanner Thermal scanner is a special kind of across track multispectral scanner which senses the energy in the thermal wavelength range of the EMR spectrum. Thermal infrared radiation refers to electromagnetic waves with wavelength 3-14 μm. The atmosphere absorbs much of the energy in the wavelength ranging from 5-8 μm. Due to the atmospheric effects, thermal scanners are generally restricted to 3-5 μm and 8-14 μm wavelength ranges. D Nagesh Kumar, IISc, Bangalore
5
M2L4
Remote Sensing-Remote Sensing Systems
Multispectral, thermal and hyperspectral remote sensing
Fig.4. EMR spectrum showing the atmospheric absorption regions (Source: http://www.geog.ucsb.edu/~jeff/115a/remote_sensing/thermal/thermalirinfo.html)
Fig. 5 shows a day time thermal image if the San-Francisco region recorded using 8.5-13.0 μm thermal wavelength region. The runway of the airport appears in light tone as the thermal emission from the runway is more in the day time.
Fig. 5. Day time thermal image (8.5-13 μm) of San Francisco (Source : http://www.geog.ucsb.edu/~jeff/115a/remote_sensing/thermal /fig6_12daytimirofsf_airport.jpg)
The Advanced Spaceborne Thermal Emission and Reflection Radiometer (ASTER) onboard Terra, TIMS developed jointly by NASA JPL and the Daedalus Corporation are some of the examples. ASTER data is used to create detailed maps of land surface temperature, reflectance, and elevation. TIMS is used as an airborne geologic remote sensing tool to
D Nagesh Kumar, IISc, Bangalore
6
M2L4
Remote Sensing-Remote Sensing Systems
Multispectral, thermal and hyperspectral remote sensing
acquire mineral signatures to discriminate minerals like silicate and carbonate. It uses 6 wavelength channels as shown in Table 2. Table 2. Spectral bands of the TIMS (Source: http://www.nasa.gov/centers/dryden/research/AirSci/ER-2/tims.html) Channel 1
Wavelength μm 8.2-8.6
2
8.6-9.0
3
9.0-9.4
4
9.4-10.2
5
10.2-11.2
6
11.2-12.2
Since the energy received at the sensor decreases as the wavelength increases, larger IFOVs are generally used in thermal sensors to ensure that enough energy reaches the detector for a reliable measurement. Therefore the spatial resolution of thermal sensors is usually fairly coarse, relative to the spatial resolution possible in the visible and reflected infrared. However, due to the relatively long wavelength, atmospheric scattering is minimal in thermal scanning. Also since the reflected solar radiation is not measured in thermal scanning, it can be operated in both day and night times. 3.1 Principle involved in the thermal sensing In thermal scanning the energy radiated from the land surface is measured using thermal sensors. The thermal emission is the portion of internal energy of surface that is transformed into radiation energy. Radiation from a blackbody and real materials A blackbody is a hypothetical, ideal radiator that totally absorbs and re-emits all energy incident upon it. Emissivity (ε) is the factor used to represent the radiant exitance of a material compared to that of a blackbody. Thus
D Nagesh Kumar, IISc, Bangalore
7
M2L4
Remote Sensing-Remote Sensing Systems
Multispectral, thermal and hyperspectral remote sensing
radiant exitance of an object at a given temperature radiant exitance of a blackbody at the same temperature
An ideal blackbody (the body which transforms all internal energy into radiation energy) has emissivity equal to 1. The emissivity of real surfaces ranges from 0 to 1. Emissivity of a material varies with the wavelength, viewing angle and temperature. If the emissivity of a material varies with wavelength, it is called a selective radiator. If a material has constant emissivity, which is less than 1, in all the wavelengths it is called a grey body. In the thermal scanning, the radiant energy from the surface is measured. According to the Stefan-Bolzmann law, the radiant exitance (M) from a black body is given by
M T4 Where, σ is the Stefan-Boltzmann’s constant = 5.6697x10⁻⁸ W m-2 K-4, T is the temperature of the black body (K) For a real material, it can be extended as
M T 4 The thermal sensors record the radiant energy M from the surface. Thus if we know the emissivity ε, we can determine the real surface temperature. But in general, in satellite remote sensing the target features are unknown and hence are their emissivities. In such cases, the brightness temperature of the surface is determined, which is the surface temperature if that were a blackbody.
Thermal imaging For the thermal energy sensing, typically quantum or photon detectors containing electrical charge carriers are used. The principle behind the thermal scanning is the direct relationship
D Nagesh Kumar, IISc, Bangalore
8
M2L4
Remote Sensing-Remote Sensing Systems
Multispectral, thermal and hyperspectral remote sensing
between the photons of radiation falling on the detector and the energy levels of the electrical charge carriers.
Fig.6. Schematic representation of a thermal sensor operational principle (Source: http://www.nrcan.gc.ca/)
Some of the commonly used detectors are mercury-doped germanium (sensitive in the range 3-14 μm), indium antimonide (sensitive in the region 3-5 μm) and mercury cadmium telluride (sensitive in the region 8-14 μm). A thermal scanner image, also known as thermogram, is a pictorial representation of the detector’s response on a line-by-line basis. Thus areas having higher radiant/brightness temperature are displayed as lighter tomes in the image. Most of the thermal scanning operations in geologic and water resources studies are qualitative in nature, wherein only the relative difference in the radiant temperature are obtained. Information about the temperature extremes, heating and the cooling rates are used to interpret the type and condition of the object, For example, water reaches maximum temperature slower than rocks or soils and therefore, terrain temperatures are normally higher than the water temperature during the day time and lower during the night. Some of the important applications of thermal remote sensing image are the following.
Geological studies: determining rock type and structures
Soil mapping
D Nagesh Kumar, IISc, Bangalore
9
M2L4
Remote Sensing-Remote Sensing Systems
Multispectral, thermal and hyperspectral remote sensing
Soil moisture studies
Study of evapotranspiration in vegetation
Detection of heat looses in buildings
Detection of damages of steam pipelines and caliducts
Detection of subsurface fires(e.g. coal seams)
4. Hyperspectral Sensors Hyperspectral sensors (also known as imaging spectrometers) are instruments that acquire images in several, narrow, contiguous spectral bands in the visible, NIR, MIR, and thermal infrared regions of the EMR spectrum. Hyperspectral sensors may be along-track or acrosstrack. A typical hyperspectral scanner records more than 100 bands and thus enables the construction of a continuous reflectance spectrum for each pixel. For example, the Hyperion sensor onboard NASA’s EO-1 satellite images the earth's surface in 220 contiguous spectral bands, covering the region from 400 nm to 2.5 μm, at a ground resolution of 30 m. The AVIRIS sensor developed by the JPL contains four spectrometers with a total of 224 individual CCD detectors (channels), each with a spectral resolution of 10 nanometers and a spatial resolution of 20 meters. Fig. 7 shows the schematic representation of the hyperspectral imaging process.
D Nagesh Kumar, IISc, Bangalore
10
M2L4
Remote Sensing-Remote Sensing Systems
Multispectral, thermal and hyperspectral remote sensing
Fig. 7. Schematic representation of the hyperspectral imaging (Source: Kruse, 2012) From the data acquired in multiple, contiguous bands, the spectral curve for any pixel can be calculated that may correspond to an extended ground feature. Depending on whether the pixel is a pure feature class or the composition of more than one feature class, the resulting plot will be either a definitive curve of a "pure" feature or a composite curve containing contributions from the several features present. Spectral curves of the pixels are compared with the existing spectral library to identify the targets. All pixels whose spectra match the target spectrum to a specified level of confidence are marked as potential targets. Hyperspectral AVIRIS image of the San Juan Valley of Colorado is shown below. Fig.8 below shows the spectral curves for different crop classes generated using the reflectance from multiple bands of the AVIRIS image. Spectral curves generated from the image are used to identify the vegetation or crop type in the circular fields and are verified with the ground data.
D Nagesh Kumar, IISc, Bangalore
11
M2L4
Remote Sensing-Remote Sensing Systems
Multispectral, thermal and hyperspectral remote sensing
Fig.8. Hyperspectral AVIRIS image of the San Juan Valley of Colorado and the spectral signature curves generated for different fields (Source : http://geoinfo.amu.edu.pl/wpk/rst/rst/Intro/Part2_24.html)
Hyperspectral imaging has wide ranging applications in mining, geology, forestry, agriculture, and environmental management. Bibliography
1. Kruse, F. A. [2012]. Mapping Surface Mineralogy Using Imaging Spectrometry, Geomorphology, v. 137, p. 41-56. Invited paper in special issue summarizing 41st International Binghamtom Geomorphology Symposium (BGS), Columbia, SC., Oct 15 17, 2010,.
D Nagesh Kumar, IISc, Bangalore
12
M2L4