MODELLING OF CALCIUM CARBONATE PRECIPITATION IN NATURAL KARST ENVIRONMENTS UNDER HYDRODYNAMIC AND CHEMICAL KINETIC CONTROL
A Thesis Presented to The Graduate Faculty of The University of Akron
In Partial Fulfillment of the Requirements for the Degree Master of Science
Brad L Justice May, 2006
MODELLING OF CALCIUM CARBONATE PRECIPITATION IN NATURAL KARST ENVIRONMENTS UNDER HYDRODYNAMIC AND CHEMICAL KINETIC CONTROL
Brad L Justice
Thesis Approved:
Accepted:
Advisor Dr. Curtis Clemons
Dean of the College Dr. Ronald F. Levant
Co-Advisor Dr. Eric Wright
Dean of the Graduate School Dr. George R. Newkome
Faculty Reader Dr. Gerald Young
Date
Department Chair Dr. Kevin Kreider
ii
ABSTRACT
Rimstone dams are barriers composed mainly of calcium carbonate deposited from solution in ground and surface waters. These structures form a subclass of travertine formations which include flowstone and stalactites, and often appear in close proximity to these features. The initial formation of rimstone dams requires some degree of cave slope, a semi-continuous flow of water, and the preexistence of irregularities in the cave floor. These dams develop at heights from a few millimeters to several meters within free-surface streams, and create a self-propagating dam and pool structure which grows upward. The genesis and evolution of rimstone dams is theorized to be the result of hydrodynamic and chemical-kinetic control. The purpose of this paper is to develop a model, the scope of which encompasses both hydrodynamics and the reactive transport, which is qualitatively consistent with observed and experimentally derived results, and method for analyzing the mechanism governing the formation of these unique rimstone features.
iii
TABLE OF CONTENTS
Page LIST OF TABLES . . . . . . . . . . . . . . . . . . . . . . . . . . . . . . . . .
vi
LIST OF FIGURES . . . . . . . . . . . . . . . . . . . . . . . . . . . . . . . .
vii
CHAPTER I.
INTRODUCTION . . . . . . . . . . . . . . . . . . . . . . . . . . . .
1
II.
CALCIUM CARBONATE PRECIPITATION MODEL . . . . . . . .
7
2.1 Hydrodynamic Model . . . . . . . . . . . . . . . . . . . . . . . . .
7
2.2 Reactive Transport Model
. . . . . . . . . . . . . . . . . . . . . .
14
III. SOLUTION PROCEDURE . . . . . . . . . . . . . . . . . . . . . . .
22
3.1 Hydrodynamics Solution Procedure . . . . . . . . . . . . . . . . .
22
3.2 Reactive Transport Solution Procedure . . . . . . . . . . . . . . .
27
3.3 Free Boundaries Solution Procedure . . . . . . . . . . . . . . . . .
41
RESULTS AND CONCLUSIONS . . . . . . . . . . . . . . . . . . . .
44
4.1 Analysis of Reactants Driving Precipitation and Dissolution . . . .
44
4.2 Interpretation of Hydro-Chemical Dynamics . . . . . . . . . . . . .
45
4.3 Conclusions . . . . . . . . . . . . . . . . . . . . . . . . . . . . . .
49
BIBLIOGRAPHY . . . . . . . . . . . . . . . . . . . . . . . . . . . . . . . . .
51
IV.
iv
APPENDICES . . . . . . . . . . . . . . . . . . . . . . . . . . . . . . . . . . .
53
APPENDIX A. HYDRODYNAMIC CALCULATIONS . . . . . . . . . .
54
APPENDIX B. REACTIVE TRANSPORT CALCULATIONS . . . . . .
56
v
LIST OF TABLES
Table
Page
3.1
Non dimensional variables . . . . . . . . . . . . . . . . . . . . . . . . .
23
3.2
Summary of Geochemical Parameters of Groundwater in Tributaries of the Mystic River, Scott Hollow Cave [1]. . . . . . . . . . . . . . . . .
31
3.3
Chemical kinetics constants and their values. M = mmol · cm−1 . . . . .
33
3.4
Values of Parameters used in the Hydrodynamics and Reactive Transport Models . . . . . . . . . . . . . . . . . . . . . . . . . . . . . .
38
Mathematically derived values for the backward reaction rate coefficients at the water- mineral surface: M = mmol · cm−3 . . . . . . . . .
41
3.5
vi
LIST OF FIGURES
Figure 1.1
Page Photograph montage of rimstone dams from Yellowstone National Park and two caves. Courtesy NPS. . . . . . . . . . . . . . . . . . . . .
6
2.1
Schematic of Dam Initiation and Formation
. . . . . . . . . . . . . . .
8
4.1
The concentration field for a film thickness of 0.002cm. . . . . . . . . .
46
4.2
Wave number k v. Growth rate σ for depth d = 0.002cm. . . . . . . . .
47
4.3
Wave number k v. Growth rate σ for depth d = 0.00225cm. . . . . . . .
47
4.4
Wave number k v. Growth rate σ for depth d = 0.0025cm. . . . . . . .
48
4.5
Wave number k v. Growth rate σ for cave floor slope of 20◦ . . . . . . .
48
vii
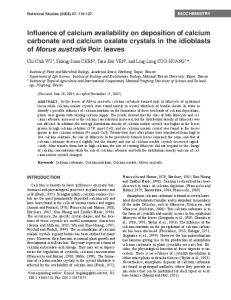
CHAPTER I INTRODUCTION Rimstone dams are barriers composed mainly of calcium carbonate deposited from solution in ground and surface waters. These structures form a subclass of travertine formations which include flowstone and stalactites, and often appear in close proximity to these features. Figure 1.1 shows the variety of environments, structures, and topological features which are inherent in rimstone dams. The initial formation of rimstone dams requires some degree of cave slope, a semi-continuous flow of water, and possibly the preexistence of irregularities in the cave floor. These dams develop at heights from a few millimeters to several meters within free-surface streams, and create a self-propagating dam and pool structure which grows upward. The genesis and evolution of rimstone dams is theorized to be the result of hydrodynamic and chemical-kinetic control. The chemically controlled processes of calcium carbonate precipitation and dissolution have been rigorously studied. These chemical processes have been carefully determined via extensive experimentalization. All such efforts are characterized by dissolved carbon dioxide from the atmosphere, transport of reactants from the solution to the mineral surface of the cave floor, and the effects of pH determining dissolution or precipitation. 1
Plummer et al. [2] pioneered investigations of this area by performing rigorous experiments on calcium carbonate dissolution and precipitation processes. The model employed was based on the surface reactions described by the experimentally derived rate law dubbed the PWP equation. This equation, assuming similar hydrodynamic conditions in the natural environment, relates chemical species, reaction mechanisms, and surface controlled kinetics to the dissolution and precipitation rates of calcium carbonate in travertine formations. Dreybrodt et al. [3] [4] [5] utilized Plummer’s studies as a catalyst for further investigation of these chemical processes. Experiments were carried out on both dissolution and precipitation of calcium carbonate. Dreybrodt constructed a model which encompassed surface controlled deposition/precipitation, diffusion of reactants in the bulk solution, and the slow conversion of CO2 to H2 CO3 . The PWP equation was utilized to describe the surface reactions. Thin film water flow over rock surfaces was approximated by plug flow with constant velocity on a flat plane of calcium carbonate for both laminar and turbulent flow characteristics. The reactants in the bulk solution were assumed to be fast in order to use mass balance laws to describe the mutual dependence of CO2 , OH− , H+ , and HCO− 3 . These studies revealed the importance of film thickness in explaining the different morphologies in the deposition of calcium carbonate. It was discovered that the model predicted a hydraulic jump from laminar to turbulent flow for sufficient water film thickness. It was theorized that this transition in flow characteristics contributed to the rate of dissolution and precipitation of calcium carbonate. 2
Chou et al. [6] was able to demonstrate that the dissolution and precipitation of many other carbonate minerals could be described by the PWP equation of Plummer et al. Later, Arakaki [7] extended the work of Plummer, Chou, and Dreybrodt to include other surface speciation at the calcium carbonate surface. This study predicted the dominant role of pH on the dissolution and precipitation. The investigation of hydrodynamic processes has been limited to observations at various sites of dam growth, and carefully derived experimental results. These efforts demonstrate observed relationships between flow characteristics, cave floor slope, and water film thickness, and their influences on rimstone dam initiation, structure, and evolution. The initiation and evolution of rimstone dams has been observed to exhibit complex dynamics since the processes of dam growth change the flow characteristics. Veni [8] observed abrupt hydrodynamic changes due to the geometry of the rimstone dam structures. The flow characteristics changed from laminar to turbulent flows once the water passed over the lips of the dam and pool structures. He also developed a model assuming uniform water chemistry, uniform water depth, and dynamics following initial calcium carbonate precipitation. This model theorized the hydraulic jump from laminar to turbulent flow and demonstrated a relationship between cave floor slope and the height and frequency of rimstone dam growth. A mathematical relationship between slope and the velocity, gravitational acceleration, and the film thickness of the water flow was utilized to assess this relationship.
3
It was found that rimstone dam height and frequency increased as the slope of the cave floor increased. Xing et al. [9] investigated hydrodynamic conditions on various rimstone dam structures. This effort is based on thin film water flows following the initial formation of rimstone dams and the effects of non-constant and semi- continuous flows characteristic of seasonal changes and the effects of rimstone dam growth on the hydrodynamics. It was observed that different flow characteristics at different locations in caves affected the geometry of rimstone dams which is indicative of the different type of structures observed in caves. It was theorized that initial formation of rimstone dams required thin film water flows and non-uniformities in the cave floor. The cave evolution and its effects on the dynamics of the water flow and subsequent changes of the structure of rimstone dams was also discussed. It was found that after initial formation of the rimstone dams, the subsequent evolution in the shape of deposits was influenced by the surface waves of the water flow which was theorized to be similar to the mechanism driving the deposition of beach sand by ocean waves. It was also found that as the cave evolved, the supply of water to the rimstone dams became constant due to the formation of the dam pool structure inherent in these deposits. Baker et al. [10] conducted a comparative study of the work of Plummer and Dreybrodt and the effects of thin film water flow. This effort theorized that the inconsistencies between theoretical growth rates and experimental growth rates of calcium carbonate deposits resulted from the non-uniformities in the cave. It was 4
also observed that growth rates were sensitive to both Ca2+ and water film thickness. The purpose of this paper is to develop a model, the scope of which encompasses both hydrodynamics and the reactive transport, which is qualitatively consistent with observed and experimentally derived results. This will be accomplished by utilizing an approach of a thin-film fluid flow approximation to the standard field equations of fluid mechanics, reactive transport of chemical species within the bulk fluid described by elementary chemical kinetics, and surface controlled kinetics driven by the reactive transport to the surface via surface reactions producing the precipitant. The hydrodynamics and the reactive transport models are coupled through the free boundaries at the air-water interface and the water-mineral interface. This paper develops a method for analyzing the mechanism governing the formation of these unique rimstone features. This effort also provides a catalyst for continuing study of geological, chemical, and physical processes which are similar. Mathematically, investigation in free boundary problems for precipitative pattern formation will be of further interest. Details of this model will contribute to an understanding of the problem of scale deposition in industrial and water distribution systems which will subsequently allow for improvement in design, maintenance, and remediation of such systems.
5
Figure 1.1: Photograph montage of rimstone dams from Yellowstone National Park and two caves. Courtesy NPS.
6
CHAPTER II CALCIUM CARBONATE PRECIPITATION MODEL This chapter is devoted to the development and interpretation of the calcium carbonate precipitation model. The following discussion develops the hydrodynamic and reactive transport systems separately. The hydrodynamics will be described by a thin-film flow approximation for the equations of fluid mechanics while reactive transport will be described by a system of advective-diffusive equations. The model is fully realized by a systematic determination of the temporal and spatial profiles of the air-water and water-mineral surfaces by coupling the shapes of these free surfaces with reactive transport and hydrodynamic mechanisms. The result is a robust model characterized by encompassing both these mechanisms.
2.1 Hydrodynamic Model Figure 2.1 is a schematic of the genesis and evolution of the calcium carbonate precipitant on the cave floor and subsequent rimstone dam formation. Let the x-axis coincide with the plane bed inclined at an angle θ with respect to the horizon, and the z-axis normal to the plane bed as depicted in Figure 2.1 Inset. The surface at the air-water interface is denoted by z = h(x, t), and the water-mineral interface is given by z = s(x, t). 7
Inset Water Source
Flowstone laminated secondary calcite deposit Water Film Flowing
λcalcit
z
e
x
Bedrock of cave floor (Limestone)
A
Calc
ite
Bedr
ock (Lim of cave eston floor e)
Water Source
z=h(
x,t)
z=s(
θ
x,t)
Dams (CaCO3 )
Water Source
Intial dams
g
Wate r
Pool Pool Pool
Bedrock of cave floor (Limestone)
Bedrock of cave floor (Limestone)
B
C Figure 2.1: Schematic of Dam Initiation and Formation
8
In the literature reviewed there is no evidence for the growth of rimstone dams beneath deep water [3]. Additionally, the lack of documented observations and an available hydro-chemical model supporting features in such an environment has yet to be established; hence, this model considers a layer of thin film flow for the initialization of rimstone dam formation. The flow must be relatively constant during periods of growth, since less flow would mean drying up, and more would coincide with increasing the water depth which is not amenable to dam growth. Due to the nature of the cave environment, temperatures remain constant. The density and viscosity are constant; thus, buoyancy driven forces due to temperature and concentration gradients are neglected. Although vorticity effects due to the flow over the dams occur, this model considers the initial formation of these features. In addition, characteristic velocities measured at various sites[3] [10] [11] support laminar flow. Lastly, the development of features transverse to the flow direction will not be considered. Therefore, the flow is characterized as two-dimensional, incompressible, viscous, and irrotational. The dynamics of the flow is described by a mass and momentum conservation law. The appropriate equation for the conservation of mass is given by the continuity equation
∂u ∂w + = 0, ∂x ∂z
(2.1)
and the Navier-Stokes equations describing the conservation of linear momentum are 9
ρ
ρ
µ
µ
∂w ∂w ∂w +u +w ∂t ∂x ∂z
∂u ∂u ∂u +u +w ∂t ∂x ∂z
∂p = ρg sin θ − +µ ∂x
µ
∂p +µ = −ρg cos θ − ∂z
∂2u ∂2u + ∂x2 ∂z 2
µ
∂2w ∂2w + ∂x2 ∂z 2
,
(2.2)
,
(2.3)
where ρ is the density of water, u and w are velocity components in the x and zdirections respectively, g is gravity, and µ is the viscosity of water. The bottom boundary is a rigid surface; hence, a no-slip condition is applied. Hence, at z = s(x, t)
u = v = 0.
(2.4)
The top surface of the fluid layer, h(x, t) is a free boundary; therefore, its position is unknown until the hydrodynamic and reactive transport systems are solved. It is necessary to specify a kinematic condition concerning its motion, and two dynamic conditions concerning the stresses acting on it. This is a material surface; hence, it must be composed of the same fluid particles. The velocity at the surface is tangential to the moving surface at all times. Let the surface be described by
F (x, z, t) = z − h(x, t).
10
(2.5)
If a fluid particle is located at ~x =< x, z > at time t, then in a small time interval dt it moves to ~x +
d~x dt or ~x + V~ dt at time t + dt, where V~ =< u, w >. Hence, the dt
new top surface is given by
F (~x + V~ dt, t + dt) = 0.
(2.6)
Performing a Taylor expansion for small dt
F (~x, t) +
µ
¶ ∂F (~x, t) ~ + V · ∇F (~x, t) dt + O(dt2 ) = 0. ∂t
(2.7)
From (2.5) the first term vanishes; hence,
∂F (~x, t) ~ + V · ∇F (~x, t) = 0 ∂t
(2.8)
in the limit dt → 0. The following kinematic condition is now arrived at by (2.5)
w=
∂h ∂h +u . ∂t ∂x
11
(2.9)
Two dynamic conditions are necessary to describe the influence of stresses on the shape of the surface. The stress-strain relation [12] is employed which is representative of this action,
P = 2µS˙ − pI,
(2.10)
where P is the stress tensor, S˙ is the strain rate dyadic, and I is the identity. In the cave environment there is no wind which generates stress in the tangential direction. This leads the to the expression (Pij nj )τi = 0,
(2.11)
for the stress in the tangential direction, where Pij is an element of the stress tensor P with the subscripts i and j representing the direction of the stress and the surface where the stress is applied respectively. The vectors n ˆ and τˆ are the normal and tangential unit vectors to the surface and are given by ¿ À ∂h − ,1 ∂x n ˆ=s µ ¶2 ∂h 1+ ∂x
and
¿ À ∂h 1, ∂x τˆ = s µ ¶2 . ∂h 1+ ∂x
The elements of the stress tensor P are defined by
12
(2.12)
P12
∂u P11 = −p + µ , ∂x ¶ µ ∂u ∂w , + = P21 = µ ∂z ∂x ∂w P22 = −p + µ . ∂z
(2.13)
Substituting these into (2.11), one finds the following stress condition
∂h 2 ∂x
µ
∂u ∂w + − ∂x ∂z
"
+ 1−
µ
∂h ∂x
¶2 # µ
∂u ∂w + ∂z ∂x
= 0.
(2.14)
The normal component of the stress balances with the surface tension and the curvature of the surface which is represented by the expression
(Pij nj)ni = σκ
(2.15)
where σ is the surface tension and ∂2h ∂x2 κ= Ã µ ¶2 !3/2 ∂h 1+ ∂x
(2.16)
is the curvature of F (~x, t). This leads to the following stress condition in the normal direction
13
−p +
"
∂u µ ∂x
µ
∂h ∂x
¶2
# µ ¶ ∂h ∂u ∂w ∂w ∂2h + − + ∂x ∂z ∂x ∂z ∂x2 = σà µ ¶2 ¶2 !3/2 . µ ∂h ∂h 1+ 1+ ∂x ∂x
(2.17)
An additional condition representative of the evolving boundary at the water-mineral interface, z = s(x, t), is needed. However, the dynamics of this surface are chemically driven; thus, details of this condition are delayed until the discussion of the reactive transport model is developed.
2.2 Reactive Transport Model The fluid is open to the atmosphere and is assumed to contain the basic constituents of the calcium carbonate reaction system. The reaction system is based on dissolved carbon dioxide and consists of six chemical species that participate in five simultaneous chemical reactions,
14
k1
CO2 + H2 O
H2 CO3
k−1 k2
CO2 + H2 O
H+ + HCO− 3
k−2 k3
CO2 + OH
−
HCO3
(2.18)
k−3 k4
H2 CO3
H+ + HCO− 3
k−4 k5
HCO− 3
H+ + CO2− 3
k−5
where ki and k−i are the forward and backward reaction rate coefficients respectfully for the ith reaction. This is a common reaction system in natural waters, and serves as a natural pH buffer [13]. The following variables are defined with molar concentrations with units 2− + mmol · cm−3 : c1 = [CO2 ], c2 = [H2 CO3 ], c3 = [HCO− 3 ], c4 = [CO3 ], c5 = [H ],
and c6 = [OH− ]. Assuming elementary reaction dynamics one obtains the following rate laws for each reaction,
15
I1 = −k1 [CO2 ] + k−1 [H2 CO3 ]
= −k1 c1 + k−1 c2
I2 = −k2 [CO2 ] + k−2 [H+ ][HCO− 3]
= −k2 c1 + k−2 c3 c5
I3 = −k3 [CO2 ][OH− ] + k−3 [HCO− 3]
= −k3 c1 c6 + k−3 c3
(2.19)
I4 = −k4 [H2 CO3 ] + k−4 [H+ ][HCO− 3 ] = −k4 c2 + k−4 c3 c5 2− + I5 = −k5 [HCO− 3 ] + k−5 [H ][CO3 ]
= −k5 c3 + k−5 c4 c5 .
Hence, the net rate laws for each species are given by
P1 = I1 + I2 + I3 P2 = −I1 + I4 P3 = −I2 − I3 − I4 + I5
(2.20)
P4 = −I5 P5 = −I2 − I4 − I5 P6 = I3 .
Explicitly rewriting I1 through I5 in terms of the concentration variables, the model equations for the carbonate system become:
16
∂c1 ∂c1 ∂c1 = D 1 ∇2 c 1 − u −w + (−k1 c1 + k−1 c2 ) ∂t ∂x ∂z + (−k2 c1 + k−2 c3 c5 ) + (−k3 c1 c6 + k−3 c3 ) ∂c2 ∂c2 ∂c2 = D 2 ∇2 c 2 − u −w − (−k1 c1 + k−1 c2 ) ∂t ∂x ∂z + (−k4 c2 + k−4 c3 c5 ) ∂c3 ∂c3 ∂c3 = D 3 ∇2 c 3 − u −w − (−k2 c1 + k−2 c3 c5 ) ∂t ∂x ∂z − (−k3 c1 c6 + k−3 c3 ) − (−k4 c2 + k−4 c3 c5 ) + (−k5 c3 + k−5 c4 c5 )
(2.21)
∂c4 ∂c4 ∂c4 = D 4 ∇2 c 4 − u −w − (−k5 c3 + k−5 c4 c5 ) ∂t ∂x ∂z ∂c5 ∂c5 ∂c5 = D 5 ∇2 c 5 − u −w − (−k2 c1 + k−2 c3 c5 ) ∂t ∂x ∂z − (−k4 c2 + k−4 c3 c5 ) − (−k5 c3 + k−5 c4 c5 ) ∂c6 ∂c6 ∂c6 = D 6 ∇2 c 6 − u −w − (−k3 c1 c6 + k−3 c3 ). ∂t ∂x ∂z
Here, Di is the mass diffusivity of the ith chemical species. The only other species which is being traced is Ca2+ . This ion does not participate in any of the bulk reactions, but appears only in the surface reactions at the cave floor which are imposed as boundary conditions. Although calcium complexes do form in the bulk fluid, this approach is sufficient as a point of initiation. Hence, in the bulk fluid, Ca2+ is a nonreactive tracer. Let c7 = [Ca2+ ], then
∂c7 ∂c7 ∂c7 = D 7 ∇2 c 7 − u −w . ∂t ∂x ∂z 17
(2.22)
Each transport equation for the reactants (2.21) requires boundary conditions at each interface. At the air-fluid interface, z = h(x, t), two types of conditions are necessary. First, CO2 is a volatile gas, thus it may undergo degassing at this interface. So for c1 the boundary condition is
c1 = kH PCO2 ,
(2.23)
where kH is the Henry’s constant and PCO2 is the partial pressure of carbon dioxide as per Henry’s Law. All other species are non-volatile and satisfy no flux conditions
(∇ci ) · n ˆ=0
where
µ
¶ ∂h − ,1 ∂x n ˆ=s µ ¶2 . ∂h 1+ ∂x
(2.24)
At the fluid-mineral interface, z = s(x, t), reactants may leave the fluid via surface reactions; in particular, reactants in the bulk and the calcium ions form the calcium carbonate precipitant. Three reactions govern the precipitation and dissolution of calcium carbonate at this interface [13]:
18
κ1
CaCO3 (s) + H+
Ca2+ + HCO− 3
κ−1 κ2
CaCO3 (s) + H2 CO3
Ca2+ + 2HCO− 3
(2.25)
κ−2 κ3
CaCO3 (s) + H2 O
− Ca2+ + HCO− 3 + OH
κ−3
where κi and κ−i are the forward and backward reaction rate coefficients respectfully for the ith surface reaction. The simplest method to model the rates of these reactions is to treat each as elementary. Therefore, the rate laws are given by:
2+ J1 = −κ1 [H+ ] + κ−1 [HCO− 3 ][Ca ]
= −κ1 c5 + κ−1 c3 c7
2 2+ J2 = −κ2 [H2 CO3 ] + κ−2 [HCO− 3 ] [Ca ]
= −κ2 c2 + κ−2 c23 c7
(2.26)
− 2+ J3 = −κ3 [H2 O] + κ−3 [HCO− 3 ][OH ][Ca ] = −κ3 + κ−3 c3 c6 c7 .
Precipitation of calcium carbonate occurs for high pH which corresponds to an increase in the concentration of OH− and a decrease in the concentration of H+ which forces the rate laws J1 , J2 , and J3 positive. In the same way, these rate laws change sign, representative of calcium carbonate dissolution. This occurs when the concentration of OH− decreases and the concentration of H+ increases which is characteristic
19
of low pH waters. The effects of pH on the surface kinetics will be discussed in more detail later. The rate laws in (2.26) enable one to write the net reaction rate laws for the species c2 , c3 , c5 , c6 , and c7 at the water-mineral interface. All other rates are taken to be zero,
R1 = 0 R2 = −J2 R3 = J 1 + J 2 + J 3 R4 = 0
(2.27)
R5 = −J1 R6 = J 3 R7 = J 1 + J 2 + J 3 .
Applying these rates as forcing for flux conditions, one finds, the boundary conditions of the seven species at z = s(x, t) are given by
Dj ∇cj · n ˆ = Rj .
(2.28)
It is now possible to determine the boundary condition at the water-mineral interface for the free surface at z = s(x, t). Taking the normal velocity of the calcium carbonate front as driven by the surface reactions and subsequent deposition results in
20
∂s ρc ∂t s µ ¶2 = M c R7 , ∂s 1+ ∂x
(2.29)
where Mc and ρc are the molar mass and density of calcium carbonate respectively. The equation is a mass balance which states that the rate of increase in calcium carbonate mass is equal to the rate of loss of the chemical species due to the surface reactions. Note that R7 is a function of c2 , c3 , c5 , c6 , and c7 which in turn are functions of h(x, t) and s(x, t) through the boundary conditions. Hence, this equation is coupled with the previously determined kinematic condition (2.9) for the evolution of the top surface h(x, t). The previous mathematical discussion for the hydrodynamic and reaction transport of chemical species provides a theoretical representation of the physical system. This precipitation model embodies the hydrodynamics, chemical control, and the effect of surface reactions producing the calcium carbonate precipitant. This includes changes to the morphology of the surface, which in turn, affects the dynamics of the fluid flow.
21
CHAPTER III SOLUTION PROCEDURE This chapter consists of developing the solution procedure to the model equations from Chapter 2. A solution will be formulated first for the dynamics of the fluid flow and then the reactive transport model solution will be developed. Once these systems are known, the kinematic condition (2.9) and the equation characterizing the velocity of the calcium carbonate front (2.29) can be fully determined.
3.1 Hydrodynamics Solution Procedure The fluid equations are solved via asymptotic limits using the standard long-wavelength and lubrication theory approximations [14] [15] [16]. In this approach equations (2.1), (2.2), (2.3), (2.4), (2.14), and (2.17) are used to define solutions for the pressure p and velocities u and w. Due to the boundary conditions, the velocities will be functions of the unknown free boundaries h and s. The underlying assumption is that the wavelength of the surface waves are larger in magnitude to the depth of the film of water. Let d be the characteristic depth of the water film and λ be the characteristic wavelength of the surface waves. The scaling parameter k, called the wavenumber, is defined by k =
2πd . λ
With these
parameters a non-dimensionalization scheme can be developed. Table 3.1 summarizes 22
Table 3.1: Non dimensional variables Dimensional Variable
Scaling Non-Dimensional Variable
Longitudinal Dimension: x
d k
Transverse Dimension: z
d
ρgd2 Longitudinal Velocity: u U = µ Transverse Velocity: w Pressure: p Time: t
kU µU kd ρc d T = Mc R 7 P =
x d/k z d u U w kU p P t T
the non-dimensional variables employed. Here U , P , and T are the characteristic velocity, pressure, and time respectively. Time T is scaled to the density of calcium carbonate ρc , the molar mass of calcium carbonate Mc , and the net rate law R7 as defined by (2.27). In this way, T >> 1, so the characteristic time is on a geological scale. Applying this non-dimensionalization to the fluid dynamics governing equations one finds,
∂u ∂w + =0 ∂x ∂z
for the mass conservation equation (2.1), and
23
(3.1)
kRe
·
¸ ∂p d ∂u ∂u ∂u ∂2u ∂2u = sin(θ) − +u +w + k2 2 + 2 T U k ∂t ∂x ∂z ∂x ∂x ∂z
(3.2)
and
3
k Re
·
¸ ∂w ∂w ∂2w ∂2u ∂p d ∂w +u +w + k4 2 + k2 2 = −k cos(θ) − T U k ∂t ∂x ∂z ∂z ∂x ∂z
(3.3)
for Navier Stokes equations (2.2) and (2.3) in the x and z-directions respectively, where Re =
ρU d µ
is the Reynold’s number. The non-dimensional group
d T Uk
> 1 and k