Modelling loading and growth of long bones
by
Priti Yadav
December 2015 Technical Reports from Royal Institute of Technology Department of Mechanics SE-100 44 Stockholm, Sweden
Akademisk avhandling som med tillstånd av Kungliga Tekniska Högskolan i Stockholm framlägges till offentlig granskning för avläggande av teknologie licentiatexamen fredag den 11 december 2015 kl 10.00 i hörsal D3, Lindstedtsvägen 5, Kungliga Tekniska Högskolan, Stockholm.
© Priti Yadav 2015 Universitetsservice US-AB, Stockholm 2015
Modelling Loading and Growth of Long Bones Priti Yadav Dept. of Mechanics, Royal Institute of Technology SE-100 44 Stockholm, Sweden
Abstract The long bones grow by the process of endochondral ossification, which occurs at the growth plate. This process is regulated by biological factors and mechanical factors. The biological factors which contribute to endochondral ossification process are genes, hormones, nutrients etc. The mechanical factor is the load acting on the bone. The major forces on the bone are due to joint contact load and muscle forces, which induce stresses in the bone. Carter and Wong proposed in a theory that cyclic or intermittent octahedral shear stress promotes the bone growth and cyclic or intermittent hydrostatic compressive stress inhibits the bone growth. Previously this theory has been used to predict the morphological development of long bones, but with studies using simplified femur and growth plate models. Furthermore, the Carter and Wong theory has a limitation that it does not intrinsically incorporate the resulting growth direction. In the first study, the importance of a subject-specific growth plate over a simplified growth plate has been studied, and growth has been simulated using two different growth direction models: Femoral neck shaft deformation direction and minimum shear stress direction. This study favors the minimum shear stress growth direction model, as it is less sensitive to applied boundary condition than the femoral neck shaft deformation direction model. The second study aims to understand how different muscle groups affect the bone growth tendency. Subject-specific femur and growth plate models of able-bodied children were used. The muscle forces and associated hip contact force from specific muscle groups were applied, and neck shaft angle and femoral anteversion growth tendencies were predicted. This study indicated a tendency for reduction of neck shaft angle and femoral anteversion. Hip abductor muscle forces contribute most, and hip adductor muscle forces least, to bone growth rate. Accurate prediction of bone growth tendency and knowledge of the influence of different muscle groups on bone growth tendency may help in better treatment planning for children at risk of developing bone deformity problems.
iii
iv
Modellering av belastning och tillväxt i rörben Priti Yadav Dept. of Mechanics, Royal Institute of Technology SE-100 44 Stockholm, Sweden
Sammanfattning Människors rörben tillväxer i tillväxtzoner vid benens ändar genom en fysiologisk process som benämns endokondral benbildning. Denna regleras av både biologiska och mekaniska faktorer. De biologiska faktorerna är gener, hormoner, näring m.m., och de mekaniska faktorerna är de krafter som verkar genom benvävnaden. Det är framför allt kontaktkrafterna i lederna och musklernas dragkrafter som föranleder spänningar i benvävnaden. En teori av Carter och Wong säger att bentillväxt främjas av cykliska eller intermittenta oktahedriska skjuvspänningar, och hämmas av cykliska eller intermittenta hydrostatiska tryckspänningar. Tidigare har forskare använt teorin för att förutsäga hur ett rörbens storlek och geometri förväntas utvecklas, dock med förenklade modeller av både lårbenet och tillväxtzonerna. Dessutom kan inte teorin förutse i vilken riktning som tillväxten kan förväntas. Den första studien fokuserar på effekterna av att använda en förenklad finita element-modell av både lårben och tillväxtzoner på de beräknade trenderna i det proximala lårbenets geometri under tillväxten, genom att jämföra en förenklad modell med en individualiserad modell avseende ett friskt barn. De verkande krafterna på lårbenet beräknades med utgångspunkt i experimentella rörelseanalys-data. Dessutom har
två
modeller
för
tillväxtens
riktning jämförts:
tillväxt
i
lårbenshalsens
deformationsriktning eller i den minimala skjuvspänningens riktning. Vi anser att den minimala skjuvspänningens riktning är mera tillförlitlig eftersom den är mindre känslig för randvillkoren i finita element-analysen. Den andra studien fokuserar på hur olika muskelgrupper kan påverka bentillväxten i det proximala låbenet på olika sätt. Individualiserade finita element-modeller av tre friska barn har använts, beaktande de krafter som uppstår från olika muskelgruppers aktivering. De olika muskelgruppernas bidrag till de förväntade förändringarna i proximala lårbenets geometri analyserades. Vi visar att höftabduktorerna bidrar mest, och höftadduktorerna minst, till den förväntade minskningen i såväl lårbenshalsens vinkel som i anteversionen, d.v.s. lårbenets axiala vridningsvinkel. En tillförlitlig modell som förutsäger hur ett rörben kan förväntas ändra sin form under ett barns tillväxtperiod kan bidra till bättre planering av preventiv behandling för barn som är i riskzonen för att utveckla bendeformiteter.
v
vi
Preface This thesis studies the proximal femoral bone growth tendency by numerical modelling. The first part gives a concise background, description of methods, results, conclusion and ideas for future work. The second part of the thesis consists of the following papers: I.
Priti Yadav, Sandra J. Shefelbine, Elena M. Gutierrez-Farewik Effect of growth plate geometry and growth direction on prediction of proximal femoral morphology. Submitted.
II.
Priti Yadav, Sandra J. Shefelbine, Elena M. Gutierrez-Farewik Influence of muscle groups’ activation on proximal femoral growth tendency. Manuscript.
vii
viii
Division of work among authors This project was initiated by Dr. Elena M. Gutierrez-Farewik (EGF) who is the main supervisor of the work. Prof. Anders Eriksson (AE) and Dr. Eva Pontén (EP) have acted as co-supervisor of this work. Dr. Sandra J. Shefelbine (SJS) is a co-author in both papers. The context of the thesis was created by EGF and Priti Yadav (PY) in regular meetings, with clinical input from EP. PY has discussed the results and progress with EGF and SJS in regularly meetings. Paper 1 The experiment data was collected by EGF and PY. PY processed the data and performed the FE simulations in ANSYS with the help from EGF and SJS. The paper was written by PY with help from EGF and SJS. Paper 2 The experimental data was collected by EGF and PY. PY developed the FE model and performed the simulation in ANSYS with weekly discussion with EGF and occasional discussion with SJS. The paper was written by PY with help from EGF and SJS.
ix
x
Contents iii
Abstract
v
Sammanfattning
vii
Preface Part I Overview
1
Chapter 1 Introduction
3
1.1 Motivation and relevance
3
1.2 Longitudinal growth of long bone
4
1.3 Factors regulating longitudinal growth rate
7
1.4 Growth direction
10
1.5 Forces on the bone
11
1.6 Femoral neck shaft angle and femoral anteversion
14
1.7 Aim and scope
14
1.8 Outline of the thesis
15
Chapter 2 Methods
17
2.1 Data collection
17
2.2 Geometric model
17
2.3 Inverse dynamic analysis & static optimization
18
2.4 Finite element analysis to predict growth tendency
20
Chapter 3 Results and Discussion
23
Chapter 4 Conclusion and future work
27
4.1 Conclusion
27
4.2 Future work
27
Acknowledgements
31
References
33
Part II Paper
43
Paper 1.
Effect of growth plate geometry and growth direction on prediction of 47
proximal femoral morphology Paper 2.
Influence of muscle groups’ activation on proximal femoral growth 65
tendency
xi
Part I Overview
Priti Yadav |3
Chapter 1 Introduction 1.1 Motivation and relevance The long bones of the appendicular skeleton grow by the process of endochondral ossification. In this process, growth plate cartilage subsequently transforms into bone. The ultimate shape or morphology of the bone is defined by two control parameters: growth rate (cartilage to bone transformation rate) and growth direction (growth front moving direction). The longitudinal growth rate is sensitive to its biological and mechanical factors. The biological factors that affect the growth rate are nutrients, hormones and genetics (Gerber and Ferrara, 2000; Gkiatas et al., 2015; Provot and Schipani, 2005). However, the mechanical environment is considered as the regulator for the biological process of bone growth (Carter and Beaupré, 2001; Hamrick, 1999; Shefelbine and Carter, 2004a, 2004b; Stevens et al., 1999; Trepczik et al., 2007). The two commonly used mechanobiological theories are the Heuter-Volkmann law and the Carter and Wong theory. The Heuter-Volkmann law states that increase in static compression reduces the growth rate and, conversely, reduction in compressive loading increases the growth rate (Lerner et al., 1998; Villemure and Stokes, 2009). This law is limited to unidirectional static load only, whereas in normal human motions, bones are subjected to much more complex and multi-axial dynamic loads during growth. The Carter and Wong theory accounts for the three-dimensional stress state occurring in a growth plate (Carter et al., 1987). The theory states that endochondral growth and ossification are inhibited by cyclic or intermittent hydrostatic compressive stress and accelerated by cyclic or intermittent octahedral shear stress. The Carter and Wong theory has been used previously to predict the ossification patterns of long bones (Carter et al., 1987; Wong and Carter, 1990) and the sternum (Wong and Carter, 1988), articular cartilage thickness (Beaupre et al., 2000; Carter et al., 2004), and the appearance of osteoarthritis in the femur (Carter et al., 1987). The theory has also been used to predict the mechanical loading effect on the growth front progression like prediction of femoral anteversion (Shefelbine and Carter, 2004b), femoral condylar angle (Shefelbine et al., 2002), hip dysplasia (Shefelbine and Carter, 2004a), and influence of different gait pattern on morphological development (Carriero et al., 2011). In spite of the limitations of generic bone
4 Chapter 1. Introduction and growth plate geometry, these studies have showed that change in morphology is affected by the mechanical load acting on the bone. In has been reported that the growth plate geometry changes with age (Guevara et al., 2015; Kandzierski et al., 2012), hence it is important to consider the subject-specific bone and growth plate geometry in the simulation for better bone growth prediction. In all previous studies the growth direction has been modeled as the direction of the deformation of either the growth plate or the femoral neck shaft axis. In finite element simulation of physiological activities, it is challenging to model the correct deformation pattern due to its sensitivity to applied boundary conditions. Thus further studies are required to find an alternative for growth direction which is less sensitive to the boundary conditions in finite element simulations. Furthermore, there are number of clinical conditions of the skeleton that are theorized to result from abnormal muscle forces acting on the bone. In children with cerebral palsy, for example higher femoral anteversion is related to abnormal hip rotator muscle forces (Cibulka, 2004). Joint contact forces, which are important mechanical loads acting on the bone, are mostly due to muscles forces and associated ground reaction force (GRF). Muscles are as such a key factor influencing the construction of the ultimate bone structure. How different muscle groups contribute to bone growth or to deformity development in growing children is still not clear The work presented in this thesis is an attempt to improve upon previous findings of bone growth; models used to predict the bone growth tendency have thus far been from a generic anatomy and with simplified geometry. We also study the effects of different muscle groups on bone morphological growth tendency. The understanding of the mechanical regulation of endochondral bone growth and its sensitivity to various factors can be relevant to the prevention and treatment of children with bone deformity problems.
1.2 Longitudinal growth of long bone Long bones develop and grow in length through endochondral growth and ossification, shown in Figure 1.1 and 1.2. The process mainly includes the following stages:
Priti Yadav |5 Development of cartilage model: In early fetal life, the cartilage model is formed through the condensation of mesenchymal cells. The cartilage model grows in length by cell division of chondrocytes and secretion of typical cartilage extracellular matrix. Development of growth plate: The development of the long bone anlagen is influenced by the muscular activity in the prenatal stage. The periosteal bone collar forms against the diaphysis of cartilage model at the site of the primary ossification center. The location of the primary ossification center is in the middle of the diaphysis. The chondrocytes in the primary ossification center are stimulated to proliferate and then proceed to hypertrophy followed by matrix calcification and apoptosis. This results in the deterioration of inner cartilage and formation of a cavity within the bone. The vascular invasion of the hypertrophic cartilage forms the trabecular bone. The secondary ossification center appears after or about the time of birth in the ends of the long bones. The cartilage material between these two ossification centers (primary and secondary) is called the growth plate. The growth plate drives the expansion of primary and secondary ossification center until their fusion, which is called epiphyseal line. Longitudinal growth of long bone: the longitudinal growth of long bone occurs at the growth plate. The growth plate cartilage is histologically arranged between distinct zones, which reflect changes in the morphological and functional state of the cells. The growth plate histology is shown in Figure 1.2 and discussed below.
Reserve zone: this zone contains the resting chondrocytes (stem cells) which are small, uniform, compactly located and rich in lipid and cytoplasmic vacuoles. The stem cells play a significant role in the orientation of the underlying columns of chondrocytes and, therefore, unidirectional bone growth (Abad et al., 2002). Additionally in this zone, cells are surrounded by the abundant extracellular matrix (Melrose et al., 2008). This zone is also characterized by low rates of proliferation and proteoglycan and collagen type IIB synthesis (Eames et al., 2003; Melrose et al., 2008).
Proliferative zone: In this zone, chondrocytes are flat. These chondrocytes divide and align in longitudinal columns parallel to the direction of growth. The cells also actively store the calcium and produce the matrix.
Hypertrophy zone: in this zone, cells stop dividing and begin to increase in volume. The enlargement of hypertrophic cells contribute most to the growth rate (Cooper et al., 2013). The volumetric increase during hypertrophy is anisotropic and during
6 Chapter 1. Introduction volume increase, the cellular height increment (in the direction of growth) is more compared to the cellular width increment (Farnum et al., 2002). The hypertrophic chondrocytes are rich in calcium concentration, and that is required in the matrix production and calcification process (Gkiatas et al., 2015).
Provisional cacification zone: in this zone, mineralization begins on the longitudinal collagen fibrils of the matrix followed by rapid hydroxyapatite formation as calcification starts (Shefelbine, 2002). The chondrocytes in this mineralized zone eventually undergo programmed cell death, leaving a scaffold for new bone formation. The process by which hypertrophic chondrocytes die is still unclear (Adams and Shapiro, 2002; Roach and Clarke, 1999; Roach et al., 2004).
Figure 1.1 Schematic illustration of the development of long bones from cartilage model (embryonic) to the formation of growth plate (http://www.slideshare.net/ahoward/anatomy-and-phisology-pp)
Figure 1.2. Micrograph of proximal tibial growth plate of a rat showing the different characteristic zones (Villemure and Stokes, 2009).
Priti Yadav |7 The initial calcification which occurs in the growth plate occurs within the longitudinal septa of the matrix, also called primary spongiosum. The calcified cartilage matrix is eventually resorbed and secondary spongiosum forms. It consist of woven bone, which is eventually replaced by lamellar bone through bone remodeling. The lamellar bone has organized, parallel collagen fibers and characteristics of mature cancellous bone, thus completing the endochondral ossification process. It is estimated that during longitudinal growth (endochondral ossification) of long bones, 60% of the total growth is due to the chondrocyte hypertrophy, 10% due to cell proliferation and the remainder is due to matrix synthesis. Pritchett (1992), performed roentgen stereophotogrammetric analysis and reported that the proportion of growth occurring at each growth plate is not equal and changes with age. The proportion of growth occurring at the distal growth plate varies approximately from 60% at age of seven to 90% at around skeletal maturity.
1.3 Factors regulating longitudinal growth rate The major determinants of the longitudinal growth rate are the rate of chondrocyte proliferation, hypertrophy and matrix synthesis in the growth direction. Further, these factors are regulated by biological and mechanical factors. The specific growth (𝜀̇) rate can be defined as the linear sum of biological growth rate (𝜀̇𝑏 ) and mechanical growth rate (𝜀̇𝑚 ). About 50% to 80% of longitudinal growth of long bone occurs due to biological factors whereas the remaining is modulated by mechanical load (Germiller and Goldstein, 1997; Hall and Herring, 1990). Biological factors: The biological factors that influence bone growth are genes, hormones, and nutrients. Some of the major biological factors are mentioned and discussed here in brief:
Growth hormones: promotes the longitudinal growth in coordination with liver-deprived insulin-like growth factor -1 (IGF-1). It has been reported that growth hormones can also stimulate the longitudinal growth locally with or without IGF-1(Nilsson et al., 2005)
Oestrogen or estrogen: influences the epiphyseal fusion process or the fusion of the metaphysis and epiphysis (Smith et al., 1994). Epiphyseal fusion occurs when the proliferative potential of the chondrocytes exhausts. The mitigation of proliferative potential of chondrocytes is accelerated by estrogen (Weise et al., 2001). However, excess of estrogen can retard the longitudinal growth rate (Gkiatas et al., 2015).
8 Chapter 1. Introduction
Thyroid hormones: thyroid hormone, triiodothyronine (T3), stimulates the recruitment of chondrocytes from the reserve zone to the proliferating zone. It also affects the chondrocytes differentiation (Burch and Van Wyk, 1987; Rabier et al., 2006; Wakita et al., 1998). In childhood, hypothyroidism decelerates longitudinal growth rate of long bone, and hyperthyroidism accelerates the longitudinal growth rate and hence leads to premature growth(Rivkees et al., 1988; Robson et al., 2002; Sharan and Yadav, 2014).
Glucocorticoids: retards the growth rate by modifying the growth hormones /IGF-1 pathway at different levels (Gkiatas et al., 2015). Excess of glucocorticoids enhances bone resorption, inhibits osteoblast activity and reduces bone matrix production whereas glucocorticoids deficiency is the cause of tall stature(Lui and Baron, 2011).
Indian hedgehog (Ihh): stimulates chondrocytes proliferation and inhibits chondrocytes hypertrophy with parathyroid hormone-related peptide (PTHrP)(St-Jacques et al., 1999).
PTHrp: keeps the proliferating chondrocytes in the proliferative pool(Kronenberg and Kronenberg, 2003) and inhibits hypertrophy differentiation (Erlebacher et al., 1995).
Bone morphogenetic proteins (BMPs): promotes cell maturation and hypertrophy. The normal chondrocyte proliferation requires parallel signaling of both BMPs and Ihh, but BMPs
can
inhibit
chondrocyte
differentiation
independently
of
Ihh/PTHrP
pathway(Gkiatas et al., 2015).
Fibroblast growth factors (FGFs): FGF receptor-3 (FGFR3) inhibits chondrocytes proliferation and accelerate hypertrophy (Mackie et al., 2008).
Vascular endothelial growth factor (VEGF): contributes to the terminal differentiation of chondrocytes, vascular invasion, and chondrocyte apoptosis (Gkiatas et al., 2015).
Mechanical factors: The relation between the mechanical forces acting on the bone and bone morphology is reciprocal (Frost, 2001; Weiner and Wagner, 1998). Previous studies have suggested that mechanical load regulates the morphological development process from proliferative to hypertrophic zone (Lerner et al., 1998; Shefelbine and Carter, 2004a).The effect of mechanical load is found mostly in the hypertrophy zone for chondrocyte enlargement (Stokes et al., 2002). The mechanical load also influences the rate of proliferation (Alberty et al., 1993). In clinical science, bone deformity problems such as coxa valga, high femoral anteversion, hip luxation, Blount’s disease, and clubfoot are thought to be influenced by mechanical load acting on the bone. The major forces acting on the bone are due to the muscles and joints (forces due to the bone to bone contact). The muscle forces and
Priti Yadav |9 joint contact forces regulate the endochondral ossification and thereby bone morphological development by imposing stresses (or strains) on growing bones. The effect of mechanical forces on bone growth was first described in engineering terms by Heuter and Volkmann. Their law states that increased static compressive load parallel to the direction of growth inhibits the growth and reduced static compressive load or increased static tensile load promotes the growth. This law was experimentally verified by many researchers (Arkin and Katz, 1956; Trueta and Trias, 1961). Arkin and Katz (1956), used plaster casts to restrict the hind limb of rabbits in valgus position for six weeks. They found valgus deformity was developed after six weeks due to the regional variation in the growth rate. Trueta and Trias (1961) performed a similar experiment by applying a spring and clamp across the knee joint of immature rabbits. They reported that increase in static compressive force inhibits vascularization and hence ossification. The Heuter-Volkmann law is still the basis of clinical treatment used to correct the bone deformity problems during growth (Cherry, 1951; Herwig et al., 1987; Zuege et al., 1979). For example, casting and bracing influence the bone growth direction and are used to correct the clubfoot deformity (Desai et al., 2010). The Pavlik harness, used to correct the hip dysplasia in newborns, prevents extension and adduction and ensures that the femoral head does not luxate from acetabular socket during growth (Atalar et al., 2007). The Heuter-Volkmann law illustrates the consequences of static loading on the bone. In normal conditions most bones are subjected to intermittent or cyclic loads. The unequal growth across the growth plate has been reported due to unequal cyclic compressive loading (Pauwels, 1980). Alberty et al. (1993), applied compression or distraction load once a day using an external fixation device across the distal femoral growth plate of immature rabbits. They found that distraction increased the height of proliferative and hypertrophic zones, whereas compression reduced the height of the same zone. The number of proliferating chondrocytes was decreased after compressive loading. Carter et al. (1987) introduced another theory that incorporates the effect of multiaxial load on longitudinal growth. In their work, the multiaxial stress tensor due to cyclic loading was expressed by two scalar stress invariants: octahedral shear stress and hydrostatic compressive stress. Their theory states that cyclic or intermittent hydrostatic compressive stress inhibits growth while cyclic or intermittent octahedral shear stress accelerates growth.
10 Chapter 1. Introduction The mechanical growth rate 𝜀̇𝑚 can be determined by the osteogenic index (Equation 1.1), which is a linear sum of peak cyclic octahedral shear stress 𝜎𝑠 and cyclic hydrostatic stress
𝜎𝐻 throughout the load history (Stevens et al., 1999). The octahedral shear stress is always positive in nature and promotes growth. The hydrostatic stress can be positive (hydrostatic tensile stress) or negative (hydrostatic compressive stress). The hydrostatic tensile stress promotes growth whereas hydrostatic compressive stress inhibits growth. High values of the osteogenic index IO indicate stimulation of growth and ossification. 𝜀̇𝑚 = 𝐼𝑜 = 𝑎 ∙ 𝑚𝑎𝑥𝜎𝑠 + 𝑏 ∙ 𝑚𝑖𝑛𝜎𝐻
(1.1)
Coefficients a and b determine the relative influence of octahedral shear stress and hydrostatic stress on the osteogenic index (mechanical growth rate). Previous studies have suggested that the b/a ratio must be between 0.3 and 1 to predict accurate endochondral ossification pattern (Carter and Wong, 1988; Wong and Carter, 1990). The Carter and Wong theory has been used by many researchers to predict ossification patterns in long bones (Carter et al., 1998; Carter et al., 1987; Wong and Carter, 1990), the appearance and shape of the secondary site of ossification (Carter and Wong, 1988), ossification patterns in the sternum (Wong and Carter, 1988) and the joint morphology (Heegaard et al., 1999). Shefelbine et al. (2004a; 2004b; 2002) used the Carter and Wong theory to predict the progression and shape of the growth front in children during growth. A similar study was performed by Carriero et al. (2011) to understand the effect of different gait pattern on the development of femoral morphology. In all these studies, generic femur and simplified growth plate geometry was used. Despite the simplified geometry assumption, the results of these studies indicated that muscle and joint contact acting on the bone may be a predictor for the development of bone morphology, i.e. abnormal loading may lead to bone deformity in growing children.
1.4 Growth direction The Carter and Wong theory is useful to determine growth rate, but does not intrinsically incorporate the resulting growth direction or orientation (Lin et al., 2009). It has been reported in an experimental study that growth plate cartilage grows in the direction of deformation (Arkin and Katz, 1956). In this study authors found valgus deformity at the proximal part of the tibia of immature rabbits, held in the valgus position for six weeks. The
P r i t i Y a d a v | 11 valgus position was maintained by applying the cast at the distal part of the tibia, and no direct external stresses were applied in the proximal region. The histological analysis of the proximal tibial growth plate showed the orientation of chondrocytes columns in the deformation direction. All previous studies of bone morphology prediction have considered the growth direction to be the average deformation of either the growth plate or the femoral neck axis (Carriero et al., 2011; Shefelbine and Carter, 2004a, 2004b; Shefelbine et al., 2002). Further, several authors have suggested that the topology of the growth plate may be “designed” to protect it from shear stresses (Ogden, 2000; Smith, 1962). The epiphyseal plate has a tendency to lie parallel to either maximum or minimum principal stress, which minimizes the shear stress between the epiphysis and diaphysis (Currey, 2002). Smith (1962) reported that the proximal femoral growth plate tends to lie parallel to principal tensile stress in the region of principal compressive stress and vice versa, hence practically free from shear stresses. Bright et al. (1974) also investigated that if a rat tibia is subjected to shear, the cartilaginous epiphyseal plate breaks at low forces. Hence, it may be a valid speculation that growth occurs in the direction of principal stress (minimum shear stress).
1.5 Forces on the bone To understand bone deformity in growing children, knowledge of mechanical forces acting on the bone is required as it modulates the bone growth. The two major forces acting on the bone are musculo-tendon forces and joint contact forces. Musculo-tendon forces and joint contact forces can be measured directly by placing a force transducer on a tendon (Dennerlein, 2005) and joint (Hodge et al., 1986) respectively. However, direct measurements of musculoskeletal load in vivo requires invasive techniques (Dennerlein, 2005; Dennerlein et al., 1998; Fleming and Beynnon, 2004; Ravary et al., 2004; Schuind et al., 1992) and are often limited to minimally invasive measurements in superficial tendons such as the Achilles tendon (Finni et al., 1998; Komi, 1990). To overcome such difficulties and limitations of invasive methods, use of a non-invasive method, for example, ultrasonic technique (Pourcelot et al., 2005) would be a good approach for tendon force estimation. In this method, ultrasonic wave velocities in the tendons, which are related to tendon loading, are measured. The main limitation of this method is that it can be used only in immediately subcutaneous tendons.
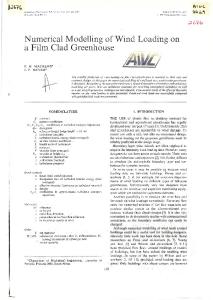
12 Chapter 1. Introduction Muscle forces can also be estimated using electromyography (EMG)-based methods (Erdemir et al., 2007) combined with muscle modelling. To calculate muscle forces from activation, a Hill-type muscle-tendon actuator, shown in Figure 1.3, is commonly used (Ackland et al., 2012), in which muscle properties are represented by an active contractile element (CE) in parallel with a passive elastic element. The tendon is in series with muscle and is represented by a non-linear elastic element. The joint kinematics are used to determine the muscle-tendon attachment points. These positions are then used to calculate the length and velocity of the muscle-tendon actuator. These values are used by the musculo-tendon dynamics, along with muscle activation to determine the forces.
Figure 1.3. Hill-type muscle-tendon actuator
A major challenge with EMG-based methods is to collect accurate data for all muscles. Collection of EMG data for all muscles with surface EMG is not feasible and the use of fine wire electrode for EMG is an invasive method and hence challenging to collect. Individual muscle force computation is therefore a complex problem in biomechanics. Numerical methods based on optimization approach (Anderson and Pandy, 2001; Wesseling et al., 2015) are commonly used to solve this multidimensional problem. An inverse dynamics-based and static optimization method has been used to estimate the muscle forces for several decades (Erdemir et al., 2007). In this type of method, joint torques are calculated from joint kinematics and ground reaction using inverse dynamic analysis. The computed joint torque is considered as the resultant action of all muscles crossing that joint. The system is indeterminate, i.e. the number of unknowns (musculo-tendon forces) are more than the number of equations, and an optimization technique is thus required to estimate the musculo-tendon forces. Different optimization cost functions have been proposed to estimate muscle forces, but the most commonly-used cost function for normal subject gait is the minimum the sum of squared of muscle activation or muscle stresses (Anderson and Pandy, 2001; Erdemir et al., 2007), which is one way to represent a strategy that minimizes required metabolic effort. It is important to keep in mind that these techniques result in computed
P r i t i Y a d a v | 13 muscle forces that are an optimal solution with respect to the cost function used; the central nervous system may use a different strategy. Estimated joint contact forces can be computed by performing the inverse dynamic analysis with computed muscle forces and external forces – including GRF, inertial forces, and gravity – as input to the model. Previous studies have used inverse dynamic analysis and static optimization to understand the effect of proximal femoral morphology on hip contact force (Lenaerts et al., 2008) and influence of altered gait pattern on hip contact force (Carriero et al., 2014). Many pediatric bone deformity problems are thought to be caused by specific muscle or muscle group forces. To better understand the relation between different muscle groups and bone morphology, knowledge of joint contact forces due to a particular group of muscles or contribution of different muscles to the total joint contact forces are required. In the musculoskeletal system, many muscle forces contribute to the acceleration of several body joints, due to dynamic coupling. Therefore, each lower limb muscle individually contributes to the acceleration of the center of mass and thus to GRF and joint contact forces. Hence to estimate the contribution of individual muscles or muscle groups to the overall joint contact force, decomposition of the GRF followed by inverse dynamic analysis with individual muscle force and associated GRF can be performed. A similar approach was used to compute the contribution of individual muscle force to the overall hip (Correa et al., 2010) and knee contact forces (Sasaki and Neptune, 2010). To decompose the GRF, Anderson and Pandy (2003) introduced a dynamic optimizationbased method. In their work, vertical and fore-aft components of the GRF were decomposed. The results showed sharp discontinuities at certain intervals in the computed muscle contribution to the total GRF due to rigid foot-ground contact. This method has been used only for simulated gait data. Liu et al. (2006), introduced another method based on perturbation analysis and used it with both simulated and experimental gait data (Liu et al., 2008, 2006). In this method, at each time instant of gait, a muscle force is perturbed by a very small amount and the equations of motion are integrated. The limitation of this method is the high computation cost, which is proportional to the number of time steps in the gait cycle and the number of muscles used to actuate the model.
14 Chapter 1. Introduction Lin et al. (2011) also developed a pseudo-inverse-based method to decompose the GRF. In this method, foot-ground contact was defined at five locations of the foot and for three different phases (heel-strike, foot flat and toe-off). A weighting function was used for smooth transition between the different phases, thus resolving the discontinuity in muscle contribution to overall GRF. The method is similar in concept to an optimization-based method except that this method provides an analytical solution to an indeterminate system with a weighting matrix. This method has been used to find the contribution of individual muscle forces to the overall GRF (Lin et al., 2011) and the center of mass acceleration (Lim et al., 2013). The results were similar to those computed with an optimization-based method. The pseudoinverse based method was also found to be faster than the perturbation analysis-based method (Lin et al., 2011).
1.6 Femoral neck shaft angle and femoral anteversion The neck shaft and femoral anteversion angles are the most commonly analyzed proximal femoral morphological parameters. The neck shaft angle is defined as the angle between neck and femoral shaft axes. Femoral anteversion refers to the orientation of the femoral neck in relation to the femoral condyle alignment and is measured as the angle between the femoral neck plane and condylar axis plane (Arnold et al., 2001; Murphy et al., 1987). In normal growth, both neck shaft angle and femoral anteversion reduce until skeletal maturity. In ablebodied subjects, femoral anteversion and neck shaft angles are around 40o and 150o, respectively, at birth and reduce to 15o and 120o, respectively, at skeletal maturity (Isaac et al., 1997; Jenkins et al., 2003; Schneider et al., 1997; Tamari et al., 2005). In children with cerebral palsy, these angles are commonly 20-50o higher (Davids et al., 2003).
1.7 Aim and scope The overall aim of this work is to better understand proximal femoral growth mechanisms. Specific aims are to develop a subject-specific femur and growth plate model that predicts bone growth tendency and to understand how different muscle groups’ activation influences bone growth tendency in children during normal gait. Study 1
To develop a subject-specific finite element model of the femur and growth plate
To evaluate the significance of such a model on IO computation from gait
P r i t i Y a d a v | 15
To investigate two different growth direction models – minimum shear stress direction (MSSD) and femoral neck deformation direction (FNDD)
Study 2 This study aims to understand how different muscle groups’ activation during able-bodied children’s normal gait influences proximal femoral growth tendency.
1.8 Outline of the thesis The methods used in both the studies are similar and are presented in Chapter 2. Chapter 3 presents the results in brief. The detailed methods and results are can be seen in Papers 1 and 2. In chapter 4, the main conclusions of both the studies and possible objectives for the future studies are presented.
P r i t i Y a d a v | 17
Chapter 2 Methods In this chapter, the brief methodology of the current work is presented. The detailed description of all the material and methods used in this thesis are mentioned in the appended papers in Part II. The present work was approved by the regional ethical review board in Stockholm, Sweden. The participants and their parents provided written informed consent. The methods used in both the studies can be divided into four major parts:
2.1 Data collection Three typically-developing children participated in this study. Their anthropometric measurements are given in Table 2.1. Table 2.1. Description of subjects in studies Age
Body
Neck shaft
Femoral
(y)
mass (kg)
angle (deg)
anteversion (deg)
Female
6
20.7
140
34
Studies 1 & 2
Male
7
23.8
136
33
Study 2
Female
11
49.5
138
18
Participated in
Sex
Subject 1
Study 2
Subject 2 Subject 3
Magnetic resonance imaging (MRI): MRI data of the lower body for all subjects was collected at T1 contrast and spin echo sequence in a neutral supine position (Ingenia 3.0 T, Philips, Best, The Netherlands). The MRI data was collected in the axial direction (iliac crest to toes) and the coronal direction (hip joint only). Gait analysis: 3D gait kinematics and GRF were collected for all three subjects, walking at a self-selected, comfortable speed. Motion data were sampled at 100 Hz and GRF at 1000Hz.
2.2 Geometric model Studies 1& 2: The MRI data was used to create subject-specific femur and growth plate geometric models for all subjects. The coronal image data was used to construct the proximal femoral growth plate geometry; the remaining part of the femur was built from axial image data (Materialise NV, Leuven, Belgium). Study 1: The simplified growth plate model was constructed as a disk in the femoral neck (Carriero et al., 2011) of the subject-specific femur.
18 Chapter 2. Methods
2.3 Inverse dynamic analysis & static optimization The muscle forces and hip contact force were computed using inverse dynamic analysis and static optimization. Studies 1 & 2: Subject-specific musculoskeletal models were created by scaling the generic musculoskeletal model in the software based on the subject’s marker placement during motion analysis, and by modifying the neck shaft angle and femoral anteversion of the scaled model based on those measured by each subject’s MRI data. The femur geometry of the musculoskeletal models was visually verified by superimposing the MRI developed femur model to the deformed femur model. For each time step of the gait cycle, joint moments computed from inverse dynamic analysis were sent to a static optimization routine to compute the muscle forces (SIMM, Musculographics Inc., Santa Rosa, CA, USA). The cost function for the static optimization was minimum sum of squared muscle stresses. The computed muscle forces thus produce a muscular joint moment equal to the joint moment computed from inverse dynamic analysis (Anderson and Pandy, 2001). A second inverse dynamic analysis was performed by applying both the computed muscle forces and the external forces (GRF, inertial forces and gravity) to compute overall hip contact force. Study 2: A pseudo-inverse induced acceleration analysis (Dorn et al., 2012; Lin et al., 2011) was performed to decompose the GRF. The generalized equation of motion for the n degree of freedom skeleton with k musculo-tendon units is represented as: 𝑀(𝑞)𝑞̈ = 𝐶(𝑞, 𝑞̇ ) + 𝐺(𝑞) + 𝑅(𝑞)𝑓𝑀 + 𝐸(𝑞)𝑓𝐸
(2.1)
Where 𝑞, 𝑞̇ , 𝑞̈ are the vectors of generalized displacements, velocity, and accelerations respectively, 𝑀(𝑞) is an 𝑛 × 𝑛 system mass matrix, 𝐶(𝑞, 𝑞̇ ) is an 𝑛 × 1 generalized force vector consisting of centrifugal and coriolis forces, 𝐺(𝑞) is an 𝑛 × 1 generalized force vector due to gravity, 𝑅(𝑞) is 𝑛 × 𝑘 matrix of muscle moment arms; 𝑓𝑀 is a 𝑘 × 1 muscle force vector, 𝑓𝐸 is 3𝑚 × 1 vector of external reaction forces exerted on the foot by the ground via m foot-contact points as shown in Figure 2.1, and 𝐸(𝑞) ia an 𝑛 × 3𝑚 matrix of linear partial velocities.
P r i t i Y a d a v | 19
Figure 2.1. Foot-ground contact points. Phase 1: depicted during heel strike, Phase 2 and 3: depicted during foot flat, Phase 4: depicted during toe off (Lin et al., 2011).
It was assumed that the linear acceleration of the ith foot-contact point was zero whenever it was in contact with the ground, so linear acceleration of the ith foot-contact point can be represented as: 𝑎𝑖 (𝑞, 𝑞̇ , 𝑞̈ ) = 𝐾𝑖 (𝑞, 𝑞̇ ) + 𝑁𝑖 (𝑞, 𝑞̇ )𝑞̈ = 0
(2.2)
In Equation 2.2, 𝐾𝑖 and 𝑁𝑖 are coefficient matrices and computed as 𝐾𝑖 (𝑞𝑡 , 𝑞̇ 𝑡 ) = 𝑎𝑖 (𝑞𝑡 , 𝑞̇ 𝑡 , 0) 𝑁𝑖 (𝑞𝑡 , 𝑞̇ 𝑡 ) =
𝜕𝑎𝑖 𝜕𝑞̈
(𝑞𝑡 , 𝑞̇ 𝑡 )
(2.3)
(2.4)
Here 𝑞𝑡 and 𝑞̇ 𝑡 are vectors containing the generalized displacements and velocities at each time step, t. To compute the individual muscle force contribution to overall GRF, each muscle force was applied in isolation and GRF was computed using Equations 2.1 & 2.2. For example, to compute the GRF due to a muscle 𝛼, Equations 2.1 and 2.2 can be expressed as 𝑀(𝑞)𝑞̈ 𝛼 = 𝐹𝛼 + 𝐸(𝑞)𝑓𝐸 𝛼
(2.5)
𝑊{𝐾𝑖 (𝑞, 𝑞̇ ) + 𝑁𝑖 (𝑞, 𝑞̇ )𝑞̈ 𝛼 } = 0
(2.6)
20 Chapter 2. Methods Where 𝑊 is the weighting matrix for smooth transition between contact phases (shown in Figure 2.1). This constrains the foot-contact point in such a way that it is consistent with the actual movement of the foot during stance. The system equations 2.5 and 2.6 were solved for GRF using a least-squares pseudo-inverse method (Equation 2.7): 𝑞̈ 𝛼 {𝑓 } = 𝐴+ 𝑏
(2.7)
𝐸𝛼
𝑀𝑛×𝑛 ̃ [𝑊 ∙ 𝑁 Where 𝐴+ is the Moore–Penrose pseudo-inverse of the matrix 𝐴 = 𝑊 03𝑚×𝑛
−𝐸 03𝑚×3𝑚 ] 𝐼3𝑚×3𝑚
𝐹𝛼 ̃ {−𝑊 ∙ 𝐾 } 𝑏=𝑊 03𝑚×1 ̃ =[ 𝑊
104 𝐼𝑛×𝑛
102 𝐼3𝑚×3𝑚
] is a weighting matrix 𝐼3𝑚×3𝑚
To compute the contribution of a particular muscle group to the overall hip contact force, muscle forces of that group and associated GRF were applied to the model and inverse dynamic analysis was performed. The hip contact force was computed due to following muscle groups: Case 1: All muscles Case 2: Hip flexors muscles Case 3: Hip extensors muscles Case 4: Hip adductors muscles Case 5: Hip abductors muscles Case 6: Knee extensors muscles
2.4 Finite element analysis to predict growth tendency Model & Mesh: Each femur model consisted of cortical bone, bone marrow, a proximal femoral growth plate, proximal trabecular and distal trabecular bone. The material for all the
P r i t i Y a d a v | 21 femoral parts were modeled as isotropic and linear elastic. The meshing and material property details can be read in Papers 1& 2. Loading and boundary condition: One gait cycle was discretized into nine load instances; five load instances correspond to initial contact, first peak, valley, second peak of the resultant hip contact force computed for load Case 1, and initial swing. The remaining four load instances are the midpoints between these five. For each load case, simulation was performed for all nine load instances. According to the load case, muscle forces and associated hip contact force were applied to the model. The condyles were constrained in all directions. Finite element analysis was performed (ANSYS Inc., Canonsburg, PA) to estimate stresses at the growth plate surfaces. Study 1: Simulation was performed for load case 1 Study 2: Simulation was performed for all load cases (1-6) Growth rate: The specific growth rate was computed as the sum of biological and mechanical growth rate. The biological growth rate was estimated as described in the literature (Pritchett, 1992). The mechanical growth rate was computed using the Equation 1.1. Growth direction computation: Study 1: In this study two growth directions were compared, minimum shear stress direction and femoral neck deformation direction. Study 2: Minimum shear stress direction was considered for growth simulations. The growth plate’s distal surface elements were “grown” by the magnitude of the growth rate (𝜀̇), but in the directions as described above. The coordinate system was created such that, the x-axis was aligned with the growth direction. The orthonormal thermal expansion capabilities of the finite element analysis solver were utilized with a coefficient of thermal expansion of 1 in the x-direction and 0 in y- and z-directions. The 𝜀̇ was considered as the “temperature” for expansion. The expanded model was considered as the model after growth.
P r i t i Y a d a v | 23
Chapter 3 Results and Discussion In Study 1, subject-specific and simplified growth plate models were compared. Furthermore, growth was simulated in two different directions: minimum shear stress growth direction & femoral neck deformation direction. The effect of different muscle groups’ activation on proximal femoral growth tendency was evaluated in Study 2. In this chapter, results of both studies are discussed in brief. The detailed discussions about the results are available in the papers appended in Part II. The main findings of this thesis are:
Subject-specific and simplified growth plate models resulted in different Io distribution patterns.
The minimum shear stress growth direction showed a tendency to reduce the neck shaft angle and femoral anteversion angle whereas the femoral neck deformation growth direction showed a tendency to reduce the neck shaft angle only.
Hip abductors contribute most to proximal femoral growth rate in an able-bodied child during gait.
The difference observed between subject-specific and simplified growth plate Io distributions was due to the shape and location of the growth plate. The subject-specific growth plate had an irregular shape and was located within the femoral head. The simplified growth plate, on the other hand, was shaped like a disk and located in the femoral neck, similar to a previous study (Carriero et al., 2011). The stresses and hence Io on the growth plate are sensitive to its shape and to its location, as load distribution on the growth plate depends on its location. For a more accurate prediction of Io and growth tendency, a subject-specific femur and growth plate model is essential. The first study also showed that growth tendency prediction is sensitive to estimated growth direction. Though there is some experimental evidence that growth occurs in the direction of deformation (Arkin and Katz, 1956); it is challenging to find the correct deformations through numerical simulations, as the deformation pattern is sensitive to the applied boundary condition. Several methods that aim to define accurate boundary conditions for the femur in finite element analysis have been reported (Duda et al., 1998; K Polgár et al., 2003a; 2003b; Tsai et al., 2013). In all these studies the femur model was either constrained at mid-diaphysis or at the condyles. Constraining the model at the condyles results in very high deflection at femoral head. To avoid this infeasibly higher deflection of femoral head, the femur was
24 Chapter 3. Results and Discussion constrained in several studies at the mid-diaphysis, which is not a physiologically-relevant constraint. Speirs et al. (2007) proposed a physiological boundary condition for the femur. In their model knee-center translation was constrained in all the three directions. The hip contact point was constrained in anterior-posterior and medial-lateral direction and a node on the lateral epicondyle was constrained in the anterior-posterior direction. They applied joint contact force and all muscle forces and reported physiologically plausible deformation (around 4mm) for the femur. However it is unclear whether a hip contact point constraint can be justified in relation to the in vivo situation, where the femoral head is not rigidly constrained to deflect in anterior-posterior and medial-lateral directions. The stresses are considered to be less sensitive to applied boundary condition than the deformation, but any rigid constraint near femoral head region can affect the growth plate stresses and deformation drastically. Hence in the current study, the femoral head region was not constrained and all the muscle forces were applied along with hip contact force to reduce the femoral head deformation (Polgár et al., 2003b). Another challenge with a femoral neck deformation direction growth model is that the magnitude of the modulus of elasticity of trabecular bone has direct consequences on the resulting deformation magnitude. The ratio of moduli of elasticity of trabecular bone and the growth plate can vary the deformation pattern of the femoral head region, whereas for linear elastic materials, stresses are unaffected by the modulus of elasticity. Hence, a stress-based growth direction may be a better choice for numerical simulation of bone growth. In Study 1, growth was simulated in the minimum shear stress direction also. This growth direction model was developed based on the previous finding that the growth plate tends to lie parallel to either maximum principal stress or to minimum principal stresses (Currey, 2002), and that cartilage material breaks at very low stresses when subjected to shear loading (Bright et al., 1974). The minimum shear stress direction model is based on the stresses, and is thus less sensitive to the applied boundary condition than the deformation direction model. Study 2 illustrates how different muscle groups produce different pattern of specific growth rates. In able-bodied children, proximal femoral growth is most affected by hip abductors and least by hip adductors. Muscle groups that do not span the proximal femur can also influence its growth; for instance we found that the vasti muscles (uniarticular knee extensors) can influence the neck shaft angle and femoral anteversion during growth.
P r i t i Y a d a v | 25 When interpreting the results of these studies, a number of limitations should be taken into account. Growth was simulated only for the loading due to gait, whereas growing children perform many other activities like running, jumping or playing any specific sport in their daily routine. In reality, consideration of many loading patterns is important for more accurate bone growth prediction. In the studies in this thesis, only proximal growth plate was considered, and results estimate the relative change in position of the femoral head. Morphological measurements are, however, based on femoral neck axis, condylar axis, and femoral shaft axis definitions. The orientation of these axes may change with the bone growth that occurs at both the proximal and distal growth plates. Hence for accurate prediction of morphological changes, both proximal and distal growth plates should be considered in the model. The musculoskeletal model prediction is sensitive to the bone and musculo-tendon geometry (Carbone et al., 2012; Scheys et al., 2011). In the current work a deformed generic model was used for force computation. To improve the force computation results, MRI-based musculoskeletal model should be developed. To compute the contribution of different muscle groups to the total hip contact force, GRF was decomposed using pseudo-inverse induced acceleration analysis. In this analysis, the contact between foot and ground was assumed rigid, which is a simplified contact model. However, Anderson and Pandy (2003) reported that rigid-body contact is reasonable for force decomposition problems. The presented study has a low statistical power due to the small sample size. To form a stronger conclusion about bone growth, a study with a larger population of able-bodied children should be performed. We were, furthermore, able to predict the known progression of reducing femoral anteversion and neck-shaft angle during growth, but an experimental study that follows up growing children over a long time period is required to evaluate the validity of our growth prediction.
P r i t i Y a d a v | 27
Chapter 4 Conclusions and future work 4.1 Conclusion The work presented in this thesis elucidates the importance of subject-specific femur and growth plate geometry, growth direction models, and influence of muscle groups in growth tendency prediction. Though it is well known that muscles and bones are inextricably linked and imbalanced muscle forces can induce bone deformities, no studies to the author’s knowledge have determined the influence of different muscle groups' activation to bone growth tendency. The work presented in this thesis (Study 2) provides an understanding of the muscle-bone mechanical relationship. The work described in Study 1 represents the first study to introduce a minimum shear stress growth direction model for bone growth tendency prediction and to compare it to a femoral neck deformation direction model. The study showed that bone growth tendency prediction is sensitive to the growth direction model. In Study 1, we also demonstrated that growth prediction is highly dependent on the model sophistication; a simplified geometric model does not produce similar stresses as a more labor-intensive subject-specific model. The results of this study suggest that for better prediction of bone growth morphology in growing children, consideration of subject-specific geometry is important. Also in numerical simulation, the minimum shear stress growth direction model may be a better choice as it is less sensitive to applied boundary condition than the femoral neck deformation direction. The numerical prediction of growth tendency and the understanding of the influence of muscles on growth tendency can help in better treatment planning, particularly preventive treatment design, for children affected with bone deformity problems.
4.2 Future work The following studies could be interesting and feasible, based on the current work: 4.2.1 Proximal femoral growth prediction in able-bodied children due to recreational activities
28 Chapter 4. Conclusions and future work Walking, running, and jumping are common activities in recreational sports and daily life of an able-bodied child. The aim of this study would be to explore the influence of these activities on longitudinal bone growth. Two major changes would be required in such a study compared to Studies 1 and 2. Data collection: Joint kinematics, GRF, and surface EMG for lower limb muscles should be collected for able-bodied children during walking, running, and jumping. Force computation: In Studies 1 & 2, muscle forces were computed using static optimization. However, this method has been shown to overestimate muscle force magnitudes, especially for strenuous activities such as running and jumping (Prilutsky et al., 1997). Therefore, this study should explore dynamic optimization or EMG-based methods to compute muscle forces. The outcomes of this study can help in understanding the importance of physical activities on longitudinal bone growth, i.e. what is bone growth tendency in physically active children compared to inactive children. 4.2.2 Do all femoral growth plates influence the proximal femoral morphological development in growing children? The femur in growing children has 4 growth plates, located near the femoral head, the greater trochanter, the lesser trochanter, and the distal femur. In the current studies, only the femoral head growth plate was considered, whereas growth occurring at the distal growth plate and even the trochanters can influence proximal femoral morphological parameters. Growth at the distal growth plate can affect the femoral shaft axis and condylar axis and hence neck shaft angle and femoral anteversion. Further, femoral anteversion is the internal rotation of the femur. Internal rotation of the femur can occur at the femoral head or the distal growth plate, or both. The position of the greater trochanter and lesser trochanter may, furthermore, affect the femoral neck axis or femoral shaft axis orientation, and the growth at the plate near it may affect these parameters. This study could focus on investigating the role of proximal and distal growth plates on proximal femoral morphological changes. In such a study, the model must include additional growth plates. The most challenging part of this study will be the boundary condition. The growth plate stresses are highly sensitive to any applied boundary condition in the nearby region. To prevent rigid body motion during finite element analysis, a greater number of
P r i t i Y a d a v | 29 degrees of freedom of the model must be constrained. Constraining at the condyles will affect the distal growth plate stresses, whereas constraining at the femoral head will affect the proximal growth plate stresses. To simplify and organize the problem in better way this study can be split into two parts. The first part of this study could focus on the effect of mechanical loading on growth at the distal growth plate. The model would be same as used in Studies 1 and 2, except that instead of the proximal femoral growth plate, a distal growth plate would be included. If it is found that distal growth plate contributes to proximal femoral morphological development, a further study could be performed that includes both proximal and distal growth plates. When considering both the growth plates, fixed boundary conditions would not be appropriate, and a free boundary condition (Phillips, 2009) approach should be explored. The modeling of trochanteric growth plates in finite element simulation of bone growth would also be challenging, as almost the entire surface of the trochanteric growth plates provides attachment sites for many muscles. The stresses and thus growth rate at these growth plates will be sensitive to both attached muscle force point of action and magnitude. Hence further study is required to estimate the sensitivity of proximal muscle force modeling in finite element analysis of proximal femoral bone growth due to trochanteric growth plates. 4.2.3 Proximal femoral growth prediction: combining longitudinal and radial growth modeling. In the current studies, only longitudinal growth of long bone was modeled, whereas bone growth occurs in the radial direction as well. Previous studies have examined the effect of mechanical loading on radial growth (Carter et al., 1996; Robling et al., 2001). The combination of both longitudinal bone growth (endochondral ossification) and radial bone growth (subperiosteal ossification) modeling will provide a better idea about morphological development.
P r i t i Y a d a v | 31
Acknowledgements I would like to express my deep sense of gratitude to my supervisor Dr. Elena GutierrezFarewik for her meticulous guidance, constant encouragement and continuous support. I am grateful to Dr. Sandra J. Shefelbine, for guiding me through the finite element analysis of bone growth. Her research experience and knowledge helped immensely to achieve the objectives of this thesis I would also like to thank my co-supervisor Prof. Anders Eriksson and Dr. Eva Pontén for their valuable help and suggestions that helped me through this work. I thank to Dr. Thröstur Finnbogason, Anna Lind for their help in MRI data collection. I also thank Kristina Löwing, Cecilia Lidbeck and Åsa Bartonek for helping me in gait data collection and sharing their knowledge. I also wish to thank children and their parents for voluntarily participating in this research work. I wish to thank Dr. Arne Nordmark, Dr. Gunnar Tibert for their valuable suggestions and comments during group seminars. I would like to acknowledge Swedish Research Council, Stiftelsen Promobilia and Norrbacka-Eugeniastiftelsen for providing funding for this research work. Lots of thanks to all my group mates Erik Dijkstra, Marta Björnsdóttir, Yang Zhou, Ganesh Tamadapu, Amit Patil , Mikael Swarén, Nasseradeen Ashwear, Ruoli Wang, Krishna Manda, Pau Mallol, and Huina Mao for their constant companionship, help and useful technical discussion and showing interest to understand my research work. I also thank to my office mates, Mechanics Department and Astrid Lindgrens Motorik Lab. Finally, I would like to thank my parents (Sushila Devi & R.J. Yadav), sisters (Pratibha and Pramila) and brother (Praveer) for their love, care, support and encouragement to pursue my dream. Also many thanks to my best friend and love Debasis for your unconditional love, support, understanding and always motivating me to keep the positive attitude in life.
P r i t i Y a d a v | 33
References Abad, V., Meyers, J.L., Weise, M., Gafni, R.I., Barnes, K.M., Nilsson, O., Bacher, J.D., Baron, J., 2002. The role of the resting zone in growth plate chondrogenesis. Endocrinology 143, 1851–1857. Ackland, D.C., Lin, Y.-C., Pandy, M.G., 2012. Sensitivity of model predictions of muscle function to changes in moment arms and muscle-tendon properties: a Monte-Carlo analysis. J. Biomech. 45, 1463–71. Adams, C.S., Shapiro, I.M., 2002. The fate of the terminally differentiated chondrocyte: Evidence for microenvironmental regulation of chondrocyte apoptosis. Crit. Rev. Oral Biol. Med. 13, 465–473. Alberty, A., Peltonen, J., Ritsilä, V., 1993. Effects of distraction and compression on proliferation of growth plate chondrocytes: A study in rabbits. Acta Orthop. 64, 449– 455. Anderson, F.C., Pandy, M.G., 2001. Static and dynamic optimization solutions for gait are practically equivalent. J. Biomech. 34, 153–61. Anderson, F.C., Pandy, M.G., 2003. Individual muscle contributions to support in normal walking. Gait Posture 17, 159–69. Arkin, A.M., Katz, J.F., 1956. The effects of pressure on epiphyseal growth; the mechanism of plasticity of growing bone. J. Bone Joint Surg. Am. 38-A, 1056–1076. Arnold, A.S., Blemker, S.S., Delp, S.L., 2001. Evaluation of a Deformable Musculoskeletal Model for Estimating Muscle–Tendon Lengths During Crouch Gait. Ann. Biomed. Eng. 29, 263–274. Atalar, H., Sayli, U., Yavuz, O.Y., Uraş, I., Dogruel, H., 2007. Indicators of successful use of the Pavlik harness in infants with developmental dysplasia of the hip. Int. Orthop. 31, 145–50. Beaupre, G.S., Stevens, S.S., Carter, D.R., 2000. Mechanobiology in the development , maintenance , and degeneration of articular cartilage. J. Rehabil. Res. Dev. 37, 145–151. Bright, R.W., Burstein, a H., Elmore, S.M., 1974. Epiphyseal-plate cartilage. A biomechanical and histological analysis of failure modes. J. Bone Joint Surg. Am. 56, 688–703. Burch, W.M., Van Wyk, J.J., 1987. Triiodothyronine stimulates cartilage growth and maturation by different mechanisms. Am J Physiol Endocrinol Metab 252, E176–182. Carbone, V., van der Krogt, M.M., Koopman, H.F.J.M., Verdonschot, N., 2012. Sensitivity of subject-specific models to errors in musculo-skeletal geometry. J. Biomech. 45, 2476– 80.
34 References Carriero, A., Jonkers, I., Shefelbine, S.J., 2011. Mechanobiological prediction of proximal femoral deformities in children with cerebral palsy. Comput. Methods Biomech. Biomed. Engin. 14, 253–262. Carriero, A., Zavatsky, A., Stebbins, J., Theologis, T., Lenaerts, G., Jonkers, I., Shefelbine, S.J., 2014. Influence of altered gait patterns on the hip joint contact forces. Comput. Methods Biomech. Biomed. Engin. 17, 352–359. Carter, D.R., Beaupré, G.S., 2001. Skeletal function and form: mechanobiology of skeletal development, aging, and regeneration, Cambridge University Press, Cambridge. Elsevier. Carter, D.R., Beaupré, G.S., Wong, M., Smith, R.L., Andriacchi, T.P., Schurman, D.J., 2004. The mechanobiology of articular cartilage development and degeneration. Clin. Orthop. Relat. Res. S69–S77. Carter, D.R., Mikic, B., Padian, K., 1998. Epigenetic mechanical factors in the evolution of long bone epiphyses. Zool. J. Linn. Soc. 123, 163–178. Carter, D.R., Orr, T.E., Fyhrie, D.P., Schurman, D.J., 1987. Influences of mechanical stress on prenatal and postnatal skeletal development. Clin. Orthop. Relat. Res. 219, 237–250. Carter, D.R., Rapperport, D.J., Fyhrie, D.P., Schurman, D.J., 1987. Relation of coxarthrosis to stresses and morphogenesis. A finite element analysis. Acta Orthop. Scand. 58, 611–9. Carter, D.R., Van Der Meulen, M.C., Beaupré, G.S., 1996. Mechanical factors in bone growth and development. Bone 18, 5S–10S. Carter, D.R., Wong, M., 1988. Mechanical stresses and endochondral ossification in the chondroepiphysis. J. Orthop. Res. 6, 148–154. Carter, D.R., Wong, M., 1988. The role of mechanical loading histories in the development of diarthrodial joints. J. Orthop. Res. 6, 804–816. Cherry, J.C., 1951. Epiphyseal stapling in the control of bone growth. Ir. J. Med. Sci. 6, 321– 323. Cibulka, M.T., 2004. Determination and Significance of Femoral Beck Anteversion. J. Am. Phys. Ther. Assoc. 84, 550–558. Cooper, K.L., Oh, S., Sung, Y., Dasari, R.R., Kirschner, M.W., Tabin, C.J., 2013. Multiple phases of chondrocyte enlargement underlie differences in skeletal proportions. Nature 495, 375–378. Correa, T. a, Crossley, K.M., Kim, H.J., Pandy, M.G., 2010. Contributions of individual muscles to hip joint contact force in normal walking. J. Biomech. 43, 1618–1622. Crevier-Denoix, N., Ravary-Plumioën, B., Evrard, D., Pourcelot, P., 2009. Reproducibility of a non-invasive ultrasonic technique of tendon force measurement, determined in vitro in equine superficial digital flexor tendons. J. Biomech. 42, 2210–2213.
P r i t i Y a d a v | 35 Currey, J.D., 2002. Bones: Structure and Mechanics, 2nd ed. Princeton University Press. Davids, J.R., Marshall, A.D., Blocker, E.R., Frick, S.L., Blackhurst, D.W., Skewes, E., 2003. Femoral Anteversion in Children with Cerebral Palsy. J. Bone Jt. Surg. Dennerlein, J.T., 2005. Finger Flexor Tendon Forces Are a Complex Function of Finger Joint Motions and Fingertip Forces. J. Hand Ther. 18, 120–127. Dennerlein, J.T., Diao, E., Mote, C.D., Rempel, D.M., 1998. Tensions of the flexor digitorum superficialis are higher than a current model predicts. J. Biomech. 31, 295–301. Desai, L., Oprescu, F., DiMeo, A., Morcuende, J. a, 2010. Bracing in the treatment of children with clubfoot: past, present, and future. Iowa Orthop. J. 30, 15–23. Dorn, T.W., Lin, Y.-C., Pandy, M.G., 2012. Estimates of muscle function in human gait depend on how foot-ground contact is modelled. Comput. Methods Biomech. Biomed. Engin. 15, 657–668. Duda, G.N., Heller, M., Albinger, J., Schulz, O., Schneider, E., Claes, L., 1998. Influence of muscle forces on femoral strain distribution. J. Biomech. 31, 841–846. Eames, B.F., De La Fuente, L., Helms, J. a., 2003. Molecular ontogeny of the skeleton. Birth Defects Res. Part C Embryo Today Rev. 69, 93–101. Erdemir, A., McLean, S., Herzog, W., van den Bogert, A.J., 2007. Model-based estimation of muscle forces exerted during movements. Clin. Biomech. (Bristol, Avon) 22, 131–54. Erlebacher, A., Filvaroff, E.H., Gitelman, S.E., Derynck, R., 1995. Toward a molecular understanding of skeletal development. Cell 80, 371–378. Farnum, C.E., Lee, R., O’Hara, K., Urban, J.P.G., 2002. Volume increase in growth plate chondrocytes during hypertrophy: the contribution of organic osmolytes. Bone 30, 574– 581. Finni, T., Komi, P. V., Lukkariniemi, J., 1998. Achilles tendon loading during walking: Application of a novel optic fiber technique. Eur. J. Appl. Physiol. Occup. Physiol. 77, 289–291. Fleming, B.C., Beynnon, B.D., 2004. In vivo measurement of ligament/tendon strains and forces: A review. Ann. Biomed. Eng. 32, 318–328. Frost, H.M., 2001. From Wolff’s law to the Utah paradigm: Insights about bone physiology and its clinical applications. Anat. Rec. 262, 398–419. Gage, J.R., Schwartz, M.H., Koop, S.E., Novacheck, T.F., 2009. The identification and treatment of gait problems in cerebral palsy, 2nd ed, Mac Keith Press. Gerber, H.P., Ferrara, N., 2000. Angiogenesis and bone growth. Trends Cardiovasc. Med. 10, 223–228.
36 References Germiller, J.A., Goldstein, S.A., 1997. Structure and function of embryonic growth plate in the absence of functioning skeletal muscle. J. Orthop. Res. 15, 362–370. Gkiatas, I., Lykissas, M., Kostas-Agnantis, I., Anastasios, K., Batistatou, A., Beris, A., 2015. Factors Affecting Bone Growth. Am. J. Orthop. 61–67. Goldstein, S.A., 1987. The Mechanical Properties of Trabecular Bone:Dependence On Anatomic Location And Function. J. Biomech. 20, 1055–1061. Guevara, J.M., Moncayo, M.A., Vaca-González, J.J., Gutiérrez, M.L., Barrera, L.A., GarzónAlvarado, D.A., 2015. Growth plate stress distribution implications during bone development: A simple framework computational approach. Comput. Methods Programs Biomed. 118, 59–68. Hall, B.K., Herring, S.W., 1990. Paralysis and growth of the musculoskeletal system in the embryonic chick. J. Morphol. 206, 45–56. Hamrick, M.W., 1999. A chondral modeling theory revisited. J. Theor. Biol. 201, 201–8. Heegaard, J.H., Beaupré, G.S., Carter, D.R., 1999. Mechanically modulated cartilage growth may regulate joint surface morphogenesis. J. Orthop. Res. 17, 509–517. Herwig, J., Schmidt, A., Matthiab, H.H., Kleemann, H., Buddecke, E., 1987. Biochemical events during stapling of the proximal tibial epiphyseal plate in pigs. Clin. Orthop. Relat. Res. 218, 283–289. Hodge, W.A., Fijan, R.S., Carlson, K.L., Burgess, R.G., Harris, W.H., Mann, R.W., 1986. Contact pressures in the human hip joint measured in vivio. Proc. Natl. Acad. Sci. U. S. A. 83, 2879–2883. Isaac, B., Vettivel, S., Prasad, R., Jeyaseelan, L., 1997. Prediction of the Femoral Neck-Shaft Angle From the Length of the Femoral Neck. Clin. Anat. 10, 318–323. Jenkins, S.E.M., Harrington, M.E., Zavatsky, A.B., O’Connor, J.J., Theologis, T.N., 2003. Femoral muscle attachment locations in children and adults, and their prediction from clinical measurement. Gait Posture 18, 13–22. Kandzierski, G., Matuszewski, L., Wójcik, A., 2012. Shape of growth plate of proximal femur in children and its significance in the aetiology of slipped capital femoral epiphysis. Int. Orthop. 36, 2513–2520. Komi, P. V., 1990. Relevance of in vivo force measurements to human biomechanics. J. Biomech. 23, 23–34. Kronenberg, H.M., Kronenberg, H.M., 2003. Developmental regulation of the growth plate. Nature 423, 332–6. Lenaerts, G., De Groote, F., Demeulenaere, B., Mulier, M., Van der Perre, G., Spaepen, a, Jonkers, I., 2008. Subject-specific hip geometry affects predicted hip joint contact forces during gait. J. Biomech. 41, 1243–52.
P r i t i Y a d a v | 37 Lerner, a L., Kuhn, J.L., Hollister, S.J., 1998. Are regional variations in bone growth related to mechanical stress and strain parameters? J. Biomech. 31, 327–35. Lim, Y.P., Lin, Y.-C., Pandy, M.G., 2013. Muscle function during gait is invariant to age when walking speed is controlled. Gait Posture 38, 253–259. Lin, H., Aubin, C.-É., Parent, S., Villemure, I., 2009. Mechanobiological bone growth: comparative analysis of two biomechanical modeling approaches. Med. Biol. Eng. Comput. 47, 357–366. Lin, Y.-C., Kim, H.J., Pandy, M.G., 2011. A computationally efficient method for assessing muscle function during human locomotion. Int. j. numer. method. biomed. eng. 27, 436– 449. Liu, M.Q., Anderson, F.C., Pandy, M.G., Delp, S.L., 2006. Muscles that support the body also modulate forward progression during walking. J. Biomech. 39, 2623–2630. Liu, M.Q., Anderson, F.C., Schwartz, M.H., Delp, S.L., 2008. Muscle contributions to support and progression over a range of walking speeds. J. Biomech. 41, 3243–3252. Lui, J.C., Baron, J., 2011. Effect of glucocorticoids on the growth plate. Endocr. Dev. 20, 187–193. Mackie, E.J., Ahmed, Y.A., Tatarczuch, L., Chen, K.-S., Mirams, M., 2008. Endochondral ossification: How cartilage is converted into bone in the developing skeleton. Int. J. Biochem. Cell Biol. 40, 46–62. Melrose, J., Smith, S., Smith, M., Little, C., 2008. The use of HistochoiceTM® for histological examination of articular and growth plate cartilages, intervertebral disc and meniscus. Biotech. Histochem. 83, 47–53. Murphy, S.B., Simon, S.R., Kijewski, P.K., Wikkinson, R.H., Griscom, T., 1987. Femoral anteversion. J. Bone Jt. Surg. 69-A, 1169–1176. Nilsson, O., Marino, R., De Luca, F., Phillip, M., Baron, J., 2005. Endocrine regulation of the growth plate. Horm. Res. 64, 157–165. Ogden, J.A., 2000. Skeletal injury in the child, Third. ed, Igarss 2014. Springer. Park, N., Lee, J., Sung, K.H., Park, M.S., Koo, S., 2014. Design and Validation of Automated Femoral Bone Morphology Measurments in Cerebral Palsy. J Digit Imaging 27, 262– 269. Pauwels, F., 1980. Biomechanics of the locomotor apparatus: Contribution on the functional anatomy of the locomotor apparatus, Springer-verlag Berlin Heidelberg New York. Phillips, a T.M., 2009. The femur as a musculo-skeletal construct: a free boundary condition modelling approach. Med. Eng. Phys. 31, 673–80. Piszczatowski, S., 2012. Geometrical aspects of growth plate modelling using Carter ’ s and Stokes ’ s approaches. Acta Bioeng. Biomech. 14, 93–106.
38 References Polgár, K., Gill, H.S., Viceconti, M., Murray, D.W., O’Connor, J.J., 2003. Strain distribution within the human femur due to physiological and simplified loading: finite element analysis using the muscle standardized femur model. Proc. Inst. Mech. Eng. H. 217, 173–189. Polgár, K., Gill, H.S., Viceconti, M., Murray, D.W., O’Connor, J.J., 2003. Development and numerical validation of a finite element model of the muscle standardized femur. Proc. Inst. Mech. Eng. Part H J. Eng. Med. 217, 165–172. Pourcelot, P., Defontaine, M., Ravary, B., Lemâtre, M., Crevier-Denoix, N., 2005. A noninvasive method of tendon force measurement. J. Biomech. 38, 2124–2129. Prilutsky, B.I., Herzog, W., Allinger, T.L., 1997. Forces of individual cat ankle extensor muscles during locomotion predicted using static optimization. J. Biomech. 30, 1025–33. Pritchett, J.W., 1992. Longitudinal growth and growth-plate activity in the lower extremity. Clin. Orthop. Relat. Res. 274–9. Provot, S., Schipani, E., 2005. Molecular mechanisms of endochondral bone development. Biochem. Biophys. Res. Commun. 328, 658–65. Rabier, B., Williams, A.J., Mallein-Gerin, F., Williams, G.R., Chassande, O., 2006. Thyroid hormone-stimulated differentiation of primary rib chondrocytes in vitro requires thyroid hormone receptor beta. J. Endocrinol. 191, 221–8. Rauch, F., 2005. Bone Growth in Length and Width : The Yin and Yang of Bone Stability. jounral of Musculoskelet Neuronal Interact 5, 194–201. Ravary, B., Pourcelot, P., Bortolussi, C., Konieczka, S., Crevier-Denoix, N., 2004. Strain and force transducers used in human and veterinary tendon and ligament biomechanical studies. Clin. Biomech. 19, 433–447. Rivkees, S. a, Bode, H.H., Crawford, J.D., 1988. Long-term growth in juvenile acquired hypothyroidism: the failure to achieve normal adult stature. N. Engl. J. Med. 318, 599– 602. Roach, H.I., Aigner, T., Kouri, J.B., 2004. Chondroptosis: a variant of apoptotic cell death in chondrocytes? Apoptosis 9, 265–77. Roach, H.I., Clarke, N.M., 1999. “Cell paralysis” as an intermediate stage in the programmed cell death of epiphyseal chondrocytes during development. J. Bone Miner. Res. 14, 1367–1378. Robling, A.., Duijvelaar, K.., Geevers, J.., Ohashi, N., Turner, C.., 2001. Modulation of appositional and longitudinal bone growth in the rat ulna by applied static and dynamic force. Bone 29, 105–113. Robson, H., Siebler, T., Shalet, S.M., Williams, G.R., 2002. Interactions between GH, IGF-I, glucocorticoids, and thyroid hormones during skeletal growth. Pediatr. Res. 52, 137–47.
P r i t i Y a d a v | 39 Sasaki, K., Neptune, R.R., 2010. Individual muscle contributions to the axial knee joint contact force during normal walking. J. Biomech. 43, 2780–2784. Scheys, L., Desloovere, K., Suetens, P., Jonkers, I., 2011. Level of subject-specific detail in musculoskeletal models affects hip moment arm length calculation during gait in pediatric subjects with increased femoral anteversion. J. Biomech. 44, 1346–53. Schneider, B., Laubenberger, J., Jemlich, S., Groene, K., Weber, H.M., Langer, M., 1997. Measurement of femoral antetorsion and tibial torsion by magnetic resonance imaging. Br. J. Radiol. 70, 575–579. Schuind, F., Garcia-Elias, M., Cooney, W.P., An, K.N., 1992. Flexor tendon forces: in vivo measurements. J. Hand Surg. Am. 17, 291–298. Sharan, K., Yadav, V.K., 2014. Hypothalamic control of bone metabolism. Best Pract. Res. Clin. Endocrinol. Metab. 28, 713–723. Shefelbine, S.J., 2002. Mechanical Regulation of Bone Growth Fronts and Growth Plates. Stanford University. Shefelbine, S.J., Carter, D.R., 2004a. Mechanobiological predictions of growth front morphology in developmental hip dysplasia. J. Orthop. Res. 22, 346–352. Shefelbine, S.J., Carter, D.R., 2004b. Mechanobiological predictions of femoral anteversion in cerebral palsy. Ann. Biomed. Eng. 32, 297–305. Shefelbine, S.J., Tardieu, C., Carter, D.R., 2002. Development of the femoral bicondylar angle in hominid bipedalism. Bone 30, 765–770. Smith, E.P., Boyd, J., Frank, G.R., Takahashi, H., Cohen, R.M., Specker, B., Williams, T.C., Lubahn, D.B., Korach, K.S., 1994. Estrogen Resistance Caused by a Mutation in the Estrogen-Receptor Gene in a Man. N. Engl. J. Med. 331, 1056–1061. Smith, J.W., 1962. The relationship of epiphysial plates to stress in some bones of the lower limb. J. Anat. 96, 58–78.2. Somerville, E., 1957. Persistent foetal alignment of the hip. J. Bone Jt. Surgery, Br. … 39 B, 106–113. Speirs, A.D., Heller, M.O., Duda, G.N., Taylor, W.R., 2007. Physiologically based boundary conditions in finite element modelling. J. Biomech. 40, 2318–2323. Stevens, S.S., Beaupré, G.S., Carter, D.R., 1999. Computer model of endochondral growth and ossification in long bones: biological and mechanobiological influences. J. Orthop. Res. 17, 646–653. St-Jacques, B., Hammerschmidt, M., McMahon, a P., 1999. Indian hedgehog signaling regulates proliferation and differentiation of chondrocytes and is essential for bone formation. Genes Dev. 13, 2072–2086.
40 References Stokes, I.A., Mente, P.L., Iatridis, J.C., Farnum, C.E., Aronsson, D.D., 2002. Enlargement of growth plate chondrocytes modulated by sustained mechanical loading. J. Bone Joint Surg. Am. 84-A, 1842–8. Stokes, I.A.F., 2002. Mechanical effects on skeletal growth. J. Musculoskelet. Neuronal Interact. 2, 277–280. Tamari, K., Tinley, P., Briffa, K., Breidahl, W., 2005. Validity and reliability of existing and modified clinical methods of measuring femoral and tibiofibular torsion in healthy subjects: use of different reference axes may improve reliability. Clin. Anat. 18, 46–55. Trepczik, B., Lienau, J., Schell, H., Epari, D.R., Thompson, M.S., Hoffmann, J.-E., KadowRomacker, A., Mundlos, S., Duda, G.N., 2007. Endochondral ossification in vitro is influenced by mechanical bending. Bone 40, 597–603. Trueta, J., Trias, A., 1961. The vascular contribution to osteogenesis. IV. The effect of pressure upon the epiphysial cartilage of rabbit. J. Bone Jt. Surg. 43-B, 800–813. Tsai, A.G., Reich, M.S., Bensusan, J., Ashworth, T., Marcus, R.E., Akkus, O., 2013. A fatigue loading model for investigation of iatrogenic subtrochanteric fractures of the femur. Clin. Biomech. 28, 981–987. Wakita, R., Izumi, T., Itoman, M., 1998. Thyroid hormone-induced chondrocyte terminal differentiation in rat femur organ culture. Cell Tissue Res 293, 357–364. Weiner, S., Wagner, H.D., 1998. The material bone: structure-mechanical function relations. Annu. Rev. Mater. Sci. 28, 271–298. Weise, M., De-Levi, S., Barnes, K.M., Gafni, R.I., Abad, V., Baron, J., 2001. Effects of estrogen on growth plate senescence and epiphyseal fusion. Proc. Natl. Acad. Sci. U. S. A. 98, 6871–6876. Wesseling, M., Derikx, L.C., de Groote, F., Bartels, W., Meyer, C., Verdonschot, N., Jonkers, I., 2015. Muscle optimization techniques impact the magnitude of calculated hip joint contact forces. J. Orthop. Res. 33, 430–438. Villemure, I., Stokes, I. a F., 2009. Growth plate mechanics and mechanobiology. A survey of present understanding. J. Biomech. 42, 1793–1803. Wong, M., Carter, D.R., 1988. Mechanical stress and morphogenetic endochondral ossification of the sternum. J. Bone Joint Surg. Am. 70, 992–1000. Wong, M., Carter, D.R., 1990. A theoretical model of endochondral ossification and bone architectural construction in long bone ontogeny. Anat Embryol 181, 523–532. Wu, G., Siegler, S., Allard, P., Kirtley, C., Leardini, A., Rosenbaum, D., Whittle, M., D’Lima, D.D., Cristofolini, L., Witte, H., Schmid, O., Stokes, I., 2002. ISB recommendation on definitions of joint coordinate system of various joints for the reporting of human joint motion - part I: ankle, hip, and spine. J. Biomech. 35, 543–548.
P r i t i Y a d a v | 41 Yadav, P., Shefelbine, S.J., Gutierrez-farewik, E.M., n.d. Effect of growth plate geometry and growth direction on prediction of proximal femoral morphology. Submitt. to J. Biomech. Zuege, R.C., Kempken, T.G., Blount, W.P., 1979. Epiphyseal stapling for angular deformity at the knee. J. Bone Joint Surg. Am. 61, 320–9.
Part II Papers
Paper 1
Yadav P., Shefelbine S.J., Gutierrez-Farewik E.M.
| 47
Effect of growth plate geometry and growth direction on prediction of proximal femoral morphology By Priti Yadav1,2 , Sandra J. Shefelbine4 , and Elena M. Gutierrez-Farewik1,2,3* 1
Department of Mechanics, Royal Institute of Technology, Sweden 2 KTH BioMEx Center, Royal Institute of Technology, Sweden 3 Department of Women’s & Children’s Health, KI, Sweden 4 Department of Mechanical and Industrial Engineering, Northeastern University, USA Submitted to Journal of Biomechanics
Mechanical stimuli play a significant role in the process of endochondral growth. Thus far, approaches to understand the endochondral mechanical growth rate have been limited to the use of approximated location and geometry of the growth plate (GP). Furthermore, growth has been simulated based on the average deformation of the GP or of the femoral neck, which is sensitive to boundary conditions in finite element (FE) analysis. Hence the current study objectives were (1) to evaluate the significance of a subject-specific FE model of the femur and GP compared to a generic GP model and (2) to explore the different growth direction models to better understand proximal femoral growth mechanisms. A subject-specific FE model of an able-bodied 7-year old child was developed. The muscle forces and hip contact force were computed for one gait cycle and applied to a FE model to determine the specific growth rate. Proximal femoral growth was simulated for two different growth direction models: minimum shear stress direction (MSSD) and femoral neck deformation direction (FNDD). The MSSD model showed a tendency to reduce the neck shaft angle for both GP geometry models and to reduce the femoral anteversion only for the subject-specific GP model. The FNDD model showed a tendency to decrease neck shaft angle and increase femoral anteversion for both GP models. The results of this study highlight the sensitivity of GP geometry and growth direction in growth simulation and cautiously recommend the subject-specific GP geometry and MSSD for correct prediction of proximal femoral growth morphology. Keywords: Deformity development, Specific growth rate, octahedral shear stress, Hydrostatic stress, MRI
48 Effect of growth plate geometry and growth direction on prediction of proximal femoral morphology 1. Introduction Longitudinal growth of long bones occurs in the cartilaginous epiphyseal growth plate, which is sandwiched between the epiphysis and diaphysis at the ends of long bones. The growth plate consists of three zones: the reserve zone at the epiphyseal end, the proliferative zone, and the hypertrophic zone towards the diaphysis. The reserve zone contains the resting chondrocytes, which enter into the proliferative zone, divide and arrange in column-wise orientation. In the hypertrophic zone, chondrocytes differentiate and enlarge to several times their original volume. Eventually, the chondrocytes undergo apoptosis, wherein intracellular calcium concentration increases and at a certain point chondrocytes start calcification in the zone of provisional calcification (Rauch, 2005). Due to the unidirectional growth behavior of the growth plate, growth is directed away from the proliferative zone, such that calcification occur towards the diaphysis end (Villemure and Stokes, 2009).
Growth plates are sensitive to their mechanical loadings; according to the Hueter-Volkmann principle, increase in static compression reduces the growth rate, and conversely, reduction in compressive loading increases the growth rate (Stokes, 2002). The Hueter-Volkmann principle, however, only considers uniaxial static loads acting on the growth plate, whereas bones are subjected to much more complex and three-dimensional dynamic loads during growth. Carter and Wong proposed a theory that accounts for the three-dimensional stress state (D.R. Carter et al., 1987). The theory states that endochondral growth and ossification are inhibited by cyclic or intermittent hydrostatic compressive stress and accelerated by cyclic or intermittent octahedral shear stress (s). Stevens et al. (1999) divided the specific growth rate (𝜀̇) into biological and mechanical growth rates. The biological growth rate depends on genetics, nutrients and hormones. The mechanical growth rate is defined by the osteogenic index (IO) – a linear combination of the maximum s and minimum hydrostatic stress (H) within the cartilage during a complete loading cycle (Stevens et al., 1999). Hence, the IO predicts increase in mechanical growth rate in regions of high s and high tensile H and decrease in regions of low s and high compressive H. Positive IO indicates where growth is likely to occur and negative IO, where growth is likely to be inhibited. The coefficient ratio of H and s in the IO are unknown and have been suggested as between 0.3 and 1 respectively (Wong and Carter, 1990).
Yadav P., Shefelbine S.J., Gutierrez-Farewik E.M.
| 49
Various studies have investigated the mechanical regulation of bone growth. The IO has been used to analyze the development of femur and hip joint morphology in early childhood (Shefelbine and Carter, 2004a, 2004b; Shefelbine et al., 2002). The most commonly analyzed femur morphology parameters are neck shaft angle (NSA) and femoral anteversion (FA). In able-bodied individuals, FA is approximately 40° at birth, 24° at age ten, 16° by mid-to-late adolescence and 15˚ at skeletal maturity (Carriero et al., 2011). Normal NSA is approximately 150° at birth, 140° in childhood, 125° in adulthood, and 120° in elderly (Isaac et al., 1997). Carriero et al. (2011) computed the IO over the surface of the growth plate in order to analyze how different gait patterns may lead to changes in NSA and FA over time. In all of these studies, the geometries of the femur and growth plate were generalized and simplified.
The proximal femoral growth plate morphology changes with the age; it has been described as concave at age two to three, approximately straight at age five, irregular at age seven, and convex at age 11-13 (Kandzierski et al., 2012). The importance of growth plate geometry for mechanical growth simulation has been reported in the literature (Guevara et al., 2015; Piszczatowski, 2012). In those studies, authors considered the different growth plate shapes (concave, convex, straight and irregular) and found that stresses and IO were sensitive to the growth plate geometry. In all of these studies, the femur and growth plate shapes have been approximated or based on a generic model. A subject-specific femur and growth plate model may improve growth prediction.
The IO predicts the amount of growth only; in order to accurately understand the growth trend, the direction of growth is also required. Carter and Wong’s theory does not intrinsically incorporate the resulting growth direction (Lin et al., 2009). It has been reported in an experimental study of immature rabbits that growth plate cartilage grows in the direction of deformation (Arkin and Katz, 1956). In this study, authors found a valgus deformity in the proximal tibia after it was casted in a valgus position for six weeks with no direct external stresses applied in the proximal region. Their histological analysis of the tibial growth plate showed orientation of chondrocyte columns in the deformation direction. All subsequent analyses on bone growth (Carriero et al., 2011; Shefelbine and Carter, 2004a, 2004b; Shefelbine et al., 2002) have considered the growth direction as an average deformation of either the growth plate or the femoral neck axis.
50 Effect of growth plate geometry and growth direction on prediction of proximal femoral morphology Further, the epiphyseal plate has a tendency to lie parallel to either maximum or minimum principal stress, which minimizes the shear stress between the epiphysis and diaphysis (Currey, 2002). Smith (1962) reported that the proximal femoral growth plate tends to lie parallel to principal tensile stress in the region of principal compressive stress and vice versa, hence practically free from shear stresses. Bright et al. (1974) also investigated in a rat tibia, that if subjected to shear, the cartilaginous epiphyseal plate breaks at rather low forces. Hence, it may be a valid speculation that growth occurs in the direction of minimum shear stress.
The current study aims to (1) develop a subject-specific finite element (FE) model of the femur and growth plate to evaluate its significance compared to a generic growth plate model, based on their computed IO, computed using able-bodied gait loading and (2) to investigate two different growth direction models – minimum shear stress direction (MSSD) and femoral neck deformation direction (FNDD) – to better understand proximal femoral growth mechanisms. This study will help to elucidate the importance of growth plate geometry and growth direction on the prediction of proximal femoral morphology.
2. Methods 2.1 Subject-Specific and Generalized Femur and Growth Plate CAD Model Development A subject-specific surface model of the left femur was constructed (Mimics, Materialise NV, Leuven, Belgium) using magnetic resonance imaging (MRI) data of an able-bodied 7-year boy (weight 23.8 kg, height 1.24 m). MRI data was collected at T1 contrast and in a neutral supine position. The slice thickness and distance between slices were 3 mm each (Ingenia 3.0T, Philips, Best, The Netherlands).
The NSA, FA, and femoral neck length were measured from the 3D surface model (Figure 1). The NSA was defined as the angle between neck and femoral shaft axes. FA was measured as the angle between femoral neck plane and condylar axes plane (Arnold et al., 2001; Murphy et al., 1987). The neck length was considered as the distance between the center of the femoral head and the intersection point of neck axis and femoral shaft axis (Park et al., 2014).
Yadav P., Shefelbine S.J., Gutierrez-Farewik E.M.
| 51
Figure 1: Geometrical description and subject measurement of proximal femoral morphology: Neck shaft angle (NSA), Femoral anteversion (FA) and Neck Length (NL).
To study the consequence of subject-specific growth plate geometry, a generic growth plate geometry was constructed for comparison. A simple disk shape growth plate model, as per Carriero et al. (2011), was constructed around the femoral neck region and considered as the generic growth plate model (Figure 2).
Figure 2: Generation of the finite element model of the femur and growth plate from the subject’s MRI data. The generic growth plate geometry was approximated as disk-like structure around femoral neck region
2.2 FE Modeling of the Femur A 3D volume was generated from the femur surface model. The femur model consisted of proximal and distal trabecular bone, bone marrow, cortical bone, and a proximal growth plate. A hexahedral dominant mesh was created for the femur model, consisting of approximately 200,000 elements, and the mesh was refined in the growth plate region (ANSYS Inc., Canonsburg, PA).
52 Effect of growth plate geometry and growth direction on prediction of proximal femoral morphology
The materials were modelled as linear elastic, isotropic and homogeneous. The moduli of elasticity for cortical bone, bone marrow, proximal trabecular bone and distal trabecular bone were considered as 20 GPa, 1 MPa, 58 MPa and 2942 MPa, respectively (Carriero et al., 2011; Goldstein, 1987). The growth plate was modeled with modulus of elasticity 6 MP and Poisson’s ratio of 0.49 (Shefelbine et al., 2002). The Poisson’s ratio value for all other materials was considered as 0.3 (Carriero et al., 2011). Transition zones were defined above and below the growth plate (Figure 3), where the modulus of elasticity was linearly varied from that of the growth plate to that of trabecular bone
Figure 3: Transition zones were created above and below the growth plate for linear transition of moduli of elasticity from that of trabecular bone (58 MPa) to that of the growth plate (6 MPa).
2.3 Gait Analysis and FE Boundary Conditions 3D gait analysis of the child was performed with an 8-camera motion analysis system (Vicon MX40, Oxford, UK) and two force platforms (Kistler, Winterthur, Switzerland). Thirty-five reflective 9-mm markers were attached to specific anatomical landmarks using a full-body model. The subject was encouraged to walk at his normal speed along the 10 m walkway.
A generic musculoskeletal model (SIMM, Musculographics Inc., Santa Rose, CA, USA) was scaled based on the marker positions during a measured static pose. The generic model consisted of 86 lower limb muscles and 36 degrees of freedom. The hip joint was modeled as a ball-and-socket joint. A deform tool was used to adjust the NSA, FA and neck length in the scaled model to match the subject’s geometry.
The muscle activation patterns for normal gait were estimated by performing inverse dynamics analysis, followed by static optimization with Hill-type muscle models and an objective function to minimize the sum of squared muscle stresses (Dynamics Pipeline, Musculographics Inc., Santa Rose, CA, USA). The computed muscle forces together with
Yadav P., Shefelbine S.J., Gutierrez-Farewik E.M.
| 53
external forces (including ground reaction forces, inertial forces, and gravity) were then input to a second inverse dynamics analysis to compute the hip contact force (HCF). The HCF was described in the femur coordinate system, as recommended by the International Society of Biomechanics (Wu et al., 2002).
In the FE analysis, one gait cycle was discretized into nine load instances; five load instances corresponded to initial contact, first peak, valley and second peak of the resultant HCF, and initial swing, and the remaining four load instances were midpoints between those five.
The muscles considered in FE analysis were gluteus maximus, gluteus medius, gluteus minimus, adductor longus, adductor magnus, adductor brevis, iliacus, pectineus, piriformis, psoas, quadratus femoris, gemellus, sartorius, biceps femoris short head, gastrocnemius, tensor fasciae latae, vastus intermedius, vastus lateralis and vastus medialis. All muscle forces were applied as concentrated forces at nodes located in the approximated centroids of their attachment sites, in the direction of the tendons. HCF was distributed over the nodes on the femoral head surface nearest the HCF’s line of action. The femur condyles were constrained in all directions (Figure 4).
Figure 4: Finite element boundary condition. The graph shows the 9 load instances considered for the analysis. The hip contact force (HCF) was distributed over the nodes on the femoral head surface closest to the force vector’s projection. The muscle forces were applied at the attachment sites in the tendon directions. The femoral condyles were constrained in all directions.
54 Effect of growth plate geometry and growth direction on prediction of proximal femoral morphology 2.4 Growth Analysis Growth Rate Computation: The 𝜀̇ was considered as the sum of biological (𝜀̇𝑏 ) and mechanical (𝜀̇𝑚 ) growth rates (Eq. 1). 𝜀̇ = 𝜀̇𝑏 + 𝜀̇𝑚
(1)
Previous studies report a growth rate in the proximal femur in a seven year old child to be approximately 9mm/year or 25 m/day (Pritchett, 1992). In the current study 𝜀̇𝑏 was considered to be 17 m/day; i.e., as per the observation that bones grow to approximately 50% normal size without mechanical loading (Hall and Herring 1990; Germiller and Goldstein 1997). The 𝜀̇𝑚 , was estimated by the IO (Stevens et al., 1999) as 𝜀̇𝑚 = 𝐼𝑜 = 𝑎 ∙ 𝑚𝑎𝑥𝜎Si + 𝑏 ∙ 𝑚𝑖𝑛𝜎Hi
𝑖 = 1, . . . . ,9
(2)
Stresses 𝜎𝑠 and 𝜎𝐻 at the hypertrophic (distal) surface of the growth plate were determined from FE analysis, and min and max refer to maximum 𝜎𝑠 and minimum 𝜎𝐻 obtained over the nine gait instances described above. Coefficients a and b determine the relative influence of 𝜎𝑠 and 𝜎𝐻 on IO. Consistent with previous studies, the b/a ratio was chosen as 0.5 (Carriero et al., 2011; Shefelbine and Carter, 2004a, 2004b). The magnitudes of a and b were chosen as 0.003 and 0.0015, respectively.
Model for Growth Direction: Speculated growth was simulated considering two different models. The FNDD was computed by average deformation of the neck. The MSSD could be aligned with either the maximum principal or the minimum principal stress directions. In the current work, the principal stress direction chosen was the one closer to the longitudinal axis. The growth plate’s distal surface elements were “grown” by the magnitude of the growth rate (𝜀̇), but in the directions as described aboved. The coordinate system was created such that the x-axis aligned with growth direction. The orthonormal thermal expansion capabilities of the FE solver were utilized with coefficient of thermal expansion of 1 in the x-direction and 0 in y- and z-directions. The 𝜀̇ was considered as the ‘temperature’ for expansion. The expanded model was considered as the model after growth.
Yadav P., Shefelbine S.J., Gutierrez-Farewik E.M.
| 55
2.5 Ethical approval and consent The study was approved by the regional ethical review board in Stockholm, Sweden. The participant with his parents provided written informed consent. 3. Results 3.1 Hip Contact Force The inferiorly-directed component accounted for the majority of resultant HCF vector (Figure 5). Two peaks were observed in the resultant HCF – at 18% and 50% of the gait cycle, at 6.5 and 4.6 times body weight, respectively.
Figure 5: Hip contact force (HCF) for one gait cycle of the able-bodied child, shown along the femoral coordinate system. The proximal femoral morphology of the musculoskeletal model used to compute this HCF was modified to match the subject data.
3.2 Subject-specific vs. generic growth plate geometry The sophistication of the growth plate geometry model had a large effect on computed s, H, and Io (Figure 6):
56 Effect of growth plate geometry and growth direction on prediction of proximal femoral morphology
Figure 6: Maximum octahedral shear stress, minimum hydrostatic stress and osteogenic index for the distal surface of the subject-specific and generic growth plate models. The plots shown are in anteriormedial plane of femoral coordinate system. The anterior (A), posterior (P), medial (M) and lateral (L) directions are indicated.
3.2.1 Subject-specific growth plate: Highest s was obtained in the posterior-medial region of the growth plate. H was found mostly compressive (H0) was found only in a portion of the lateral region. The most compressive H was found in the posterior-medial region. The IO was negative in the medial region and positive in the lateral region. The highest (maximum positive) IO was found in the most lateral region and lowest (maximum negative) near the center.
Yadav P., Shefelbine S.J., Gutierrez-Farewik E.M.
| 57
3.3 Effect of Growth Direction Model on prediction of proximal femoral morphology The growth direction model had a significant effect on prediction of proximal femoral morphology (Figure 7).
Figure 7: Proximal femoral geometry before (gray) and after (green) growth (scale factor: 200), from in the subject-specific and generic growth plate models, based on the two models for growth direction: the minimum shear stress direction (MSSD) and the femoral neck deformation direction (FNDD).
3.3.1 MSSD: NSA was found to decrease for both subject-specific and generic growth plate geometries. FA was found to slightly decrease in the subject-specific geometry whereas almost no change was observed in the generic geometry.
3.3.2 FNDD: For both subject-specific and generic growth plate geometries, NSA decreased and FA increased. 4. Discussion In the current study, we demonstrate that simulated morphological changes of the proximal femur during childhood due to the stresses at the epiphysial hypertrophic zone induced by walking are sensitive to both the considered growth direction and to the growth plate geometry.
58 Effect of growth plate geometry and growth direction on prediction of proximal femoral morphology
The geometry and location of the growth plate affect the stress distribution and hence IO (Guevara et al., 2015; Piszczatowski, 2012).. The subject-specific growth plate was contained within the femoral head, and its geometry was irregular. The generic growth plate was, on the other hand, located along the femoral neck, and was shaped like a disk as per a previous study (Carriero et al., 2011). Furthermore, in the current study, femur geometry was subject-specific whereas in the cited study, the femur model was generic and based on an adult American male population. In agreement with that previous study, higher IO was found on the lateral side than on the medial side, and is likely due to the tensile H in this region of the generic growth plate. The subject-specific growth plate showed highest IO in the posterior region due to higher s in that region. To the best of authors’ knowledge, this is the first study in which IO was computed for a subject-specific femur and growth plate model using subject-specific loading. Based on our observed dependence of IO on model sophistication, we demonstrate that for accurate growth prediction, a FE model creation based on medical imaging is required.
Carriero et al. (2011) used neck deformation to model growth direction and found a decrease in NSA and increase in FA, which we corroborated in the current study with the generic geometry and the FNDD model. Femoral deformation is highly sensitive to the material properties and boundary conditions in the FE model, and caution is therefore recommended before assuming that the FNDD can accurately predict growth direction.
Stresses, on the other hand, are less sensitive than deformation to boundary conditions. In a preliminary study we found that femoral head and neck region stresses are mostly due to the HCF, whereas muscle forces help to mitigate the femoral head deformation; it was for this reason, that we modelled growth in the MSSD. This model philosophy has some precedent; Smith (1962) reported that growth plates tend to lie parallel to maximum or minimum principal stresses, such that shear stress between the epiphysis and the diaphysis is minimized. Considering the fact that the growth plate may tend to ossify in the region of shear stress, growth was simulated in the minimum shear direction, i.e. maximum principal or minimum principal direction. This model for growth direction showed a tendency to reduce the NSA and FA in the subject-specific geometry, but only to reduce the NSA in the generic geometry.
Yadav P., Shefelbine S.J., Gutierrez-Farewik E.M.
| 59
When interpreting the results of this study, a number of limitations should be taken into account. The 𝜀̇ prediction is sensitive to the relative influence of biological and mechanical factors. In the present study, the biological growth rate was assumed to be twice that of the mechanical growth rate, in agreement with previous studies showing that most of the bone growth during endochondral ossification is due to biological factors. It has been reported that mechanical factors are likely to play a larger role early in development and have a smaller influence on the bone shape closer to skeletal maturity (Matsuda et al. 1986; Raab et al. 1990; Wallace et al. 2007). The 𝜀̇ presented here was a sum of these two factors. A larger or smaller biological growth component would under- or overestimate, respectively, the predicted growth and direction. Similarly, different b/a ratios can change both the nature (promoting/inhibiting) and magnitiude of IO, and thus the growth rate for the same region of the growth plate. An accurate b/a ratio,, though currently unknown, would be crucial for accurate simulation and prediction of bone morphology over a long period of time.
Simulating growth in the MSSD showed a tendency to reduce the NSA and FA for the ablebodied child, which could be a prognosis of the expected progression during childhood, i.e. both of these angles decrease during childhood in able-bodied individuals (Isaac et al., 1997; Jenkins et al., 2003; Schneider et al., 1997; Tamari et al., 2005). As we have only considered one subject, caution is recommended before reaching conclusions on the validity of the MSSD model; further evaluation of growth simulation with a larger population of able-bodied children and a validation with medical imaging over a long time period are required to better understand the mechanisms of growth. Furthermore, the present study only considered loading to gait, whereas a large number of activities and loading conditions occur during childhood.
The linear elastic, isotropic, and homogeneous material model considered in this analysis may have limited the model’s accuracy. All the material properties considered in the current analysis were obtained from published data (Carriero et al., 2011; Goldstein, 1987; Shefelbine et al., 2002). However, since this study is the comparison of how growth plate geometry and growth direction affect growth simulation, the relative behavior of the model, rather than the precise results, forms the basis for our conclusions.
In conclusion, loading due to growth during childhood, as modelled by the subject-specific femur and growth plate model developed in this study, showed a tendency to reduce NSA and
60 Effect of growth plate geometry and growth direction on prediction of proximal femoral morphology FA when growth was modelled in minimum shear stress direction. Predictive models of proximal femoral growth, and therefore morphology, are sensitive to the growth direction used and to the sophistication of the geometric model. Future work will focus on prediction and validation of the proximal femoral morphology for a larger group of able-bodied children and for children with neuromuscular disorders affecting gait. Understanding bone growth tendency and its sensitivity to different parameters can help in better clinical treatment development for children with affected gait and muscle activations. Conflict of interest None of the authors had any financial or personal conflict of interest with regard to this study. Acknowledgments This work was generously funded by the Promobilia Foundation. The authors would like to thank the subject and his parents for their participation. We would also like to thank Dr. Eva Pontén, Dr. Thröstur Finnbogason and Anna Lind for their help in MRI data collection. We also acknowledge Marta Björnsdóttir for preliminary analysis related to this study. References Arkin, A.M., Katz, J.F., 1956. The effects of pressure on epiphyseal growth; the mechanism of plasticity of growing bone. J. Bone Joint Surg. Am. 38-A, 1056–1076. Arnold, A.S., Blemker, S.S., Delp, S.L., 2001. Evaluation of a Deformable Musculoskeletal Model for Estimating Muscle–Tendon Lengths During Crouch Gait. Ann. Biomed. Eng. 29, 263–274. Bright, R.W., Burstein, a H., Elmore, S.M., 1974. Epiphyseal-plate cartilage. A biomechanical and histological analysis of failure modes. J. Bone Joint Surg. Am. 56, 688–703. Carriero, A., Jonkers, I., Shefelbine, S.J., 2011. Mechanobiological prediction of proximal femoral deformities in children with cerebral palsy. Comput. Methods Biomech. Biomed. Engin. 14, 253–262. Carter, D.R., Orr, T.E., Fyhrie, D.., Schurman, D.J., 1987. Influences of mechanical stress on prenatal and postnatal skeletal development. Clin. Orthop. Relat. Res. 237–250. Currey, J.D., 2002. Bones: Structure and Mechanics, 2nd ed. Princeton University Press. Goldstein, S.A., 1987. The Mechanical Properties of Trabecular Bone:Dependence On Anatomic Location And Function. J. Biomech. 20, 1055–1061.
Yadav P., Shefelbine S.J., Gutierrez-Farewik E.M.
| 61
Guevara, J.M., Moncayo, M.A., Vaca-González, J.J., Gutiérrez, M.L., Barrera, L.A., GarzónAlvarado, D.A., 2015. Growth plate stress distribution implications during bone development: A simple framework computational approach. Comput. Methods Programs Biomed. 118, 59–68. Isaac, B., Vettivel, S., Prasad, R., Jeyaseelan, L., 1997. Prediction of the Femoral Neck-Shaft Angle From the Length of the Femoral Neck. Clin. Anat. 10, 318–323. Jenkins, S.E.M., Harrington, M.E., Zavatsky, A.B., O’Connor, J.J., Theologis, T.N., 2003. Femoral muscle attachment locations in children and adults, and their prediction from clinical measurement. Gait Posture 18, 13–22. Kandzierski, G., Matuszewski, L., Wójcik, A., 2012. Shape of growth plate of proximal femur in children and its significance in the aetiology of slipped capital femoral epiphysis. Int. Orthop. 36, 2513–2520. Lin, H., Aubin, C.-É., Parent, S., Villemure, I., 2009. Mechanobiological bone growth: comparative analysis of two biomechanical modeling approaches. Med. Biol. Eng. Comput. 47, 357–366. Murphy, S.B., Simon, S.R., Kijewski, P.K., Wikkinson, R.H., Griscom, T., 1987. Femoral anteversion. J. Bone Jt. Surg. 69-A, 1169–1176. Park, N., Lee, J., Sung, K.H., Park, M.S., Koo, S., 2014. Design and Validation of Automated Femoral Bone Morphology Measurments in Cerebral Palsy. J Digit Imaging 27, 262– 269. Piszczatowski, S., 2012. Geometrical aspects of growth plate modelling using Carter ’ s and Stokes ’ s approaches. Acta Bioeng. Biomech. 14, 93–106. Pritchett, J.W., 1992. Longitudinal growth and growth-plate activity in the lower extremity. Clin. Orthop. Relat. Res. 274–9. Rauch, F., 2005. Bone Growth in Length and Width : The Yin and Yang of Bone Stability. jounral of Musculoskelet Neuronal Interact 5, 194–201. Schneider, B., Laubenberger, J., Jemlich, S., Groene, K., Weber, H.M., Langer, M., 1997. Measurement of femoral antetorsion and tibial torsion by magnetic resonance imaging. Br. J. Radiol. 70, 575–579. Shefelbine, S.J., Carter, D.R., 2004a. Mechanobiological predictions of femoral anteversion in cerebral palsy. Ann. Biomed. Eng. 32, 297–305. Shefelbine, S.J., Carter, D.R., 2004b. Mechanobiological predictions of growth front morphology in developmental hip dysplasia. J. Orthop. Res. 22, 346–352. Shefelbine, S.J., Tardieu, C., Carter, D.R., 2002. Development of the femoral bicondylar angle in hominid bipedalism. Bone 30, 765–770.
62 Effect of growth plate geometry and growth direction on prediction of proximal femoral morphology Smith, J.W., 1962. The relationship of epiphysial plates to stress in some bones of the lower limb. J. Anat. 96, 58–78.2. Stevens, S.S., Beaupré, G.S., Carter, D.R., 1999. Computer model of endochondral growth and ossification in long bones: biological and mechanobiological influences. J. Orthop. Res. 17, 646–653. Stokes, I.A.F., 2002. Mechanical effects on skeletal growth. J. Musculoskelet. Neuronal Interact. 2, 277–280. Tamari, K., Tinley, P., Briffa, K., Breidahl, W., 2005. Validity and reliability of existing and modified clinical methods of measuring femoral and tibiofibular torsion in healthy subjects: use of different reference axes may improve reliability. Clin. Anat. 18, 46–55. Villemure, I., Stokes, I. a F., 2009. Growth plate mechanics and mechanobiology. A survey of present understanding. J. Biomech. 42, 1793–1803. Wong, M., Carter, D.R., 1990. A theoretical model of endochondral ossification and bone architectural construction in long bone ontogeny. Anat Embryol 181, 523–532. Wu, G., Siegler, S., Allard, P., Kirtley, C., Leardini, A., Rosenbaum, D., Whittle, M., D’Lima, D.D., Cristofolini, L., Witte, H., Schmid, O., Stokes, I., 2002. ISB recommendation on definitions of joint coordinate system of various joints for the reporting of human joint motion - part I: ankle, hip, and spine. J. Biomech. 35, 543–548.
Paper 2
Yadav P., Shefelbine S.J., Gutierrez-Farewik E.M.
| 65
Influence of muscle groups’ activation on proximal femoral growth tendency By Priti Yadav1,2 , Sandra J. Shefelbine4 , and Elena M. Gutierrez-Farewik1,2,3* 1
Department of Mechanics, Royal Institute of Technology, Sweden 2 KTH BioMEx Center, Royal Institute of Technology, Sweden 3 Department of Women’s & Children’s Health, KI, Sweden 4 Department of Mechanical and Industrial Engineering, Northeastern University, USA To be submitted
Longitudinal growth of long bones occurs at growth plates and is sensitive to mechanical loading. Muscle forces and joint contact forces influence bone growth and resulting morphology, such as neck shaft angle (NSA) and femoral anteversion (FA). Consequences of altered loading on bone growth occur in children with gait disorders e.g. cerebral palsy, who often have altered NSA and FA. This study aims to understand how different muscle groups’ activation during gait affects the stresses in the growth plate tissue, influencing NSA and FA development in able-bodied children. Subject-specific femur models with growth plates were developed for three able-bodied children (ages 6, 7, and 11 years) using magnetic resonance images. The contribution of different muscle groups – hip flexors, hip extensors, hip adductors, hip abductors, and knee extensors – to the overall hip contact force was computed. We used the osteogenic index to compute the local specific growth rates across the growth plate. We simulated growth by growing the model in the minimum shear stress direction at each node in the growth front. The predicted growth indicated a tendency for decreased NSA and FA in able-bodied children, which agrees with well-documented morphological changes during growth. Hip abductors contributed the most, and hip adductors, the least, to specific growth rate magnitude. Hip adductor force tended to maintain the NSA, whereas as other muscle groups’ forces tended to decrease the NSA. Hip flexors, hip abductors and knee extensors tended to decrease the FA, whereas hip extensors and adductors tended to increase the FA. Understanding the influence of different muscle groups on long bone growth tendency can help in better treatment planning for growing children with affected gait. Keywords: Osteogenic Index, growth plate, Femur, Subject specific, Finite element analysis
66 Influence of muscle groups’ activation on proximal femoral growth tendency 1. Introduction Muscle forces on a growing bone influence bone morphology. The relationship between muscle force and bone growth potential is observed in the clinical presentation of children with neuromuscular pathologies, for instance, cerebral palsy (CP). The bones to which spastic muscles are attached commonly develop deformity (Gage et al., 2009).
The longitudinal growth of long bones occurs at growth plates located between the epiphysis and the diaphysis. The epiphyseal growth plate has unidirectional growth behavior; growth occurs on the diaphyseal side (Villemure and Stokes, 2009).
Growth plates are sensitive to their mechanical loading. Mechanobiological theories have hypothesized that endochondral growth and ossification are inhibited by cyclic hydrostatic compressive stress and accelerated by cyclic octahedral shear stress (D.R. Carter et al., 1987). The mechanobiological contribution to the growth rate can be defined as the osteogenic index (IO) – a linear combination of the maximum octahedral shear stress (s) and minimum hydrostatic stress (H) within the cartilage during a loading cycle (Stevens et al., 1999). IO predicts increase in growth rate in regions of high s and high tensile H and decrease in regions of low s and high compressive H. This theory does not, however, intrinsically describe the resulting growth direction (Lin et al., 2009).
It has been reported that the epiphyseal plate has a tendency to lie parallel to either maximum or minimum principal stress, minimizing the shear stress between the epiphysis and diaphysis (Currey, 2002). Smith (1962) found that the proximal femoral growth plate tends to lie parallel to principal tensile stress in the region of principal compressive stress and vice versa, hence practically free from shear stresses. Bright et al. (1974) also investigated in a rat tibia that, if subjected to shear, the cartilaginous epiphyseal plate breaks at low forces. Hence, we propose that growth occurs in the direction of principal stress (minimum shear stress).
The osteogenic index has been used to investigate the involvement of muscles and joint contact forces in the formation of coxa valga in developmental hip dysplasia (Shefelbine and Carter, 2004a) and to predict femoral anteversion in cerebral palsy (Shefelbine and Carter, 2004b). It has also been reported that abnormal muscle and joint contact forces may lead to development of bone deformities such as higher neck shaft angle (NSA) and femoral
Yadav P., Shefelbine S.J., Gutierrez-Farewik E.M.
| 67
anteversion (FA) (Carriero et al. 2011). The higher FA in children affected with CP is considered to be related to abnormal hip rotator muscle forces (Cibulka, 2004). Contracted hamstrings and hip flexors can cause a crouch gait pattern (Gage 1990) and thereby abnormally loading the bone. Joint contact forces are largely due to muscles forces and associated ground reaction forces; muscles are one of the primary contributors to the mechanics that influence growth. To our knowledge, however, bone growth tendency due to different muscles groups’ forces have not been studied. The current study aims to understand how different muscle groups’ activation during ablebodied children’s normal gait influences proximal femoral growth tendency. This study will help to elucidate the dominance of different muscle groups on proximal femoral morphological characteristics. 2. Methods 2.1 Data collection
Three typically-developing (TD) children participated in this study. Three-dimensional gait analysis of the subjects was performed with an 8-camera motion analysis system (Vicon MX40, Oxford, UK) and two force platforms (Kistler, Winterthur, Switzerland). Thirty-five reflective 9-mm markers were attached to specific anatomical landmarks using a full-body model. The subjects were encouraged to walk at a comfortable speed along a 10-m walkway.
Magnetic resonance (MR) images of the lower body in a neutral supine position were collected for each subject at T1 contrast. The slice thickness and distance between slices were 3 mm each (Ingenia 3.0T, Philips, Best, The Netherlands).
2.2 Force computation 2.2.1 Musculoskeletal model Subject-specific femur surface models were constructed using each subject’s MR images (Mimics, Materialise NV, Leuven, Belgium). The NSA and FA were measured from the 3D surface model (Table 1). The NSA was defined as the angle between neck and femoral shaft axes. FA was measured as the angle between femoral neck plane and condylar axes plane (Arnold et al., 2001; Murphy et al., 1987). A generic musculoskeletal model (SIMM,
68 Influence of muscle groups’ activation on proximal femoral growth tendency Musculographics Inc., Santa Rosa, CA, USA) was scaled based on marker positions during a static pose. The generic model consisted of 86 lower limb muscles and 36 degrees of freedom. The hip joint was modeled as a ball-and-socket joint. A deform tool was used to adjust the NSA and FA in the scaled model to match each subject’s geometry. Table 1: Geometrical description and subject measurement of proximal femoral morphology. Abbreviations: Neck shaft angle (NSA), Femoral anteversion (FA)
Subject 1
Subject 2
Subject 3
6
7
11
Weight (kg)
20.7
23.8
49.5
NSA (deg)
140
136
138
FA (deg)
34
33
18
Age (y)
2.2.2 Muscles forces and hip contact force computation
The muscle activation patterns for normal gait were estimated by performing inverse dynamics analysis, followed by static optimization with Hill-type muscle models and an objective function to minimize the sum of squared muscle stresses (Dynamics Pipeline, Musculographics Inc., Santa Rosa, CA, USA). The computed muscle forces together with external forces, including ground reaction forces, inertial forces and gravity, were then input to a second inverse dynamics analysis to compute the resultant hip contact force (HCF).
2.2.3 Contribution of muscle groups to resultant HCF
To study the effect of different muscle groups on proximal femoral growth tendency, the contribution of individual muscle groups to the resultant HCF was determined. The GRF was decomposed into a number of components due muscle groups’ forces, using inverse acceleration analysis (Lin et al., 2011). Each muscle group’s forces computed from the optimization solution, together with its GRF component were applied to the model, and the equations of motion were solved to calculate the contribution of following muscle groups to the resultant HCF.
Yadav P., Shefelbine S.J., Gutierrez-Farewik E.M.
| 69
Case 1: All muscles, from section 2.2.2. Case 1 indicates the resultant HCF. Case 2: Hip flexors (pectineus, iliacus, psoas, tensor fasciae latae, sartorius, rectus femoris) Case 3: Hip extensors (gluteus maximus, biceps femoris) Case 4: Hip adductors (adductor longus, adductor brevis, adductor magnus, pectineus, quadratus femoris, gracilis) Case 5. Hip abductors (gluteus medius, gluteus minimus, gemellus, piriformis, tensor fasciae latae) Case 6: Knee extensors (rectus femoris, vastus medialis, vastus lateralis, vastus intermedius)
The HCF was described in the femur coordinate system recommended by the International Society of Biomechanics (Wu et al., 2002).
2.3 Finite element analysis 2.3.1 Mesh and material
3D solid models were generated from the femur surface models. Each femur model consisted of proximal and distal trabecular bone, bone marrow, cortical bone, and a proximal growth plate (Figure 1). A hexahedral dominant mesh was created for the femur models, consisting of approximately 200,000 elements and the mesh was refined in the growth plate region (ANSYS Inc., Canonsburg, PA).
All materials were modeled as linear elastic, isotropic, and homogeneous. The moduli of elasticity for cortical bone, bone marrow, proximal trabecular bone, and distal trabecular bone were considered as 20 GPa, 1 MPa, 58 MPa, and 2942 MPa, respectively (Carriero et al., 2011; Goldstein, 1987). The growth plate was modeled with a modulus of elasticity 6 MPa and Poisson’s ratio of 0.49 (Shefelbine et al., 2002). The Poisson’s ratio value for all other materials was considered as 0.3 (Carriero et al., 2011). Transition zones were defined immediately above and below the growth plate, where the modulus of elasticity was linearly varied from that of the growth plate to that of trabecular bone.
70 Influence of muscle groups’ activation on proximal femoral growth tendency
Figure 1: (a) Subject-specific femur model with its components. (b) Proximal femur and proximal femoral growth plate model. The orientation of growth plate is shown in right-upper corner.
2.3.2 Loading and boundary conditions
In the finite element (FE) analysis, one gait cycle was discretized into nine load instances; five load instances corresponded to initial contact, first peak, valley and second peak of the resultant HCF of Case 1, and initial swing, and the remaining four load instances were midpoints between those five.
Each muscle forces was applied as a concentrated force at a node at the approximated centroid of its attachment site, in the direction of the tendon. The HCF was distributed over the nodes on the femoral head surface nearest the HCF’s line of action. Femoral condyles were constrained in all directions (Figure 2).
Figure 2: Finite element model and boundary condition. The femoral condyles were constrained in all directions. The hip contact force was distributed over the nodes on the femoral head surface nearest the force vector’s projection.
Yadav P., Shefelbine S.J., Gutierrez-Farewik E.M.
| 71
2.4 Growth analysis The specific growth rate (𝜀̇) is considered to be the sum of biological (𝜀̇𝑏 ) and mechanical (𝜀̇𝑚 ) growth rates (Eq. 1). 𝜀̇ = 𝜀̇𝑏 + 𝜀̇𝑚
(1)
Previous studies have reported growth rates in the proximal femur of 9 mm/year (25 m/day) and 6 mm/year (16 m/day) for seven and eleven year old children, respectively (Pritchett, 1992). In the current study, 𝜀̇𝑏 for subjects 1 and 2 (age 7 and 6, respectively) was considered to be 17 m/day, and for subject 3 (age 11), 11 m/day, as per the observation that bones grow to approximately 50% normal size without mechanical loading (Hall and Herring 1990; Germiller and Goldstein 1997). The 𝜀̇𝑚 , as estimated by the IO (Stevens et al., 1999), was computed as: 𝜀̇𝑚 = 𝐼𝑜 = 𝑎 ∙ 𝑚𝑎𝑥𝜎Si + 𝑏 ∙ 𝑚𝑖𝑛𝜎Hi
𝑖 = 1, . . . . ,9
(2)
Stresses 𝜎𝑠 and 𝜎𝐻 at the hypertrophic (distal) surface of the growth plate were determined from FE analysis. For Case 1, max and min refer to maximum 𝜎𝑠 and minimum 𝜎𝐻 obtained over the nine gait instances during the gait cycle. For Cases 2 – 6, 𝜎S and 𝜎𝐻 were determined as stresses during the same load instances in which they were maximum and minimum, respectively, in Case 1. Coefficients a and b determine the relative influence of 𝜎𝑠 and 𝜎𝐻 on IO. Consistent with previous studies, the b/a ratio was chosen as 0.5 (Carriero et al., 2011; Shefelbine and Carter, 2004a, 2004b). The magnitudes of a and b were found by solving the Equations (3) and (4) for all three subjects. 𝑏 = 0.5𝑎
𝜀̇𝑚 (=
𝜀̇𝑏⁄ 2) = 𝑎(𝑚𝑎𝑥𝜎Si + 0.5𝑚𝑖𝑛𝜎Hi ) ,
(3)
𝑖 = 1, . . . . ,9
(4)
72 Influence of muscle groups’ activation on proximal femoral growth tendency The growth direction was determined as the average of minimum shear stress direction obtained in the 9 load instances. The distal surface elements of growth plate were “grown” by the magnitude of the growth rate (𝜀̇), in the growth direction. The minimum shear stress direction could be aligned with either the maximum principal or the minimum principal stress directions. We chose the principal stress direction that was aligned most closely with the longitudinal axis. The new coordinate system for growth simulation was created such that the x axis aligned with growth direction. The orthonormal thermal expansion capabilities of the FE solver were utilized with coefficient of thermal expansion of 1 in the x direction and 0 in y and z directions. The 𝜀̇ was considered as the ‘temperature’ for expansion. The thermally expanded model was considered as the model after growth.
2.5 Ethical approval and consent The study was approved by the regional ethical review board in Stockholm, Sweden. The participants with their parents provided written informed consent. 3. Results 3.1 Hip contact force 3.1.1 HCF for different subjects The computed HCFs for all the three subjects were very similar (Figure 3). The HCF was found acting in the posterior, inferior and lateral direction for all the subjects. The resultant HCF was domimated by the inferior direction component. The inferior, posterior, and lateral direction peak HCF magnitudes were approximately 6, 2, and 2 times body weight, respectively.
Figure 3: The computed hip contact force for all three subjects. In the graph vertical axis represents HCF (x BW) and horizontal axis represents percentage of gait.
Yadav P., Shefelbine S.J., Gutierrez-Farewik E.M.
| 73
3.1.2 Contribution of different muscle groups to resultant HCF The contribution of different muscle groups to the resultant HCF is shown in Figure 4. The directions of HCF components for Cases 2 (Hip flexors), 4 (Hip adductors), 5 (Hip abductors) and 6 (Knee extensors) were similar as in the Case 1 (All muscles), but Case 3 (Hip extensors) produced a HCF component acting in the inferior, anterior and lateral directions. Case 5 (Hip abductors) contributed most to the resultant HCF in all directions. Cases 3 (Hip extensors) and 6 (Knee extensors) contributed considerably at the 1st peak of the inferior component of the HCF, and Case 2 (Hip flexors), at the 2nd peak of inferior HCF. Case 4 (Hip adductors) contributed least to the resultant HCF during gait.
Figure 4: The computed components of different muscle groups to the resultant HCF for subject 2. In the graph vertical axis represents HCF (x BW) and horizontal axis represents percentage of gait.
3.2 Growth tendency 3.2.1 Overall stresses and growth tendencies The computed octahedral shear stress, hydrostatic stress and specific growth rate due to gait loading for all three subjects are shown in Figure 5. The patterns of overall stresses and specific growth rates were similar for the three subjects, but the magnitudes varied somewhat. The maximum octahedral shear stress was found in the posterior region of the growth plate for all subjects. The hydrostatic stress was found entirely compressive for Subject 1, but for
74 Influence of muscle groups’ activation on proximal femoral growth tendency Subjects 2 and 3, tensile hydrostatic stresses were observed in the anterior-lateral region. The maximum specific growth rate was found in the posterior region, and the minimum, around the center of the growth plate for all subjects. The predicted growth tendencies for all three subjects are illustrated in Figure 6. Subject 1 and 2 showed a tendency for reduced NSA and FA during growth. Predicted proximal femur morphology was largely unchanged for Subject 3.
Figure 5: Octahedral shear stress, hydrostatic stress, and specific growth rate on distal growth plate surface during gait loading for all three subjects.
Yadav P., Shefelbine S.J., Gutierrez-Farewik E.M.
| 75
Figure 6: Illustration of coronal and transverse plane deformations (exaggerated view) before (black color) and after (green color) growth simulation for all three subjects. The growth simulation was performed for gait loading. Deformation in the coronal and transverse plane represents the qualitative tendency to influence the NSA, and FA respectively.
3.2.2 Growth tendency due to different muscle groups Stresses and specific growth rates (Figure 7) and predicted growth tendency (Figure 8) for Cases 2-6 are illustrated for Subject 2. Case 2 (Hip flexors): The overall octahedral shear stress, hydrostatic stress, and specific growth rate magnitudes were lowest in Case 2 than in all other cases. This load case showed the tendency to reduce NSA and FA. Case 3 (Hip extensors): The maximum octahedral shear stress was in the posterior section of the growth plate, and the maximum compressive hydrostatic stress was around the center. The specific growth rate was highest in the posterior-lateral region and lowest around the center of the growth plate. This load case showed a tendency to decrease the NSA and increase the FA.
76 Influence of muscle groups’ activation on proximal femoral growth tendency
Figure 7: Octahedral shear stress, hydrostatic stress and specific growth rate distribution over the distal surface of the femoral proximal growth plate due to different muscle groups’ forces.
Case 4 (Hip adductors): The octahedral shear stress, hydrostatic stress, and specific growth rate magnitudes were found similar to Case 2. This load case showed a tendency to maintain a similar NSA and increase the FA. Case 5 (Hip abductors): The octahedral shear stress, hydrostatic stress and specific growth rate magnitudes were highest in Case 5 than in all other cases. Maximum octahedral shear stress was in the posterior region of the growth plate, and maximum compressive hydrostatic stress was around the center and posterior-lateral region. The specific growth rate was maximum in the posterior region and minimum in the posterior-lateral region of the growth plate. This load case showed a tendency to reduce the NSA and FA. Case 6 (Knee extensors): The maximum octahedral shear stress was in the posterior region of the growth plate, and the maximum compressive hydrostatic stress was around the center. The specific growth rate was highest in the medial, posterior and lateral regions of the growth plate and lowest around the center. This load case showed a tendency to reduce the NSA and FA.
Yadav P., Shefelbine S.J., Gutierrez-Farewik E.M.
| 77
Figure 8: Illustration of coronal plane and transverse plane deformation (exaggerated view) before (black color) and after (green color) growth simulation due to different muscle groups’ forces during gait. Deformation in the coronal and transverse plane represents the qualitative tendency to influence the NSA, and FA respectively.
4. Discussion The main finding of the present study was that during gait in able-bodied children, hip abductor force contributes most to the proximal femoral growth development by reducing the NSA and FA.
The growth rate and growth direction are based on stresses at the growth plate; accurate femur and growth plate geometry is thereby critical input for reasonable growth simulations. To our knowledge this is the first FE analysis study of the proximal femur growth plate to create subject-specific femur and growth plate models; previous studies on growth simulation were based on generic femur and growth plate geometries (Carriero et al., 2011; Shefelbine and
78 Influence of muscle groups’ activation on proximal femoral growth tendency Carter, 2004a, 2004b; Shefelbine et al., 2002). We found that growth plate location and geometry varied among our subjects.
Longitudinal growth of the long bone at the epiphyseal growth plate is in part mechanically modulated (Stokes, 2002); the muscle and joint contact forces can regulate to some extent the femur and hip joint morphology in growing children. Carriero et al. (2011) reported the variation in NSA and FA development due to different gait patterns. The current study demonstrates how different muscle groups can influence these parameters. In able-bodied children, proximal femoral growth is most affected by hip abductors and least by hip adductors. Even muscle groups that do not span the hip can influence the growth, since they can influence the HCF. To our knowledge, this is the first study to report the influence of different muscle groups on proximal femoral growth tendency.
In the present study, growth direction was considered as the average of minimum shear stress directions (principal stress directions) found in 9 load instances. In all previous bone growth studies (Carriero et al., 2011; Shefelbine and Carter, 2004a, 2004b; Shefelbine et al., 2002), growth was predicted based on direction of deformation (Arkin and Katz, 1956). In a previous study, we compared these growth direction models – deformation direction and minimum shear stress direction – and concluded that for numerical simulations of growth, the minimum shear stress direction is preferable as it is less sensitive to the applied boundary conditions in finite element analysis than the deformation direction (Yadav et al., n.d.).
There were several limitations to this study. First, in this study influence of different muscle groups on longitudinal growth was analyzed, but muscle groups can also influence the radial growth of the bone. Radial growth may change the location and orientation of the shaft axis and hence NSA and FA. In the current study, morphological changes that may affect the NSA and FA should therefore be considered qualitatively, rather than quantitatively.
In the current work, growth tendency due to growth at the proximal growth plate was simulated. Somerville (1957) reported that femoral anteversion decreases in response to stresses applied to the proximal femur. It is, however, possible that growth at the distal femur may also affect NSA and FA by affecting the femur shaft axis and condylar axis orientations. Hence for better estimation of the proximal femoral morphological changes, studies using subject-specific femur models with both proximal and distal growth plates are suggested.
Yadav P., Shefelbine S.J., Gutierrez-Farewik E.M.
| 79
Growth was simulated only for loading during gait whereas growing children of course perform many other activities daily, like jumping, running, playing sports, and even sitting and lying, etc. Their bone growth is influenced by loading during all of these activities. Therefore, to estimate the bone growth accurately, growth simulation should to be performed for subject’s daily routine load profile. Our results are only meant to indicate a growth tendency due to gait, as gait is a frequent target and outcome measure for clinical interventions in persons with motor disorders.
The mechanical growth rate was assumed to be half that of the biological growth rate, in agreement with previous studies indicating that bone growth during endochondral ossification is dominated by biological factors. It has been reported that mechanical factors are likely to play a larger role in early development, and have a smaller influence on the bone shape closer to skeletal maturity (Matsuda et al. 1986; Raab et al. 1990; Wallace et al. 2007). The 𝜀̇ presented here was a sum of these two factors. A larger or smaller biological growth component would under- or overestimate, respectively, the predicted growth and direction. Furthermore, in this study, b/a ratio was chosen 0.5. For accurate growth rate computation, b/a ratio is proposed to be between 0.3 and 1 (Wong and Carter, 1990). Different values of this ratio can change the growth rate magnitude for the same region of the growth plate. In the present study, however, proximal femoral growth tendency was compared due different muscle groups loading, therefore our findings are not sensitive to this ratio. However, this ratio would be crucial for more precise quantative prediction of morphological changes.
Due to the time consuming process of creating subject-specific finite element models and analyses, our small sample size does not make possible to statistically verified our findings. A thorough analysis of how different muscle groups influence the proximal femoral growth development warrents a study with a larger population of able-bodied children. For such a study, we speculate that growth tendencies due to muscle group will be also be sensitive subjects’ ages, as the growth plate may undergo geometric changes during growth.
Furthermore, a planned continuation of this study is to validate growth tendencies with medical imaging after a long time period.
80 Influence of muscle groups’ activation on proximal femoral growth tendency In conclusion, results from the subject-specific model developed in this study indicated that different muscle groups influence the proximal femoral growth tendency in different manners. Normal gait may produce a tendency in able-bodied children to reduce both the NSA and the FA. Understanding growth tendency and its sensitivity to different muscle groups can help in better clinical treatment development for children with affected gait and muscle activations.
Conflict of interest None of the authors had any financial or personal conflict of interest with regard to this study. Acknowledgments This work was generously funded by the Promobilia foundation. The authors would like to thank the subject and his parents for their participation. We would also like to thank Dr. Eva Pontén, Dr. Thröstur Finnbogason and Anna Lind for their help in MRI data collection. References Arkin, A.M., Katz, J.F., 1956. The effects of pressure on epiphyseal growth; the mechanism of plasticity of growing bone. J. Bone Joint Surg. Am. 38-A, 1056–1076. Arnold, A.S., Blemker, S.S., Delp, S.L., 2001. Evaluation of a Deformable Musculoskeletal Model for Estimating Muscle–Tendon Lengths During Crouch Gait. Ann. Biomed. Eng. 29, 263–274. Bright, R.W., Burstein, a H., Elmore, S.M., 1974. Epiphyseal-plate cartilage. A biomechanical and histological analysis of failure modes. J. Bone Joint Surg. Am. 56, 688–703. Carriero, A., Jonkers, I., Shefelbine, S.J., 2011. Mechanobiological prediction of proximal femoral deformities in children with cerebral palsy. Comput. Methods Biomech. Biomed. Engin. 14, 253–262. Carter, D.R., Orr, T.E., Fyhrie, D.P., Schurman, D.J., 1987. Influences of mechanical stress on prenatal and postnatal skeletal development. Clin. Orthop. Relat. Res. 219, 237–250. Cibulka, M.T., 2004. Determination and Significance of Femoral Beck Anteversion. J. Am. Phys. Ther. Assoc. 84, 550–558. Currey, J.D., 2002. Bones: Structure and Mechanics, 2nd ed. Princeton University Press. Gage, J.R., Schwartz, M.H., Koop, S.E., Novacheck, T.F., 2009. The identification and treatment of gait problems in cerebral palsy, 2nd ed, Mac Keith Press. Goldstein, S.A., 1987. The Mechanical Properties of Trabecular Bone:Dependence On Anatomic Location And Function. J. Biomech. 20, 1055–1061.
Yadav P., Shefelbine S.J., Gutierrez-Farewik E.M.
| 81
Lin, H., Aubin, C.-É., Parent, S., Villemure, I., 2009. Mechanobiological bone growth: comparative analysis of two biomechanical modeling approaches. Med. Biol. Eng. Comput. 47, 357–366. Lin, Y.-C., Kim, H.J., Pandy, M.G., 2011. A computationally efficient method for assessing muscle function during human locomotion. Int. j. numer. method. biomed. eng. 27, 436– 449. Murphy, S.B., Simon, S.R., Kijewski, P.K., Wikkinson, R.H., Griscom, T., 1987. Femoral anteversion. J. Bone Jt. Surg. 69-A, 1169–1176. Pirpiris, M., Trivett, a, Baker, R., Rodda, J., Nattrass, G.R., Graham, H.K., 2003. Femoral derotation osteotomy in spastic diplegia. Proximal or distal? J. Bone Joint Surg. Br. 85, 265–272. Pritchett, J.W., 1992. Longitudinal growth and growth-plate activity in the lower extremity. Clin. Orthop. Relat. Res. 274–9. Rauch, F., 2005. Bone Growth in Length and Width : The Yin and Yang of Bone Stability. jounral of Musculoskelet Neuronal Interact 5, 194–201. Shefelbine, S.J., Carter, D.R., 2004a. Mechanobiological predictions of growth front morphology in developmental hip dysplasia. J. Orthop. Res. 22, 346–352. Shefelbine, S.J., Carter, D.R., 2004b. Mechanobiological predictions of femoral anteversion in cerebral palsy. Ann. Biomed. Eng. 32, 297–305. Shefelbine, S.J., Tardieu, C., Carter, D.R., 2002. Development of the femoral bicondylar angle in hominid bipedalism. Bone 30, 765–770. Smith, J.W., 1962. The relationship of epiphysial plates to stress in some bones of the lower limb. J. Anat. 96, 58–78.2. Somerville, E., 1957. Persistent foetal alignment of the hip. J. Bone Jt. Surgery, Br. … 39 B, 106–113. Stevens, S.S., Beaupré, G.S., Carter, D.R., 1999. Computer model of endochondral growth and ossification in long bones: biological and mechanobiological influences. J. Orthop. Res. 17, 646–653. Stokes, I.A.F., 2002. Mechanical effects on skeletal growth. J. Musculoskelet. Neuronal Interact. 2, 277–280. Villemure, I., Stokes, I. a F., 2009. Growth plate mechanics and mechanobiology. A survey of present understanding. J. Biomech. 42, 1793–1803. Wong, M., Carter, D.R., 1990. A theoretical model of endochondral ossification and bone architectural construction in long bone ontogeny. Anat Embryol 181, 523–532.
82 Influence of muscle groups’ activation on proximal femoral growth tendency Wu, G., Siegler, S., Allard, P., Kirtley, C., Leardini, A., Rosenbaum, D., Whittle, M., D’Lima, D.D., Cristofolini, L., Witte, H., Schmid, O., Stokes, I., 2002. ISB recommendation on definitions of joint coordinate system of various joints for the reporting of human joint motion - part I: ankle, hip, and spine. J. Biomech. 35, 543–548. Yadav, P., Shefelbine, S.J., Gutierrez-farewik, E.M., n.d. Effect of growth plate geometry and growth direction on prediction of proximal femoral morphology. Submitt. to J. Biomech