Journal of Mammalogy, 96(6):1162–1173, 2015 DOI:10.1093/jmammal/gyv124 Published online August 14, 2015
Mitochondrial DNA diversity, genetic structure, and demographic history of the Neotropical otter (Lontra longicaudis) in Mexico Jimena Guerrero,* Juan P. Gallo-Reynoso, and Roman Biek Institute of Biodiversity, Animal Health & Comparative Medicine, University of Glasgow, University Avenue, Glasgow G12 8QQ, United Kingdom (JG, RB) Centro de Investigación en Alimentación y Desarrollo A.C., Unidad Guaymas, Carretera al Varadero Nacional km 6.6. s/n Col. Las Playitas, Guaymas, Sonora C.p. 85480, México (JPG-R) * Correspondent:
[email protected] Genetic diversity represents the evolutionary potential of a population, and allows insights into its demographic history and genetic structure; understanding these aspects of a population is crucial for conservation planning. The Neotropical otter (Lontra longicaudis) is distributed from Argentina to Northern Mexico and is currently listed as ‘data deficient’ by the International Union for the Conservation of Nature (IUCN). To contribute to conservation planning for the species, we used non-invasive sampling to obtain mtDNA control region sequences from 44 individuals from across Mexico. We examined country-wide genetic diversity and demographic history, as well as genetic structure among 3 regions: North Pacific, South Pacific, and Atlantic. Haplotypes identified in Mexico were combined with Central and South American haplotypes in order to examine phylogeographic patterns and identify evolutionary significant units (ESUs). Results show lower genetic diversity in Mexico compared to recent estimates for South American populations. Analyses of demographic history in Mexico indicated an expansion coinciding with climatic changes at the end of the Pleistocene. Genetic structure was high among North Pacific/ South Pacific (FST = 0.48) and North Pacific/Atlantic (FST = 0.49), potentially due to mountain chains acting as barriers to female gene flow among these regions. On the other hand, we identified a potential corridor for gene flow among South Pacific and Atlantic. Phylogeographic analyses identified a distinct lineage distributed in North and Central America. We propose this represents a distinctive ESU which should be considered for separate conservation management. La diversidad genética está directamente ligada al potencial evolutivo de una población y permite obtener información acerca de su historia demográfica y estructura genética; el comprender estos aspectos de una población es crucial para su conservación. La nutria neotropical (Lontra longicaudis) se distribuye desde Argentina hasta México y actualmente está clasificada como ‘deficiente en datos’ por la UICN. A fin de contribuir a la conservación de esta especie, se realizó muestreo no-invasivo para obtener secuencias de la región control del DNA mitocondrial de 44 individuos en México. En el presente estudio, se examinó la diversidad genética e historia demográfica a nivel nacional, así como la estructura genética entre tres regiones: Norte del Pacifico (NP), Sur del Pacifico (SP) y Atlántico (AT). Los haplotipos identificados en México se combinaron con haplotipos de Centro y Sudamérica a fin de identificar patrones filogeográficos y Unidades Evolutivamente Significativas (UES). En México, la diversidad genética estimada fue menor que en estudios recientes en poblaciones de Sudamérica; los análisis de historia demográfica en México indicaron una expansión que coincide con cambios climáticos al final del Pleistoceno. La estructura genética entre NP y SP/AT fue alta (FST = 0.49), posiblemente debido a la presencia de sierras que actúan como barrera al flujo genético entre estas regiones. En contraste, se identificó un potencial corredor de flujo genético entre SP y AT. Mediante análisis filogeográficos, se identificó un linaje monofilético distribuido en Norte y Centro América (NCAM). Se propone que éste representa una Unidad Evolutivamente Significativa (UES), por lo que para su conservación deberá ser manejada de manera independiente. Key words: conservation, demographic history, evolutionary significant unit, genetic diversity, Lontra longicaudis, Mexico © 2015 American Society of Mammalogists, www.mammalogy.org
1162
GUERRERO ET AL.—mtDNA DIVERSITY OF L. LONGICAUDIS IN MEXICO
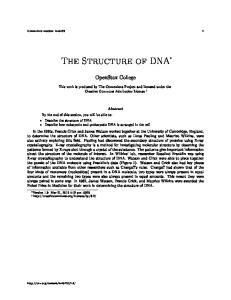
Genetic diversity is the raw material for evolutionary change, as it confers species the ability to adapt to changing environments and respond to threats such as predators, parasites, and disease; thus, it is directly linked to a species’ evolutionary potential (Allendorf and Luikart 2007). At the population level, various factors can affect the level of genetic diversity. Among these, the effective size of a population (Ne) is crucial because it determines how fast genetic diversity is lost through genetic drift, i.e., the smaller the effective population size, the faster the genetic diversity will be depleted (Frankham et al. 2009). Most natural populations will experience changes in Ne throughout time, which will leave a signature in their current patterns of genetic diversity (Aspi et al. 2006; Pyhäjärvi et al. 2007). The rate of loss of genetic diversity is also affected by the degree of isolation of populations, which can be inferred from patterns of genetic differentiation among demes (Amos and Harwood 1998; Frankham et al. 2009). Thus, by examining the current patterns of genetic diversity and genetic structure in the populations of a given species, it is possible to shed light onto their demographic histories and genetic connectivity. With this information, conservation units can be defined and adequate management actions can be taken. However, in order to ensure long-term conservation, it is crucial to first have a clear grasp of the taxonomy of the focal species, so as to guarantee that available resources are used in the most cost-effective way (Mace 2004; Frankham et al. 2009). The Neotropical otter (Lontra longicaudis) is distributed in the Americas, from Mexico to Argentina (Fig. 1). This species is currently classified as data deficient by the International Union for the Conservation of Nature and its populations are suspected to be declining; hence, there is a desperate need for research that sheds light on the status of its populations and the threats they may be facing (Kruuk 2006; Waldemarin and
1163
Alvares 2008). In Mexico, the species’ range reaches its northern limit within the Mexican Transition Zone (MTZ), a large biogeographic region that encompasses a complex assemblage of diverse biotas, making it one of Earth’s biodiversity hotspots (Mittermeier et al. 2005; Morrone 2010). Across the MTZ, mountain ranges such as the Sierra Madre Oriental (SMOR), Sierra Madre Occidental (SMOC), the Transvolcanic Belt (TB), as well as the Tehuantepec Isthmus (TI) have been implicated in the shaping of large-scale phylogeographic patterns and genetic structure of several vertebrate species in Mexico (Mateos 2005; Bryson et al. 2011; Arteaga et al. 2012; González-Porter et al. 2013). These formations also act as boundaries among hydrological basins and affect directionality of river drainages, thus delimitating the distribution of freshwater taxa, including crustaceans, fish, and helminth parasites (Huidobro et al. 2006; Quiroz-Martínez et al. 2014). For instance, numerous studies have found biogeographic patterns that divide freshwater taxa into Pacific and AT populations, as the SMOC and the SMOR, induce rivers to drain either to the east (toward the Gulf of Mexico), or to the west (toward the Pacific Ocean), thus determining dispersal routes for freshwater biota (Quiroz-Martínez et al. 2014). Given that Neotropical otters are strongly associated with freshwater habitat, it is likely that the mentioned geographic characteristics have also affected the dispersal and consequently the genetic structure of otter populations in Mexico. A number of studies have examined the demographic histories of taxa within the MTZ and have found genetic patterns that can be attributed to climatic changes occurring throughout the Pleistocene (Milá et al. 2000; Eizirik et al.2001; Arteaga et al. 2012; Gasca-Pineda et al. 2013; Matte et al. 2013). Although the fossil records establish the presence of Neotropical otters in Mexico in the late Pleistocene (Arroyo-Cabrales et al. 2013),
Fig. 1.—Current distribution of the Neotropical otter (Lontra longicaudis) throughout the Americas (shaded area). Modified from Waldemarin and Alvarez (2008)
1164
JOURNAL OF MAMMALOGY
no studies on the demographic history of the species have been done and there has only been 1 study on the genetic diversity and structure of Neotropical otters in Mexico, which was conducted within a river basin in the southern state of Chiapas (Ortega et al. 2012). In light of this, there is a clear need for studies that investigate the demographic history and genetic structure of the species at a country-wide scale, in order to identify populations of conservation concern as well as potential units for conservation. At a range-wide scale, there have been proposals of taxonomic subdivision of L. longicaudis based on differences in rhinarium shape (Van Zyll de Jong 1972; Larivière 1999). Specifically, 3 geographically separated subspecies have been proposed: L. l. longicaudis, distributed through most of South America; L. l. enudris distributed through French Guiana, Suriname, Trinidad, and Peru; and L. l. annectens occurring in Nicaragua, Costa Rica, Panama, Colombia, Venezuela, Ecuador, and Mexico (Appendix I) A recent phylogeographic study of the species (Trinca et al. 2012) identified 2 distinctive mitochondrial DNA (mtDNA) lineages in South America which were denominated as “East South America” (ESA) and “Amazonia” (AMZ). Based on the geographic distribution of these lineages, the authors proposed they could represent the subspecies L. l. longicaudis and L. l. enudris, respectively. Additionally, based on a single sample from Colombia, the authors identified a distinct lineage that could represent the subspecies L. l. annectens. However, because no samples from Central and North America were included in their study, the authors concluded that extending sampling to the entire species range could give stronger support to the proposed taxonomic scheme, and potentially identify other taxonomically distinct units. Given that several aspects of this species’ genetic history and structure remain unexplored at both the range-wide and local (Mexico) scale, in this study we aimed to:1) investigate genetic population structure of Mexican otter populations and identify potential geographic drivers of the observed patterns; 2) infer the demographic history of Mexican otter populations from their current patterns of genetic diversity; 3) examine how sequences from Mexican and Central American otter populations fit into the recent phylogeographic reconstructions of the species in South America, in order to contribute to taxonomic clarification; and 4) identify conservation units for the species in Mexico/Central America and propose preliminary conservation actions for otter populations in Mexico.
Materials and Methods Sampling.—From 2011 to 2013, sampling was conducted in 3 focal regions within the range of the species in Mexico: North Pacific (NP), South Pacific (SP), and Atlantic (AT). These regions generally coincide with proposed biogeographic provinces in Mexico (Morrone 2005; Escalante et al. 2013) and were defined on the basis of geographic features that have been shown to delimit population units in several Mexican taxa (bats—Martins et al. 2009; snakes—Bryson et al. 2011;
mammals—Arteaga et al. 2012). Specifically, the SMOR could form a boundary between Pacific (Western) and AT (Eastern) populations, while the SMOC and the TB would separate NP from SP populations (Fig. 2). Within the 3 focus regions, 17 locations in which the presence of the species had been previously recorded (Gallo-Reynoso 1997) were selected for field surveys (Fig. 2). During the surveys, otter habitat was visited in the early morning hours to collect fresh fecal samples; the geographic location of each sample was recorded using a GPS. The majority of samples were stored in paper envelopes and dried at ambient temperature, but whenever possible they were also stored in RNAlater solution and/ or 96% ethanol. In addition, we collected muscle tissue and hair from specimens found dead in the field (n = 6) and through collaboration with local zoos, we obtained hair samples (n = 6) from specimens that died in captivity. Furthermore, one of our collaborators provided a hair sample from a specimen found dead in the field in Costa Rica. This sample was included to complement subsequent analyses on range-wide phylogeographic patterns. No live animals were handled in the present study. DNA extraction.—DNA extraction from fecal samples was performed in a designated area of the lab using a QIAamp DNA Stool Mini Kit (Qiagen, Manchester, UK) following the manufacturer’s instructions, with the following modifications: incubation in ASL buffer was done overnight; incubation time in AE buffer was increased to 30 min and the final elution step in AE buffer was done in 100 μl. The DNA extraction from tissue and hair was performed by means of DNeasy Blood & Tissue Kit (Qiagen). For hair extractions, we modified the manufacturer’s protocol to include 20 μl of 1 M DTT when incubating in buffer ATL and proteinase K. Amplification of mtDNA and sequence analyses.—We used a combination of primers to amplify 2 overlapping fragments (~250 bp each) of the 5′ portion of the mtDNA control region (including the first hyper variable segment) of L. longicaudis. Specifically, the primer pairs: 5’CCTGAAGTAAGAACCAGATG-3’(forward) and (reverse) 5’-CACCACCAACACCCAAAGCT-3’ (Valqui et al. 2010) were used in PCR reactions together, while primers (forward) 5′-GACGTGTACCTCTTCTCG-3′ (Centrón et al. 2008) and (reverse) 5′-GTTGTGCGATGCGGATAAAT-3′ (Vianna et al. 2010) were used in combination. All PCR reactions (20μl) contained 2μl DNA, 0.5 μM each primer, 1× reaction buffer, 1.5 mM MgCl, 0.2 mM dNTPmix, 1× BSA, and 1 U Taq polymerase (Life Technologies, Warrington, UK). The PCR protocol involved an initial denaturation step of 94°C for 3 min, followed by a touchdown scheme of 94°C for 45 s, annealing of 60–50°C for 45 s, and extension at 72°C for 90 s. Finally, 35 cycles of denaturation at 94°C for 1 min, 50°C annealing for 45 s, and extension at 72°C for 3 min were performed. In all PCR reactions, 1 negative control was included for every 30 samples tested. The PCR products were visualized in 2% agarose gels and products of the expected size were sent out for sequencing at the DNA Sequencing & Services (MRCPPU, College of Life Sciences, University of Dundee, Scotland). All PCR
GUERRERO ET AL.—mtDNA DIVERSITY OF L. LONGICAUDIS IN MEXICO
1165
Fig. 2.—Study regions, sampling locations, and geographic features within L. longicaudis habitat in Mexico. The map represents the 3 study regions and the sampling locations within them; regions/locations are coded by icons: North Pacific (NP) = triangles, South Pacific (SP) = squares, Atlantic (AT) = circles. Numbers and black lines indicate major geographic features in Mexico: 1= Sierra Madre Oriental (SMOR), 2 = Transvolcanic Belt (TB), 3 = Sierra Madre Occidental (SMOC), 4 = Tehuantepec Isthmus (TI). The black dashed line represents Neotropical otter range in Mexico and blue lines (gray in print version) represent rivers within the country.
products were sequenced in both directions as a quality control. The retrieved sequences were blasted in Genbank to confirm they matched L. longicaudis and were aligned and edited using Geneious Pro 5.5.7 (Kearse et al. 2012). Sites with indels were ignored in all subsequent analyses. The estimated home range of Neotropical otters in Mexico during the dry season (when sampling was conducted) ranges from 2 to 4 km (Gallo-Reynoso 1989). Therefore, when identical sequences were obtained from fecal samples, we only considered them to represent different individuals if their respective sampling locations were at least 6 km apart. Thus, the final data set consisted of 44 sequences deemed to belong to different individuals, originating from the 3 sampling regions in Mexico: SP (n = 17), NP (n = 8) and AT (n = 17; Fig. 2), as well as 1 sequence from Costa Rica (Appendix II). Finally, in order to further complement the data set and cover the entire range of the species, we obtained 29 mtDNA control region sequences of South American otter populations from GenBank: EU2511949-EU2511960 and JQ038804-JQ038822 (Trinca et al. 2012). Genetic diversity and structure.—We used DnaSP v5 (Librado and Rosas 2009) to identify unique haplotypes within the pool of 44 Mexican sequences plus the sequence from Costa Rica (n = 45). This software was also used to estimate haplotype diversity (h) and nucleotide diversity (π) within Mexico (the sequence from Costa Rica was excluded from these analyses). Both genetic diversity measures were estimated for the
entire set (n = 44), as well as for each of the 3 study regions separately. Because of uncertainty about the geographic origin of 2 sequences, these were excluded from within-region estimates. In order to depict relationships between Mexican haplotypes, a median-joining network was built using the software Network 4.6.1.1 (Bandelt et al. 1999), and an analysis of molecular variance (AMOVA) was performed in Arlequin v. 3.5.1.2 (Excoffier et al. 2005) to estimate overall FST and genetic variance partition among the 3 study regions. Pair-wise FST values among regions were also estimated with Arlequin, and the significance of statistics was estimated from 1,000 permutations. Selection of nucleotide substitution model.—We used jModelTest (Posada 2008) to find the best model of nucleotide substitution for 2 separate data sets: 1—only Mexican sequences and 2—combined sequences from Mexico, Costa Rica, and South America. The model with the best fit according to Akaike information criterion was HKY + I for Mexican sequences, and TPM3uf + I + G for the combined data set. These substitution models were considered in subsequent phylogeographic and demographic history analyses. Demographic history.—Fu’s Fs test (Fu 1997) and mismatch distribution (Rogers and Harpending 1992) analyses were performed with Arlequin (Excoffier et al. 2005) to assess whether Mexican otter populations have experienced historical changes in size and significance values were estimated from coalescent simulations. In order to further explore demographic trends in
1166
JOURNAL OF MAMMALOGY
the population and estimate historical effective population size (Ne), a Bayesian skyline plot (BSP) was built using the software BEAST 1.8.0 (Drummond et al. 2005). The substitution model used was HKY + I and we assumed a strict molecular clock, with a substitution rate of 1.5 × 10⁻⁷ substitutions per site per year based on a previous estimate for carnivores (Fernandes 2011). Three independent MCMC were run for 3.0 × 10⁷ steps with a burn-in of 10%. Convergence was confirmed using TRACER 1.5 (Rambaut and Drummond 2007) with an effective sample size target > 200. Range-wide phylogeography.—This data set comprised haplotypes from North America (Mexico), Central America (Costa Rica), and South America (Bolivia, Brazil, Colombia, French Guyana, and Peru). We used MEGA 6.0 (Tamura et al. 2013) to build a maximum likelihood phylogenetic tree of haplotypes. Given that the substitution model selected for the data set is not available in MEGA, we used the GTR + I + G model. The node support for the tree was estimated from 1,000 bootstraps, and a sequence of marine otter (Lontra felina) was as used as outgroup: GQ843772 (Vianna et al. 2010). The divergence dates of phylogeographic lineages observed in the tree were estimated using BEAST 1.8.0 (Drummond et al. 2012) by calibrating with the estimated divergence date of L. longicaudis and L. felina: 0.5–3.2 Ma (based on fossil records of the family Mustelidae—Koepfli et al. 2008). We assumed a normal prior distribution for the node age (X = 2.0 Ma and SD of ± 0.8 Ma), an uncorrelated lognormal relaxed molecular clock, and a tree
prior based on a Yule process. The MCMC procedure was run for 50 million generations, sampling every 5,000 steps. Next, BEAST output was analyzed with the program Tracer v.1.5 (Rambaut and Drummond 2007) with a burn-in of 10% and Tree Annotator v.1.5 (Rambaut and Drummond 2007) was used to produce a Bayesian phylogenetic tree of haplotypes.
Results We identified 11 haplotypes within Mexico (accession numbers KT225259–KT225269), and an additional one from Costa Rica (accession number KT225270). The final alignments for Mexico and range-wide (Mexico + Costa Rica + South America) analyses were 507 and 491 bp long, respectively. Range-wide phylogeography.—The final data set comprised 41 haplotypes from across the species’ range: Mexico (n = 11), Costa Rica (n = 1), and South America (n = 29). Both the maximum likelihood and Bayesian trees of these haplotypes showed similar topologies and strong support (> 70%) (Hillis and Bull 1993) for a monophyletic group containing all Mexican haplotypes plus the haplotype from Costa Rica and a single haplotype from Colombia (Trinca et al. 2012). The trees also showed clades that largely coincide with the lineages ESA and AMZ previously identified by Trinca et al. (2012). However, node support for these clades varied with the method of phylogenetic reconstruction (Fig. 3). The mean divergence date between the EU251949 EU251958 EU251953 JQ038819 EU251957 EU251960 EU251951 EU251950 JQ038822
JQ038809
EU251954
EU251955
EU251956 EU251952
JQ038814
92/79
94/-
JQ038808 JQ038812
JQ038815
JQ038816 JQ038805 JQ038820 JQ038817 JQ038806 JQ03881
EU251959 JQ038804
100/100
JQ038810 JQ038813
98/77
H5MX/JQ038807 H4MX H8MX H7MX H3MX H9MX H1MX H6MX H2MX/CR H10MX H11MX
0.006
Fig. 3.—Maximum likelihood tree of Neotropical otter haplotypes. The scale bar represents substitutions per site. The values on the branches represent support for the adjacent node based on Bayesian and maximum likelihood analyses (left to right). Only support > 70% is shown. The haplotypes from Mexico (H1MX to H11MX/accession nos. KT225259–KT225269), Costa Rica (CR/accession no. KT225270), and Colombia (JQ038807) are indicated in blue (squares in print version). South American haplotypes (EU2511949–EU2511960 and JQ038804–JQ038822) are coded according to lineages identified by Trinca et al. (2012): East South America = green (triangles in print version) and Amazonia = orange (circles in print version).
GUERRERO ET AL.—mtDNA DIVERSITY OF L. LONGICAUDIS IN MEXICO
1167
Table 1.—Genetic diversity estimates in South American and Mexican populations of Neotropical otter (Lontra longicaudis) and the related species, Marine otter (Lontra felina) based on mitochondrial DNA control region sequences. AMZ = Amazonia, AT = Atlantic, ESA = East South America, NP = North Pacific, SP = South Pacific. Species/study area L. felina/Peru and Chilea L. longicaudis/ South Americab L. longicaudis/ Mexicoc
n
Haplotype diversity (SE)
Nucleotide diversity (SE)
168
0.9315 (0.0055)
0.0047 (0.0028)
36 (ESA) 14 (AMZ) 44 (country) 17 (SP) 17 (AT) 8 (NP)
0.8187 (0.0084) 0.9487 (0.0059) 0.7620 (0.0085) 0.8160 (0.0147) 0.4260 (0.0356) 0.2500 (0.0636)
0.0062 (0.0018) 0.0121 (0.0025) 0.0023 (0.0000) 0.0023 (0.0000) 0.0016 (0.0000) 0.0004 (0.0000)
Vianna et al. (2010). Trinca et al. (2012). c This study. a
b
Mexico/Costa Rica/Colombia lineage from all South American haplotypes was 0.228 Ma (95% high posterior density [HPD]: 0.0032–1.138). Genetic diversity.—Country-wide genetic diversity in Mexico was lower (h = 0.762; π = 0.002) than in previous studies of Neotropical otters in South America (h = 0.818–0.948; π = 0.006–0.012—Trinca et al. 2012), and in the closely related species L. felina (h = 0.931; π = 0.004—Vianna et al. 2010). Within Mexico, haplotype and nucleotide diversity varied among sampling regions; estimated diversity was highest in the SP, followed by AT and NP, respectively (Table 1). Haplotype network and genetic structure.—The medianjoining network of Mexican haplotypes showed a star-like pattern; that is, a central high-frequency haplotype (H2), as well as several low-frequency haplotypes with few mutational steps (maximum of 2) between them. Haplotype ‘H2’ was the only one shared by all 3 sampling regions, the rest were exclusive to only one of them (Fig. 4). The AMOVA showed evidence of significant genetic structure (FST = 0.31, P