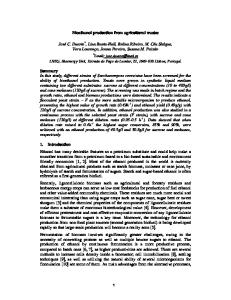
Minnesota Agricultural Production and Rural Infrastructure Minnesota Trends in Agricultural Production and Infrastructure Highlights - In many states the percentage of the state population designated by the U.S. Census Bureau as living in rural areas has declined, but in contrast in Minnesota, the absolute number of residents in rural areas has increased in recent decades. - Minnesota’s production of crops has nearly quadrupled since 1940, increasing from 407 million bushels in 1940 to 1,551 million bushels in 2011. - While the value of agricultural production in Minnesota increased by 1,202% from 1950 to 2007, the number of farms decreased by 56%.
Production Consumed on Farm - Home consumption of a farm's production has changed dramatically. In 1950, the value of farm production consumed at home in Minnesota was 4.66%. - In contrast, in 2010 just 0.11% of the value of production in Minnesota was consumed at home. This shift amounts to an even greater reliance by agricultural producers on rural infrastructure to transport farm products.
Rural Population Trends - In 1930 there were 1,306,337 people living in Minnesota, with 51.0% of that population in rural areas. - By comparison, in 2010 there were 5,303,925 people living in Minnesota, with 26.7% of that population in rural areas.
Did you know? - In Minnesota in 2007, there were an average of 232 soybean acres per soybean farm, while for the U.S. the average soybean area per soybean farm was 229 acres. - Broilers are a major consumer of soybean meal. In 2007, there were 47.95 million broilers sold in Minnesota and 8,915 million broilers sold in the U.S. - Average farm size in the U.S. increased from 213 acres in 1950 to 418 acres in 2010, while average farm size in Minnesota increased from 181 acres to 332 acres over the same period. - In Minnesota in 1945, there were 16,021 grain combines, while in 2007 there were 29,232 selfpropelled grain and bean combines in the state.
Agricultural Production Then Year
Quantity
Now Percentage of U.S.
Year
Quantity
Change Percentage of U.S.
Percentage Change in Quantity
Consolidation Trends: Number of Farms
1950
184,000
3.3%
2010
81,000
3.7%
-56.0%
Farmland Trends: Land in Farms (Acres)
1950
33,300,000
2.8%
2010
26,900,000
2.9%
-19.2%
Average Farm Size (Acres)
1950
181
85%
2010
332
79%
84%
Population Trends: Population Density (Pop. per Square Mile)
1930
32
92%
2010
67
76%
106.9%
Production Trends: Volume of Production (Million Bushels)
1940
407
8.6%
2011
1,551
8.7%
281%
Miles of Road by Owner for Minnesota Other 4,073
State Highway Agency 11,893
County 44,876
Minnesota Agriculture and Rural Infrastructure Highlights
Federal Agency 0
Roads
With 138,239 miles of road as of 2008, Minnesota accounts for 3.4% of U.S. road miles.
Railroad
Minnesota had 9,114 miles of railroad in 1920 (around the time of the peak rail mileage), but this mileage had fallen to 8,001 miles in 1965 and decreased even further to 4,528 freight railroad miles in 2009.
Waterways
Minnesota has approximately 260 miles of inland waterways.
Bridges
Minnesota has 13,117 bridges, and approximately 11.1 percent of those are considered structurally deficient or functionally obsolete.
1
Towns and Cities 77,397
Minnesota Agricultural Production and Rural Infrastructure Farm Equipment
Consolidation Trends: Fewer Farms and Larger Average Farm Size Then (1954) Number of Farms Corn for Grain
Now (2007)
Average acreage or number of head per farm for farms with production
Number of Farms
Change
Average acreage or number of head per farm for farms with production
Percentage Change in No. of Farms
Percentage Change in Avg. Farm Size
114,592
40
acres
30,976
252
acres
-73%
527%
Soybeans
55,697
34
acres
27,040
232
acres
-51%
577%
Wheat
21,408
33
acres
6,727
255
acres
-69%
679%
Cattle and Calves Inventory
139,586
26
head
24,685
97
head
-82%
268%
Hogs Sold
89,301
50
head
4,748
4,805
head
-95%
9,556%
240
10,429
head
940
51,009
head
292%
389%
195 acres
80,992
332 acres
-51%
70%
Broilers Sold All Farms
165,225
Farm Equipment Used: Number of Tractors of Various Sizes, 2007 Tractors, Less than 40 HP 60,410
0
50,000
Tractors, 40 to 99 HP 90,711
Tractors, 100 HP or greater 78,920
100,000 150,000 200,000 250,000 Number of Tractors
Farm Input Trends: Minnesota Farm Inputs by Type, 1949-2010 16,000 Miscellaneous and other production expenses 14,000 Production Expenses by Category (Million Dollars)
Capital consumption, excluding operator dwellings Interest expenses, excluding operator dwellings
12,000
Total labor expenses 10,000 Marketing, storage, and transportation expenses 8,000
Repair and maintenance expenses, excluding operator dwellings
Fuel and oil expenses
6,000
Pesticide expenses 4,000 Fertilizer and lime expenses
2,000
Purchased seed expenses
0
1949 1951 1953 1955 1957 1959 1961 1963 1965 1967 1969 1971 1973 1975 1977 1979 1981 1983 1985 1987 1989 1991 1993 1995 1997 1999 2001 2003 2005 2007 2009
Purchased livestock and poultry expenses Purchased feed expenses
2
Minnesota Agricultural Production and Rural Infrastructure
Rural Infrastructure Trends Then Year Off Farm Storage (million bushels)
Quantity
Now Percentage of U.S.
Year
Quantity
Change Percentage of U.S.
Percentage Change in Quantity
1986
555
6.1%
2011
660
6.5%
19%
1986
1,460
10.6%
2011
1,450
11.4%
-1%
1950
5,628
104.4%
2011
10,906
109.4%
94%
Railroad Miles
1920
9,114
3.7%
2009 freight
4,528
3.2%
-50%
Road Miles
1940
11,306
2.0%
2008
138,239
3.4%
1,123%
On Farm Storage (million bushels) Estimated Average Tractor Weight (lbs.)
Estimated Number of Semi Trailer Loads Required to Haul Minnesota's Grain and Oilseed Production (Includes Corn, Soybeans, Wheat, Sorghum, Barley, and Oats)
2,500,000
Number of Semis Trailer Loads
2020 1,972,022
2012 1,957,195
2,000,000
1,500,000
1,000,000
500,000
2020
2019
2018
2017
2016
2015
2014
2013
2012
2011
2010
2009
2008
2007
2006
2005
2004
2003
2002
2001
0
2000
Note: Assumes 26 tons of grain per semi trailer load. Estimated number of semi trailer loads if all production is initially hauled by semi trailer. Based on Informa crop production forecasts.
3
Minnesota: Agricultural Production and Infrastructure Infrastructure • Minnesota crop production consists primarily of corn, soybeans, and wheat. • Crops are moved from production regions by truck, rail or barge to elevators and processing facilities. • Minnesota has 953 miles of interstate; 4,528 miles of rail lines; 260 miles of waterways; 13,117 bridges and 138,239 miles of roadways. • Minnesota has six soybean crush facilities; 40 shuttle facilities; 21 ethanol plants; 408 grain elevators; and nine river elevators.
4
Minnesota: Change in Production from 1950 to 2010 Production • Crop production in much of the state has been increasing, while production in the north central and northeastern portion of the state has been decreasing. • Production of grains and soybeans has increased by nearly 1.2 billion bushels from 1950 to 2010. • Historically, Minnesota has produced predominantly corn and oats along with a mix of other grains and soybeans. • Corn production in Minnesota has increased to over one billion bushels, while soybeans have edged past oat production. The state also produces barley and wheat.
Funded by the soybean checkoff
5