Minding the Climate Gap
1
Minding the Climate Gap EXECUTIVE SUMMARY What’s at Stake if California’s Climate Law isn’t Done Right and Right Away
Rachel Morello-Frosch, Ph.D., MPH | Manuel Pastor, Ph.D. | James Sadd, Ph.D. | Seth B. Shonkoff, MPH Manuel Pastor, Ph.D. | Rachel Morello-Frosch, Ph.D., MPH | James Sadd, Ph.D. | Justin Scoggins, M.S.
Minding the Climate Gap
Acknowledgments The research work for this project was supported by a grant from the William and Flora Hewlett Foundation. The conclusions and opinions in this document are those of the authors and do not necessarily reflect the views of the funder or our respective institutions.
1
Minding the Climate Gap
Introduction With the passage of the bipartisan Global Warming Solutions Act (AB 32) in 2006, California demonstrated its leadership on environmental issues by committing to the reduction of greenhouse gas (GHG) emissions. What is often overlooked when evaluating the impacts of climate change policy like AB 32 is that beyond largescale impacts – like decreasing global carbon counts, tempering the rise in global temperature, and staving off countless natural disasters – GHG reductions can have related local impacts. When regulations prompted by AB 32 take effect in early 2012, Californians will not only see a reduction in GHG emissions, they are also likely to see a reduction in harmful chemical compounds that are emitted alongside GHGs – pollutants such as particulate matter, sulfates, and volatile organic compounds. That’s good news for all Californians. Too few Californians are aware of this opportunity for potential health gains and the fact that many economists predict that AB 32 will also produce long-term net growth in jobs. California lawmakers and regulators should better broadcast these facts – and they could also build more public support for policies that will prevent climate change by ensuring that mitigation strategies also lead to cleaner air where it is needed most: in poor neighborhoods and communities of color. Why are these neighborhoods and communities overburdened? In a recent report entitled The Climate Gap (MorelloFrosch, et al. 2009), we showed that climate change does not affect all Americans equally. Communities of color and low-income neighborhoods suffer the greatest health and economic consequences. Among the many disparate impacts, these Americans are more likely
La Paloma
Exxon Mobile
Why The Other Pollutants Matter
Consider the La Paloma power plant and the Exxon Mobil refinery in Torrance. The La Paloma power plant sits about 35 miles west of Bakersfield in an abandoned oil field just outside of the small town of McKittrick (population 160) with fewer than 600 residents in the surrounding 6 miles, and no other facilities in the immediate vicinity. The Exxon Mobil refinery, on the other hand, has nearly 800,000 people in the encircling 6 miles and is one of many facilities in its surrounding area. While these two facilities seem quite different, they share one similarity – according to recently released 2008 GHG emissions data from the California Air Resources Board, they both emit between 2.5 and 3 million tons of carbon dioxide each year. However, La Paloma releases 48.6 tons of particulate matter per year while Exxon Mobil emits 352.2 tons. This staggering emissions burden is important to people who live in Torrance’s dense neighborhoods, yet this fact is often ignored in the debates about how we might best implement AB32. Why is the difference between reducing emissions at La Paloma and in Torrance overlooked in the discussion about mitigating climate change? Part of the reason is that too much of the discussion stays at the macro-level: climate change is imagined as major weather events and sea level rise. While the catastrophic potential of climate change is well documented, the story of the climate gap – the often hidden and unequal impacts on people of color and the poor in the United States, ranging from increased air pollution and higher prices for basic necessities to job loss – unfolds at the neighborhood level and is just being understood. Partly because of this, systemic efforts to combat climate change have focused primarily on reducing carbon with little, if any, regard for how these efforts might also worsen or ameliorate the climate gap. Shining a light on the gap is no excuse for forgetting the health concerns of the much smaller population near the La Paloma power plant – or for backing away from the shared global goals of legislation like AB 32 – but it does provide yet another prism for our work and another way to generate widespread support for tackling the challenge of climate change.
2
Minding the Climate Gap
to be exposed to dirtier air, more vulnerable to extreme weather events, and suffer more than others by the rising costs of basic necessities and economic dislocations caused by climate change. This report examines one aspect of this “climate gap” in the context of market-based strategies to limit greenhouse gas emissions. Such market strategies tend to come in two types: either charging a fee on carbon emitters to encourage reduction or placing emitters within a cap-and-trade system in which firms receive or purchase emissions allowances and are allowed to buy or sell allowances depending on their ability or desire to reduce their own pollution versus paying someone else to reduce theirs. It is argued that such market-based strategies make little difference with regard to GHGs – reducing carbon emissions anywhere has the same global impact. But what are the potential benefits from targeting the reductions in greenhouse gases from sources that also emit high levels of other dangerous pollutants that have localized health impacts? This report looks at the consequences of a “blind” market strategy that ignores these toxic chemicals or co-pollutants – and the climate gap with regard to who they affect and where. We argue that such an approach could waste an opportunity to further enhance the positive health impact of AB 32 at the local level. Think of it this way. Imagine a factory whose pollution caused drinking water in a city to become unsafe. Would it make sense to allow the factory to pay for clean up at a remote lake across the state instead of cleaning up their local pollution where residents live to address the human health risks it has caused? While it could be argued that cleaning up polluted water anywhere is good policy, the public health benefits of one choice could vastly outweigh the public health benefits of the other. It is exactly this kind of scenario – forgone benefits and lost opportunities – that “blind” carbon markets could create when the consideration of hazardous pollutants that are emitted alongside greenhouses gases are left out of the policy equation.
Why California Must Mind the Climate Gap While reducing greenhouse gases will help to counter global climate change and in turn benefit all Californians, a carbon market that does not prioritize reductions at sources that also emit hazardous air pollution in populated neighborhoods is likely to result in significant lost public health opportunities – especially for California’s most vulnerable populations. Not all greenhouse gas emitting facilities pollute equally, nor are they evenly distributed statewide. A relatively small number, clustered in densely populated low-income communities and communities of color, are responsible for the vast majority of the combined toxic air pollution from these facilities in such neighborhoods. They account for virtually all of the pollution disparity, under a measure developed in this report, from facilities that will be first to enter the carbon market. This means that increases in emissions among this small group of facilities, or a failure to reduce pollution in step with the declining greenhouse gas emissions cap, could widen the climate gap and weaken the public health goals of California’s climate policies. Fearing this scenario, advocates from impacted neighborhoods have raised significant concerns about the potential results of what seems to be California’s likely adoption of a cap-and-trade approach. This report provides evidence to justify these concerns, and also offers a menu of solutions for developing an equitable system that could provide the most long-term benefits to the greatest number of Californians.
Maximizing Benefits for All Californians Ensuring that California gets the maximum benefit for its carbon reduction efforts is important for public health, our struggling economy, and the reduction of healthcare costs. Although we do not quantify here
3
Minding the Climate Gap
the economic impact of health problems caused by toxic air pollution in California, other research has demonstrated that such costs are externalized by major polluters who shift the burden onto California taxpayers and insurance companies. Recent studies suggest that a greenhouse gas reduction strategy that also prioritizes reducing toxic air pollution would result in improved air quality that enhances the overall benefits, compared to a plan that considers only carbon emissions. This report presents a menu of policy options for how California can implement climate policy in such a way that Californians get more for their initial taxpayer investments. Stressing how to maximize gains is important given that there are some political and economic actors calling for delays in the implementation of AB 32. Outof-state oil companies, for example, have already begun bankrolling efforts to halt the recent progress California has made on its climate legislation. Two large funders of the anti-AB 32 initiative, Texas-based companies Valero Energy Corp. and Tesoro Corp., both operate facilities which, out of those that will be regulated under AB 32, are among the most responsible for both overall potential health impacts and disproportionately polluting neighborhoods of color and the poor. Amid industry cries for postponing implementation of California’s climate legislation, taking account of the total added economic and health rewards for Californians should be a top regulatory priority. Closing the climate gap is also key. AB 32 requires consideration of “direct, indirect, and cumulative emission impacts from these GHG reduction mechanisms, including localized impacts in communities that
are already adversely impacted by air pollution.” It further requires that measures to reduce emisions are designated in a way that “maximizes additional environmental and economic co-benefits for California, and complements the state’s efforts to
Tesoro Wilmington Refinery, September 25, 2009
AB 32 and Its Discontents
The current efforts to suspend AB 32, if successful, may create lost opportunities to clean up California’s dirty air. Two of the major contributors to that campaign, Texas oil companies Valero and Tesoro, together operate four major refineries in the state – the sector found in this study to pose the greatest local pollution burden on all communities, but particularly low-income communities and communities of color. Further analysis reveals that these two oil companies are leading contributors to pollution-induced health problems and the state’s dirty air disparity. Both operate facilities that are among the worst ten percent of all facility-level health impacts using a health impacts index that was calculated for all facilities following the measure indicated in Bailey et al. (2008) and are on the top ten list of worst contributors to the disparity index developed in this study. If we group refineries in California by company, Tesoro ranks worst in health impacts among all companies with refining operations in the state. Tesoro also ranks second among the seven major refining companies in California in the ratio of particulate matter that accompanies their GHG emissions, and the ratio of potential health consequences to GHG emissions. This suggests that reducing GHG emissions at these sort of facilities could do more to clean up California’s air than reducing the same amount of GHG emissions at other facilities. The current approach to implementation of AB 32 may need some tweaks to better protect the most vulnerable communities. If, however, implementation of AB 32 is blocked or delayed, all Californians and particularly low-income communities and communities of color will lose out on potential health benefits.
4
Minding the Climate Gap
improve air quality.” If regulators meet such legal obligations of AB 32 and implement the legislations as intended, more Californians are likely to support taking action now and all Californians will receive the benefits of these investments.
Analyzing Major Polluters to Prevent Unintended Consequences This report looks at the most significant GHGemitting facilities (power plants, petroleum refineries and cement kilns) in California and identifies the local burden to people from the accompanying hazardous pollution. While the analysis builds on earlier research by the Natural Resources Defense Council on the overall burden from these facilities, this is the first report of its kind to explicitly consider the demographic disparity in that burden and the implications for carbon market strategies. To do this, we use maps and geographic analysis of the racial, ethnic, and economic character of the surrounding neighborhoods to quantify which populations are currently suffering the most from these facilities’ harmful emissions, and therefore have the most to gain from a smarter approach to reducing carbon. Without knowing how many allowances will be auctioned, at what price, and to which sectors, it is not possible to forecast exactly what trades could occur. Similarly, it is hard to estimate cost curves for every facility to be regulated and use those estimates to predict whether a firm will choose to pay a carbon fee or instead reduce production or engage in technological improvements. And even if all such information were known, any prediction would be error prone given the level of flexibility that would be required of any market that is likely to take effect, making it especially important to include measures to guard against inequitable outcomes. Given the uncertainty, this report instead identifies the contribution to air pollution from these facilities in surrounding neighborhoods and uses the demographics of the neighborhoods to calculate
disparities in those emissions; it examines the potential negative outcomes that could result from trading among these facilities; and it proposes policy options for an efficient greenhouse gas reduction strategy that would maximize public health and provide the greatest overall benefits to California. The analytics to do this are complex in their details but relatively straightforward to explain. First, we identified the most significant facilities by looking at the California Air Resource Board’s (CARB) first annual data release under the state’s mandatory GHG Reporting Program and combining this information with data on other pollutant emissions, such as PM10. Second, we undertook an extensive process to locate the facilities by crossreferencing several databases and then conducting visual checks with satellite imagery (see Figure 1 for the resulting map and the appendix for more on the method). Third, we used a series of proximity analyses based on a range of distances from half a mile to six miles (the latter distance is perhaps too generous but it is the benchmark used by the California Energy Commission in its environmental justice analysis of any proposed location for a power plant) around each facility. The proximity analyses were used to determine which communities might be affected by emissions and to consider the varying demographics of the communities. Finally, we calculated a pollution disparity index for each facility – a measure of the extent to which a facility disproportionately pollutes people of color as compared to non-Hispanic whites – based on both its pollution level and the local demographics (see
5
Minding the Climate Gap
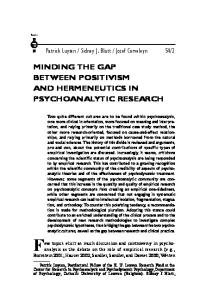
Figure 1: Major GHG-Emitting Facilities in California
´
Vallejo
#
!
!
Benicia
# Crocket
#
#!
Martinez
#! ###!
!
#! !
Pittsburg !
! ! !! ! ! ! ! ! ! #!# ! # ! !! # ! ! ! !!! ! ! ! ! "!! ! " ! ! ! !! ! ! ! !!
! Stockton
! Oakland
San Francisco !
!
Antioch
Concord
! # !! !!
#Richmond
"
!!
Bay Point !
!
! !
" San Jose
! ! !! ! ! ! ! !! # # ! ! ! # ! " ! ! !" " ! "" ! ! " !! ! ! !! !" ! ! !"! ! # ! # ! # # ! !! " ! ! ! !! ! ! !!
!
Modesto
! ! ! !
!
# #
!
!
! ! ! ! !! ! Oildale !
!
## ##
Bakersfield
!
Mckittrick !
!
!
San Bernardino
!!
!
!
Los Angeles
!
!
!
! ! Riverside
#
! # !# # !# Long Beach # ! #!# !
#
!! !
" ! "
"
Santa Ana !
# Facilities
% People of Color
"
Cement Kiln
Less than 37%
#
Petroleum Refinery
37% to 70%
!
Power Plant
Greater than 70%
Torrance
Carson
# # Wilmington # #
Lomita
(Los Angeles)
#
Figure 5 for a description of the pollution disparity index). The resulting dataset allowed us to examine several issues. In particular, the individual disparity indices could be added up to calculate the statewide disparity score to assess the overall statewide gap
!# !
in proximity to pollution. And because we had the individual facility data, we could also ascertain the contribution to that overall gap of any particular facility as well as the relative contribution of the major sectors to be regulated.
6
Minding the Climate Gap
Figure 2: Percentage Households Within 2.5 Miles of any Facility by Income and Race/Ethnicity in California
Figure 3: Population-Weighted Average Annual Particulate (PM10) Emissions Burden (Tons) by Race/Ethnicity for Facilities within 2.5 Miles
Non-Hispanic White
People of color experience over 70% more particulate (PM10) pollution from large GHG-emitting facilities within two and a half miles than non-Hispanic whites.
Latino
Asian/Pacific Islander
Population - Weighted Average Emissions (Tons)
African American
Percentage of Households
18%
15%
12%
Household Income (1999)
We find the following: • While the composition of neighborhoods more than six miles away from any large GHG-emitting facility is 54 percent non-Hispanic white and 46 percent people of color, neighborhoods that are closer – within various distance bands such as six miles, two and a half miles, or one mile – are about 40 percent non-Hispanic white and 60 percent people of color. • Children in poverty, along with all people in poverty, are also disproportionately near major GHG-emitting facilities. However, it’s not just this income factor driving the apparent racial disparity: people of color are more likely to live near these facilities than their white peers in the same income bracket (see Figure 2). • Within California, people of color are more likely to be near those large GHG-emitting facilities with the highest emissions of other pollutants such as particulate matter and/or clusters of facilities where such pollutants accumulate to high levels. Overall people of color experience over 70 percent more particulate matter emissions within two and a half miles from the facilities listed as major GHG emitters as non-Hispanic whites,
12 10
Gap
8 6
11.54
4
6.73 4.81
2 0 All People of Color
Non-Hispanic White
Difference
Figure 4: Population-Weighted Average Annual Particulate (PM10) Emissions Burden (Tons) by Facility Category and Race/Ethnicity for Facilities within 2.5 Miles
Population -Weighted Average Emissions (Tons)
$ 10 0K
9%
14
14
12
Petroleum refineries account for the largest portion (93%) of the state-wide PM10 pollution disparity score, or difference between the emissions burdens for people of color and non-Hispanic whites.
Source of Emissions: Power plant Petroleum refinery
10
Gap
Cement plant
8 6 4 2 0
All People of Color
Non-Hispanic White
Difference
and the disparity is particularly sharp for African Americans. • As noted, to quantify the gap more exactly in terms of sectors and individual facilities, we created a pollution disparity index to capture racial disparity in PM10 emissions at the facility level based on combining particulate matter emissions with an analysis of the population living within certain distances of the facilities in question. Figure 3 provides one visual representation of the overall gap (or statewide disparity score), which can be derived by adding up the pollution disparity index across all facilities and is equal to the difference in emissions burden borne by people of color and non-Hispanic whites
7
Minding the Climate Gap
in California. While we focus on racial disparities here, the same sort of analysis of income disparities leads to similar conclusions.
cement kilns (which are the fewest in number) generate the most pollution per facility. However, petroleum refineries contribute most to the disproportionate burden partly because they are most likely to be sited in densely populated communities of color.
• Petroleum refineries, a major source of greenhouse gases, are also a leading contributor of other pollutants, such as PM10. Figure 4 breaks the burdens and difference in burdens by source type for people of color and non-Hispanic whites in California; as can be seen, refineries account for a large portion of the pollution burden faced by all people statewide, and contribute even more to the racial disparity in pollution burden – or the difference in PM10 emissions burden by race/ ethnicity.
• If we rank all the facilities in California by their individual pollution disparity indices, we find that the top ten facilities (eight refineries, one power plant, and one cement kiln) are responsible for the vast majority of the air pollution disparity by race/ethnicity (see Figure 5) , due in part to their location proximate to communities of color (see Figure 6).
• The relative importance of refineries in this pattern may be surprising given that there are more electrical power plants statewide, and
• What this means is that if facilities in this top ten are allowed to avoid actual emissions reductions by procuring an inordinate share of allowances
Figure 5: Distribution of the Pollution Disparity Index for PM10 at 2.5 Miles Across All Major GHG-Emitting Facilities Top 10 Facilities Polluting Disproportionately in Communities of Color
Rank
Facility Name
City
Pollution Disparity Index
1
BP Carson Refinery
Carson
2
Tesoro Wilmington Refinery
Wilmington (Los Angeles)
1.44 1.01
3
Paramount Refinery
Paramount
0.62
4
ConocoPhillips Wilmington Refinery
Wilmington (Los Angeles)
0.52
5
ExxonMobil Torrance Refinery
Torrance
0.40
6
Chevron Richmond Refinery
Richmond
0.32
7
Malburg Generating Station (Vernon Power Plant)
Vernon
0.31
8
ConocoPhillips Carson Refinery
Carson
0.29
9
Valero Wilmington Refinery
Wilmington (Los Angeles)
0.24
California Portland Cement Company Colton Plant
Colton
0.16
10
Calculation of the Pollution Disparity Index
Particulate Matter (PM)
2.5 mile buffer
-1.5
-1.0
-0.5
0.0
0.5
Pollution Disparity Index
1.0
1.5
The pollution disparity index measures the extent to which a facility disproportionately pollutes people of color as compared to non-Hispanic whites. It is calculated by considering total pollutants produced by the facility (tons of particulate matter), the number of people within a certain distance of the facility, and the demographics of that population. The resulting disparity index can be added up across all facilities to get the state-wide disparity score – or gap – in pollution burden by race/ethnicity.
8
Minding the Climate Gap
Figure 6: Map of Top Ten Facilities in Pollution Disparity
´
Pinole an Rafael
Chevron Richmond Refinery
# Richmond
# Berkele
Stockton
Facilities
% People of Color
"
Cement Kiln
#
Less than 37%
Petroleum Refinery
37% to 70%
!
Power Plant
Greater than 70%
! # # #
"
San Jose
#ExxonMobil Torrance Refinery
California Portland Cement Colton Plant
Carson
Torrance
Paramount Refinery
BP Carson Refinery
## #
ConocoPhillips Carson Refinery Lomita Wilmington (Los Angeles) ConocoPhillips Wilmington Refinery
#
Los Angeles
"
! Vernon Power Plant
#
Tesoro Wilmington Refinery
# Valero Wilmington Refinery
during allowance allocations, paying fees, or trading their way out of reductions, the current pattern of inequity could worsen. On the other hand, minimizing allocations and purchases of allowances and incentivizing actual reductions among these particular facilities could go a long way towards erasing pollution disparities and maximizing the public health benefits of AB 32. • While there are legitimate concerns about outcomes resulting from allowance distribution and trading within a sector – such as when a power plant located near a large population in a low-income community of color eschews GHG reductions in favor of buying credits from another power plant located in an unpopulated area – the most harmful impacts on public health and fairness are more likely to result from the
Riverside
# Long Beach # # ## Santa Ana Santa Ana
distribution of allowances and trades between sectors. • In particular, because much of the pollution disparity we identify is due to refinery emissions, allowing such refineries to trade or pay their way out of local GHG emissions reductions could leave potential equalizing benefits on the ground.
The Policy Opportunities: Closing the Climate Gap How do we turn this problem of unequal pollution burden into an opportunity for improving environmental equity and public health? How could a GHG reduction strategy maximize opportunities to
9
Minding the Climate Gap
clean up dirty air, reduce healthcare costs, decrease pollution burden disparities, and build support among more Californians for taking action on climate change without delay? When thinking through policy opportunities, it is important to realize that the potential disparities we discovered would be part of any market system, including the carbon fee strategy favored by some opponents of cap-and-trade. While fees may be better than cap-and-trade for other reasons, one system allows polluters to pay their way out of local GHG emissions reductions while the other allows them to trade their way out – thus, the disparity and health issues we raise are important for advocates from various sides of the regulatory debate over how to incentivize real greenhouse gas reductions where they are most needed. The menu of market-based and regulatory approaches below outlines strategies to prevent the concentration of more air pollution in climate gap neighborhoods and maximize the health benefits for all Californians.
Necessary Components for Any Market System A crucial prerequisite to adopting any GHG reduction system is the need for the California Air Resources Board to create a mechanism for monitoring allowance allocations and trades or fee payments. Any framework developed to reduce each facility’s carbon output below a target level should also assess the impact of associated pollutants emitted from those same smokestacks.
Policy Options One solution would be assigning a price to copollutants. By raising carbon fees (or making emissions allowances more expensive) in areas with the greatest concentrations of both co-pollutants and people, polluters would have a financial incentive to reduce emissions where health benefits could be maximized. The challenge here is the added complexity in developing a trading or fee system in
which allowances or fees must factor in co-pollutants and population densities instead of just homogenous units of carbon. A simpler approach might be to vary permit prices (or fees) by the average relationship between co-pollutants and GHGs in different sectors, but this is would be highly inefficient due to not considering the substantial variation in marginal health co-benefits from GHG reduction that appears to exist at the facility level. The four options described below might be easier to implement.
Option 1: Restrict Allowance Allocations and Trading or Fee Options Among the Worst Offenders The full report summarized here identifies the facilities that emit the most significant amount of GHGs along with the air pollution that contributes significantly to California’s pattern of environmental disparity. This small number of facilities could be required to reduce emissions locally to meet their contribution to achieving the statewide carbon cap, rather than essentially paying others to reduce through either purchasing (or otherwise acquiring) allowances at allowance auctions (or other forms of allowance allocation), buying them from other facilities through trading, or relying on what are known as “offsets” – basically projects or activities that yield a net GHG emissions reduction for which the ownership of the reduction can be transferred (e.g. slowing deforestation somewhere across the globe). In a fee system, these facilities could be restricted in their capacity to pay fees rather than change operations.
10
Minding the Climate Gap Option 2: Create Trading Zones Drawing zones that limit trading based on whether the surrounding neighborhoods are currently suffering from extremely poor air quality is a strategy that has already been tested in California. As Kaswan (2009) suggests, certainty in achieving actual reductions in prioritized areas would also largely depend on how allowances were distributed with trading playing a small role, for example, if facilities are able to purchase all the allowances they need for any compliance period at auction or if they are able to rely on offsets to make up the difference between allowance holdings and emissions. While geographic restrictions on trading, allowances, and offsets do impose a layer of complexity, they are an objective and evidenced-based mechanism to create incentives for facilities located in dirtier air zones to reduce emissions, thus maximizing local benefits.
Option 3: Use Surcharges to Improve Highly Impacted Areas A third strategy involves the imposition of surcharges on allowances in highly polluted neighborhoods, with the funds being returned for environmental and other mitigations in those same areas. This establishes a tight connection or “nexus” between the pollution sources and payments for affected areas. It also lifts up the principle of “cumulative impacts” – that is, that special efforts should be made in areas with multiple sources of pollution.
Option 4: Create a Climate Gap Neighborhoods Fund (also known as a Community Benefits Fund) In this scenario, neighborhoods with the dirtiest air and/or significant socio-economic challenges would have access to a share of any revenue generated from a carbon fee or carbon allowances to reduce air pollution and invest in other climate mitigation strategies. While the geographic nexus between the emitters and the communities receiving benefits is somewhat looser in this scheme than in the surcharge approach, it may be a more efficient and more widely accepted path to protecting the people
already breathing the dirtiest air in California’s most impacted and vulnerable neighborhoods.
Avoiding Unintended Consequences and Seizing Opportunities While it is not possible to predict the exact outcome of any market system for carbon reduction in California, it is likely that one based solely on decreasing greenhouse gas emissions will, at a minimum, fail to realize the full benefits of reduced air pollution and, at a maximum, worsen current patterns of inequality. It is essential to ensure that any market-oriented regulatory system – either cap-and-trade or fees – avoids concentrating more air pollution sources in communities already breathing the dirtiest air. This report identifies four relatively simple and easy-toimplement policy strategies to avoid unintended health consequences and take advantage of the hidden opportunities: 1. Restrict allowance allocations, trading and offset use – or fee options – among facilities responsible for the worst health impacts. 2. Create trading zones to incentivize pollution reduction in the areas with the dirtiest air. 3. Use revenues to improve air quality in highly polluted areas and enhance the ability of local residents to adapt to climate change impacts.
11
Minding the Climate Gap
4. Create a climate gap neighborhoods fund to protect California’s most vulnerable neighborhoods. Most important will be the development of a monitoring system that tracks allocations and trading of allowances and use of offsets (or fee payments) to ensure that such a system does not exacerbate the inequities depicted here, and to enable other mitigation policies to be triggered as needed. This system could also incorporate the impacts from other facilities and sources and allow for the analysis of the “direct, indirect, and cumulative impacts…on communities that are already adversely impacted by air pollution” as called for in the legislation. In order to successfully confront the climate change challenge, policymakers need to develop a system that will work and that Californians will support. As Minding the Climate Gap demonstrates, GHG reduction policies that maximize public health and economic benefits are not only efficient and sensible, but could be relatively simple to implement. California faces a big challenge but also a big opportunity. We are poised to lead not only in curbing climate change, but also in closing the climate gap. As other states and the nation move forward, the impact of this work will multiply. We should get this right – and fair – from the beginning.
Methodology This report builds on earlier work by Diane Bailey, Kim Knowlton, and Miriam Rotkin-Ellman (in a 2008 report entitled Boosting the Benefits: Improving Air Quality and Health by Reducing Global Warming Pollution in California that was released by the Natural Resources Defense Council). Their report sought to understand the aggregate health impacts of facilities likely to be regulated under AB 32; we sought to look at disparate impacts, which required highly accurate locational data as well as up-to-date emissions data. We used 2008 GHG emissions data from CARB’s first annual release under the state’s mandatory GHG
Reporting Program and PM10 and NOx data from the 2006 CARB Emissions Inventory for stationary sources. Facility locations were determined by crossreferencing the facility names and addresses given by CARB Emissions Inventory with data from the GHG Reporting Program, a power plants database maintained by the California Energy Commission, and a dataset of facility locations from the U.S. Environmental Protection Agency (EPA), which provided geographic coordinates in addition to addresses. We followed this with a visual locational check using aerial imagery in Google Earth, and, in some cases, following up with web-research on location, including official documentation (reading permit history, for example) and phone calls to parent companies. Because in-depth emissions modeling was beyond the scope of this effort, we determined affected communities by drawing buffers of different sizes from the facility’s point location. We started with the smallest unit of Census geography, the block, and considered whether the center of that block fell into a designated buffer; we then population-averaged up to the block group (a geographic unit that is smaller than the a census tract) because this was the most geographically compact level at which detailed income information was available. Multiple buffers were used to ensure that the patterns we found were not being distorted by buffer size choices. We then developed a series of pollution disparity indices that took into account both population and pollution; in the full report and in the discussion in this summary, we confine our attention to PM10 because the results for NOx are similar and we focus on a 2.5 mile buffer because those results were most correlated with the results from an air basin wide health impacts index developed by Bailey and her colleagues and also used here.
References References are available in the full report which is available at: http://college.usc.edu/pere/publications
Minding the Climate Gap
About the Research Team DR. RACHEL MORELLO-FROSCH is Associate Professor in the Department of Environmental Science, Policy and Management and the School of Public Health at the University of California, Berkeley. Dr. Morello-Frosch’s research examines race and class determinants of environmental health among diverse communities in the United States. A focus of her work is the relationship between segregation and environmental health inequalities associated with air pollution, children’s environmental health, and the intersection between economic restructuring and community environmental health. Currently, Dr. Morello-Frosch collaborates with colleagues and environmental justice organizations to research and address climate justice issues, including the social equity implications of proposed greenhouse gas reduction strategies in California associated with the AB 32 Scoping Plan; and disparities in community capacity to adapt to environmental impacts of climate change. Her work is funded by the National Institutes of Health, the National Science Foundation, the California Environmental Protection Agency, the California Wellness Foundation, and the California Endowment, among others. Dr. Morello-Frosch currently serves on the Health Impacts Assessment Advisory Committee for the implementation of the AB 32 Scoping Plan. DR. MANUEL PASTOR is Professor of Geography and American Studies & Ethnicity at the University of Southern California where he also serves as Director of the Program for Environmental and Regional Equity (PERE) and co-Director of USC’s Center for the Study of Immigrant Integration (CSII). Pastor holds an economics Ph.D. from the University of Massachusetts, Amherst, and has received fellowships from the Danforth, Guggenheim, and Kellogg foundations and grants from the Irvine Foundation, the Rockefeller Foundation, the Ford Foundation, the National Science Foundation, the Hewlett Foundation, the MacArthur Foundation, the California Environmental Protection Agency, the
12
California Wellness Foundation, and many others. His most recent book, co-authored with Chris Benner and Martha Matsuoka, is This Could Be the Start of Something Big: How Social Movements for Regional Equity are Reshaping Metropolitan America (Cornell University Press, 2009). Dr. Pastor served on the Regional Targets Advisory Committee, a group advising the California Air Resources Board on methods to set goals for the reduction of greenhouse gas emissions through better land use planning. DR. JAMES L. SADD is Professor of Environmental Science at Occidental College, Los Angeles, California. He earned his doctorate in geology at the University of South Carolina, Columbia. His research includes spatial analysis using geographic information systems and remote sensing tools, particularly to evaluate questions related to environmental exposure. His recent research is supported by contracts and grants from the Andrew W. Mellon Foundation, US Army Corps of Engineers, US Navy Office of Naval Research, NOAA SeaGrant. Dr. Sadd served on the Nationally Consistent Environmental Justice Screening Approaches Work Group, advising on the EPA’s Environmental Justice Strategic Enforcement Screening Tool (EJSEAT). JUSTIN SCOGGINS is a data analyst at the Program for Environmental and Regional Equity at the University of Southern California. Since graduating with an MS in applied economics and finance from the University of California, at Santa Cruz, he has been assisting with research around issues of social justice, specializing in statistical analysis of patterns of environmental injustice, labor market intermediaries, and regional equity. He has published articles in both the Journal of Urban Affairs and the Journal of Planning Education and Research.
14
Minding the Climate Gap
Department of Environmental Science, Policy and Management University of California, Berkeley 137 Mulford Hall Berkeley, CA 94720-3114
USC Program for Environmental & Regional Equity Program for Environmental and Regional Equity University of Southern California 3620 S. Vermont Avenue, KAP 462 Los Angeles, CA 90089-0255 Email:
[email protected] Phone: 213.821.1325 Fax: 213.740.5680
Minding the Climate Gap Report