DEALS INTELLIGENCE - FULL YEAR 2015
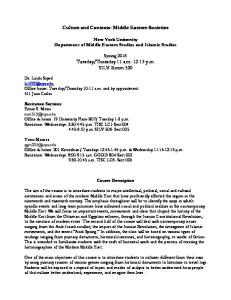
MIDDLE EASTERN IB ANALYSIS INVESTMENT BANKING FEES – According to estimates from Thomson Reuters / Freeman Consulting, Middle Eastern investment banking fees reached US$636.4 million during full year 2015, 16% less than the value recorded during full year 2014 and the lowest annual period for investment banking fees in the region since 2012. Fees from completed M&A transactions totalled US$213.1 million during full year 2015, a 4% increase compared to a year ago and the only investment banking product in the region to see a year-over-year gain. M&A fees accounted for 33% of the overall Middle Eastern investment banking fee pool, the highest annual share since fee records began in 2000. Equity capital markets underwriting declined 33% compared to last year, while syndicated lending fees totalled US$278.6 million, down 16% from 2014. Fees from debt capital markets underwriting declined 33% year-onyear to US$59.1 million. HSBC earned the most investment banking fees in the Middle East during full year 2015, a total of US$62.9 million for a 9.9% share of the total fee pool and up 2.1 wallet share points compared to a year ago. HSBC also topped the completed M&A fee rankings, while Nomura was first for DCM underwriting. EFG Hermes took the top spot for ECM underwriting fees in the region with 15.5% share. Mitsubishi UFJ Financial Group took the top spot in the Middle Eastern syndicated loans fee ranking with US$18.2 million in fees for 6.5% of the market. MERGERS & ACQUISITIONS - The value of announced M&A transactions with any Middle Eastern involvement reached US$56.2 billion during full year 2015, 13% more than the value registered during the same period in 2014 and marking the best annual period since 2008. Outbound M&A drove activity, up 34% from 2014 to reach US$35.2 billion, the highest annual total since 2008. Overseas acquisitions from the United Arab Emirates accounted for 46% of Middle Eastern outbound M&A activity, while acquisitions by companies based in Qatar and Saudi Arabia accounted for 36% and 10%, respectively. Domestic and inter-Middle Eastern M&A decreased 16% year-on-year to US$11.3 billion. Inbound M&A also saw a marked increased, up 29% to US$5.4 billion. Healthcare was the most active sector, accounting for 24% of Middle Eastern involvement M&A. The largest deal with Middle Eastern involvement during the year was the US$11.1 billion acquisition of South Africa-based Mediclinic International by Al Noor Hospitals Group PLC. Morgan Stanley topped the full year 2015 announced any Middle Eastern involvement M&A league table with US$18.4 billion in advisory credit. EQUITY CAPITAL MARKETS - Middle Eastern equity and equity-related issuance totalled US$5.7 billion during the full year 2015, a 50% decline from full year 2014 and the slowest annual period for equity capital markets issuance in the region in two years. Eleven initial public offerings raised US$2.6 billion and accounted for 45% of full year activity in the region. Follow-on and convertible offerings accounted for 17% and 38%, respectively. Aabar Investments PJSC raised US$2.2 billion from a convertible offering in March, the largest equity offering in the region during the year. HSBC took first place in the full year 2015 Middle Eastern ECM ranking with 16.5% market share. DEBT CAPITAL MARKETS - Middle Eastern debt issuance reached US$6.2 billion during the fourth quarter of 2015, a significant increase compared to the value raised during the previous quarter. Despite the quarterly increase, full year bond issuance in the region decreased 19% from last year to US$30.2 billion during full year 2015, marking the lowest annual total since 2011. The United Arab Emirates was the most active nation accounting for 60% of activity, followed by Bahrain with 9%. International Islamic debt issuance declined 23% yearon-year to reach US$28.9 billion during full year 2015. Nomura took the top spot in the Middle Eastern bond ranking during 2015 with a 27% share of the market.
MIDDLE EASTERN IB FEE VOLUMES ($Mil) Middle Eastern IB Fees Volumes $1,600 YTD Fees
Rest of Year Fees
$1,400 $1,200
Fees (US$ mil)
$1,000
$800 $600
$400 $200
$102
$86
$138
$140
$275
$571
$942 $1,502 $1,200 $644
$728
$422
$564
$778
$754
$636
2000
2001
2002
2003
2004
2005
2006
2010
2011
2012
2013
2014
2015
$0
2007
2008
2009
-$200
Annual Middle Eastern IB Fees by Product $1,600
40% Syn Loans
35%
33%
DCM
31%
ECM
$1,200
30%
M&A
26%
Fees (US$ mil)
ECM as a % of Total IB Fees
$1,000
25% 21%
$800
19%
19%
18%
18%
16% 14%
$600
20%
17% 13%
$400
15% 10%
7%
% of Total Middle Eastern IB Fee Pool
$1,400
35%
6%
$200
5% 1%
$0
0% 2000
2001
2002
2003
2004
2005
2006
2007
2008
2009
2010
2011
2012
2013
2014
2015
*Products Included: M&A (closed deals), ECM (IPO, Follow-On, Convertibles, Rights, Block Trades, ABB), DCM (ABS/MBS, High Grade and High Yield Bonds), Syndicated Loans
Source: Thomson Reuters/Freeman Consulting
DEALS INTELLIGENCE - FULL YEAR 2015
MIDDLE EASTERN IB ANALYSIS MIDDLE EASTERN IB FEE RANKINGS Middle Eastern IB Fee League Tables ($Mil) FULL YEAR 2015 Rk 1 2 3 4 5 6 7 8 9 10
Manager HSBC Holdings PLC Citi JP Morgan Credit Suisse Moelis & Co Barclays Deutsche Bank Mitsubishi UFJ Financial Group BNP Paribas SA Sumitomo Mitsui Finl Grp Inc Total
Mkt Shr % 9.9% 5.6% 4.9% 4.0% 3.4% 3.2% 3.1% 2.9% 2.7% 2.5% 100.0%
$ $ $ $ $ $ $ $ $ $ $
Fees 62.69 35.40 31.10 25.49 21.95 20.46 19.47 18.17 16.91 16.10 636.36
Rk 1 2 3 4 5 6 7 8 9 10
FULL YEAR 2014 Manager HSBC Holdings PLC Barclays BNP Paribas SA Deutsche Bank Lazard Mizuho Financial Group Bank of America Merrill Lynch Emirates NBD PJSC Moelis & Co Goldman Sachs & Co Total
Mkt Shr % 7.8% 4.3% 4.2% 4.0% 3.9% 3.7% 3.6% 3.5% 3.3% 3.2% 100.0%
$ $ $ $ $ $ $ $ $ $ $
Fees 58.79 32.33 31.97 30.08 29.73 27.98 26.76 26.74 25.17 23.75 753.61
Mkt Shr % 14.5% 12.3% 7.6% 6.8% 6.4% 6.2% 6.1% 5.3% 4.0% 2.9% 100.0%
$ $ $ $ $ $ $ $ $ $ $
Fees 29.73 25.17 15.57 14.01 13.02 12.72 12.56 10.95 8.26 6.00 204.74
Mkt Shr % 19.8% 11.6% 11.3% 9.0% 6.0% 5.6% 4.1% 3.8% 3.5% 2.8% 100.0%
$ $ $ $ $ $ $ $ $ $ $
Fees 25.46 14.94 14.56 11.51 7.69 7.21 5.26 4.85 4.47 3.60 128.31
Mkt Shr % 13.1% 8.5% 6.4% 6.0% 5.8% 5.6% 5.2% 4.6% 4.4% 4.2% 100.0%
$ $ $ $ $ $ $ $ $ $ $
Fees 11.56 7.56 5.69 5.31 5.17 4.98 4.56 4.11 3.89 3.69 88.50
Mkt Shr % 8.0% 5.2% 5.2% 3.8% 3.8% 3.4% 3.3% 3.3% 3.2% 3.2% 100.0%
$ $ $ $ $ $ $ $ $ $ $
Fees 26.56 17.32 17.18 12.76 12.71 11.44 11.11 10.87 10.74 10.68 332.07
Middle Eastern M&A Fee League Tables ($Mil) FULL YEAR 2015 Rk 1 2 3 4 5 6 7 8 9 10
Manager HSBC Holdings PLC Credit Suisse Moelis & Co Citi JP Morgan Houlihan Lokey Evercore Partners Barclays Morgan Stanley Bank of America Merrill Lynch Total
Mkt Shr % 15.2% 11.6% 10.3% 8.5% 5.3% 5.2% 5.1% 4.9% 4.3% 4.0% 100.0%
$ $ $ $ $ $ $ $ $ $ $
Fees 32.45 24.65 21.95 18.03 11.25 11.17 10.93 10.41 9.14 8.42 213.10
Rk 1 2 3 4 5 6 7 8 9 10
FULL YEAR 2014 Manager Lazard Moelis & Co BNP Paribas SA Simmons & Co International Deutsche Bank Barclays Bank of America Merrill Lynch Scotiabank Goldman Sachs & Co Rothschild Total
Middle Eastern ECM Fee League Tables ($Mil) FULL YEAR 2015 Rk 1 2 3 4 5 6 6 6 6 10
Manager EFG Hermes HSBC Holdings PLC Deutsche Bank Riyadh Bank Ltd National Bank of Kuwait SAK BNP Paribas SA Barclays Societe Generale Bank of America Merrill Lynch Goldman Sachs & Co Total
Mkt Shr % 15.5% 12.1% 11.1% 7.1% 7.0% 6.1% 6.1% 6.1% 6.1% 4.8% 100.0%
$ $ $ $ $ $ $ $ $ $ $
Fees 13.22 10.34 9.49 6.07 5.99 5.23 5.23 5.23 5.23 4.13 85.58
Rk 1 2 3 4 5 6 7 8 9 10
FULL YEAR 2014 Manager HSBC Holdings PLC Qatar National Bank Bank Muscat SAOG Emirates NBD PJSC EFG Hermes JP Morgan Goldman Sachs & Co Banque Saudi Fransi National Bank of Abu Dhabi Bank of America Merrill Lynch Total
Middle Eastern DCM Fee League Tables ($Mil) FULL YEAR 2015 Rk 1 2 3 4 5 6 7 8 9 10
Manager Nomura HSBC Holdings PLC JP Morgan Standard Chartered PLC National Bank of Abu Dhabi Citi Bank Muscat SAOG Emirates NBD PJSC Dubai Islamic Bank PJSC BNP Paribas SA Total
Mkt Shr % 13.5% 9.4% 7.9% 7.7% 7.4% 7.3% 4.9% 3.5% 3.4% 3.0% 100.0%
$ $ $ $ $ $ $ $ $ $ $
Fees 7.97 5.55 4.70 4.56 4.38 4.31 2.92 2.10 1.99 1.77 59.08
Rk 1 2 3 4 5 6 7 8 9 10
FULL YEAR 2014 Manager HSBC Holdings PLC Bank of America Merrill Lynch Emirates NBD PJSC ANZ Banking Group Deutsche Bank Citi Standard Chartered PLC National Bank of Abu Dhabi JP Morgan BNP Paribas SA Total
Middle Eastern Syn Loan Fee League Tables ($Mil) FULL YEAR 2015 Rk 1 2 3 4 5 6 7 8 9 10
Manager Mitsubishi UFJ Financial Group Sumitomo Mitsui Finl Grp Inc Saudi British Bank HSBC Holdings PLC Samba Financial Group Banque Saudi Fransi JP Morgan BNP Paribas SA Citi Natl Comml Bank Saudi Arabia Total
Mkt Shr % 6.5% 5.8% 5.5% 5.1% 4.9% 4.2% 4.0% 3.6% 3.4% 3.1% 100.0%
$ $ $ $ $ $ $ $ $ $ $
Fees 18.17 16.06 15.26 14.34 13.59 11.57 11.04 9.90 9.38 8.54 278.61
Rk 1 2 3 4 5 6 7 8 9 10
FULL YEAR 2014 Manager Mizuho Financial Group HSBC Holdings PLC Barclays Natixis BNP Paribas SA KfW IPEX-Bank GmbH ING National Bank of Abu Dhabi Sumitomo Mitsui Finl Grp Inc Mitsubishi UFJ Financial Group Total
Source: Thomson Reuters/Freeman Consulting
DEALS INTELLIGENCE - FULL YEAR 2015
MIDDLE EASTERN M&A ANALYSIS M&A FUNDAMENTALS Announced Any Middle Eastern Involvement M&A Volumes $140
Value, Rest of Year
-
Value, YTD
$120
YTD Announced Any Middle Eastern Involvement M&A Financial Advisor Ranking 900
YTD 2015 YTD 2014 Financial Advisor Rank Rank
800
# Deals, YTD
1 2 3 4* 4* 6 7 8 9 10 11
600 $80
Number of Deals
Rank Value (US$ bln)
700 $100 500
-
400
$60
-
-
-
-
58.2
300
-
-
$40
-
200
$20
100 52.4 132.0 75.3
47.8
55.7
32.8
40.5
42.2
49.9
56.2
$0
4 5 13* 48* 8 3 1 6 2 27
0
Value ($ mln)
Morgan Stanley Rothschild Goldman Sachs & Co Rand Merchant Bank Jefferies LLC Bank of America Merrill Lynch Barclays Citi HSBC Holdings PLC JP Morgan Qatar National Bank Industry Total
Mkt. Shr.
18,396.5 14,840.1 14,822.0 11,082.0 11,082.0 7,777.2 6,475.2 5,957.5 5,070.1 4,200.3 2,940.0 56,214.9
# of deals
32.7 26.4 26.4 19.7 19.7 13.8 11.5 10.6 9.0 7.5 5.2 100.0
10 7 3 1 1 6 6 13 13 5 1 641
2005 2006 2007 2008 2009 2010 2011 2012 2013 2014 2015
Announced Middle Eastern Target M&A Volumes $45
Value, Rest of Year
$40
600
Announced Any Middle Eastern Involvement M&A by Target Macro Industry
Value,YTD
-
500
# Deals, YTD
Target Macro Industry
$30
400
-
$25 -
$20 $15
300
-
-
-
200
-
$10 $5
-
16.0
5.0
Number of Deals
Rank Value (US$ bln)
$35
100 40.0
28.0
13.4
18.2
10.1
22.3
21.8
17.6
16.7
$0
0 2005 2006 2007 2008 2009 2010 2011 2012 2013 2014 2015
Healthcare Energy and Power Real Estate Financials Industrials Media and Entertainment Telecommunications Materials Retail Consumer Staples High Technology Consumer Products and Services Industry Total
YTD 2015 Value Mkt. (US$mil) Share 13,585.5 24.2 10,453.4 18.6 9,270.9 16.5 6,087.2 10.8 5,755.0 10.2 2,938.2 5.2 2,499.7 4.5 1,980.7 3.5 1,484.0 2.6 1,082.2 1.9 813.8 1.5 264.4 0.5 56,214.9 100.0
No. YTD 2014 Value Deals (US$mil) 37 513.6 59 8,640.7 76 19,206.8 108 4,845.7 79 6,259.6 60 1,355.5 13 1,083.5 55 4,647.2 37 1,022.8 47 631.8 28 184.6 42 1,513.5 641 49,905.3
ANNOUNCED MIDDLE EASTERN M&A DEAL FLOW Rank Value in US$ billions (YoY % Change)
Inbound US$5.4 bln (+29%)
Outbound US$35.2 bln (+34%)
Inbound M&A - Most Acquisitive Nations
Outbound M&A - Most Acquisitive Nations
Hong Kong
28%
United States of…
United Arab Emirates
23%
Singapore
16%
Saudi Arabia
36% 10%
Outbound M&A - Most Targeted Nations
Inbound M&A - Most Targeted Nations Egypt
36%
United Arab Emirates
35%
Kuwait
46%
Qatar
Inter-Middle Eastern M&A
South Africa China
US$11.3 bln (-16%)
16%
United States of America
32% 15% 14%
ANY MIDDLE EASTERN INVOLVEMENT M&A: TOP DEALS
Value (mil)
Date Target Name
Target Nation Sector
Acquiror Name
Status
Target Advisors
Acquiror Advisors
11,082.0 14-Oct-15 Mediclinic International Ltd 5,000.0 30-Mar-15 Shandong Dongming Petrochem 3,150.0 17-Dec-15 Exeter Ppty Grp LLC-Industrial
South Africa China United States
Healthcare Energy and Power Real Estate
Al Noor Hospitals Group PLC Investor Group Henley Holding Co
Pending Morgan Stanley Pending Completed -
2,940.0 22-Dec-15 Finansbank AS
Turkey
Financials
QNB
Pending
Morgan Stanley Goldman Sachs & Co
QNB Capital Llc JP Morgan
2,833.3 21-May-15 Dragon Oil PLC
Utd Arab Em
Energy and Power
Emirates National Oil Co Ltd
Completed
Nomura International PLC Davy Corporate Finance
Barclays Bank of America Merrill Lynch
Rothschild -
DEALS INTELLIGENCE - FULL YEAR 2015
MIDDLE EASTERN ECM ANALYSIS ECM FUNDAMENTALS Middle Eastern ECM - YTD Volumes
Middle Eastern ECM - Quarterly Volumes
$35
80
$7.0
14
Value ($bln) ECM Value $bln
# Issues
# Issues
70
$30
$6.0
12
$5.0
10
$4.0
8
$3.0
6
$2.0
4
10
$1.0
2
0
$0.0
60
$25 50 $20 40
$15 30
1.2 1.0 0.7 1.2 0.0 3.3 0.3 1.0 0.5 3.3 2.5 0.6 1.9 0.9 0.8 0.6 0.9 2.4 1.9 6.2 2.8 2.6 0.2 0.3
Middle Eastern ECM - YTD Most Active Issuing Nations
United Arab Emirates
$1,064
Healthcare
$250
Other
$675
Consumer Staples
$397
$482
Real Estate
(US$ mil)
$299
(US$ mil)
TOP ECM BOOKRUNNERS MIDDLE EASTERN ECM RANKING Rank 1 2 3 4* 4* 4* 4* 8 9 10
Bookrunner HSBC Holdings PLC Deutsche Bank EFG Hermes Barclays BNP Paribas SA Bank of America Merrill Lynch Societe Generale Riyadh Bank Ltd National Bank of Kuwait SAK JP Morgan Industry Total
Value ($ mln) 948.1 867.6 581.3 436.8 436.8 436.8 436.8 220.8 218.0 149.5 5,744.1
Mkt. Shr. # of deals 16.5 3 15.1 3 10.1 5 7.6 1 7.6 1 7.6 1 7.6 1 3.8 2 3.8 1 2.6 1 100.0 20
TOP MIDDLE EASTERN ECM Proceeds ($ mil)
2,184.1
Date
Issuer
Nation
Sector
Issue Type
Exchange
24-Mar-15
Aabar Investments PJSC
Utd Arab Em
Financials
CVT
FrankftOTC
752.0
9-Jun-15
Saudi Ground Services Co
Saudi Arabia
Industrials
IPO
Saudi Exch
333.8
5-May-15
Integrated Diagnostics Hldg
Egypt
Healthcare
IPO
London
319.5
14-Apr-15
Al Noor Hospitals Group PLC
Utd Arab Em
Healthcare
FO
London
299.0
18-Jun-15
Emaar Misr for Development SAE Egypt
Real Estate
IPO
Egypt
264.0
31-Mar-15
Edita Food Industries SAE
Consumer Staples
IPO
London
Egypt
Bookrunners Deutsche Bank AG (London) Bank of America Merrill Lynch BNP Paribas SA Barclays Bank PLC Societe Generale HSBC Saudi Arabia Ltd Deutsche Bank AG (London) EFG Hermes Citigroup Global Markets Ltd Deutsche Bank AG (London) EFG Hermes JP Morgan Goldman Sachs International EFG Hermes
Q4 2015
Q3 2015
Q2 2015
Q1 2015
Q4 2014
Q3 2014
$2,544
Industrials
$1,045
Oman
Q2 2014
Financials
$1,226
Egypt
Q1 2014
Middle Eastern ECM - YTD Most Active sectors
$2,826
Saudi Arabia
Q4 2013
0 Q3 2013
5.7 2015
Q2 2013
11.4 2014
Q1 2013
4.2 2013
Q4 2012
6.9 2012
Q3 2012
4.6 2011
Q2 2012
4.2 2010
Q1 2012
3.5 2009
Q4 2011
31.0 2008
Q3 2011
19.3 2007
Q2 2011
13.2 2006
Q1 2011
10.1 2005
Q4 2010
1.4 2004
$0
Q3 2010
$5
Q1 2010
20
Q2 2010
$10
DEALS INTELLIGENCE - FULL YEAR 2015
MIDDLE EASTERN DCM ANALYSIS DCM FUNDAMENTALS Middle Eastern DCM - YTD Volumes
$45
80
$40
Middle Eastern DCM - Quarterly Volumes
$25
30
70
25
$20
$35
60
$30
50
$25
20 $15
15
40 $20
30
$15
$10 10
20
$10
$5
5
10
$5 8.2
14.5
28.2
26.7
17.2
39.0
36.9
29.4
38.3
39.3
37.4
30.2
2004
2005
2006
2007
2008
2009
2010
2011
2012
2013
2014
2015
$0
5.9 7.2 9.0 14.8 5.7 5.1 3.4 15.210.4 8.0 6.2 13.612.114.1 5.0 8.2 7.3 19.3 6.8 4.0 7.0 16.2 0.8 6.2
-
Value ($ bln)
$0
0 Q1 Q2 Q3 Q4 Q1 Q2 Q3 Q4 Q1 Q2 Q3 Q4 Q1 Q2 Q3 Q4 Q1 Q2 Q3 Q4 Q1 Q2 Q3 Q4 10 10 10 10 11 11 11 11 12 12 12 12 13 13 13 13 14 14 14 14 15 15 15 15 Value ($ bln)
# of Issues
# of Issues
Middle Eastern DCM - Most Active Issuing Nations United Arab Emirates
$18,289
Bahrain
$2,796
Egypt
$1,886
Oman
$1,726
Other
(US$ mil)
$5,457
International Islamic DCM Volumes - YTD Volumes
International Islamic DCM Volumes - Quarterly Volumes
$40
140 Value ($ bln)
$35
120 # of Issues
$30
$20
7
$18
6
Value ($ bln)
$16 # of Issues
100
$25
80
5
$14 $12
4
$10
$20 60
$8
40
$6
$15 $10
3 2
$4
20
$5 4.7
5.9
10.5
24.7
18.2
23.0
13.8
32.9
36.9
33.3
37.5
28.9
$0
2004
2005
2006
2007
2008
2009
2010
2011
2012
2013
2014
1
$2 $0
Q1 Q2 Q3 Q4 Q1 Q2 Q3 Q4 Q1 Q2 Q3 Q4 Q1 Q2 Q3 Q4 Q1 Q2 Q3 Q4 Q1 Q2 Q3 Q4 10 10 10 10 11 11 11 11 12 12 12 12 13 13 13 13 14 14 14 14 15 15 15 15
2015
TOP DCM BOOKRUNNERS FULL YEAR 2015 MIDDLE EASTERN DCM RANKING Rank
Mkt. Shr.
# of deals
Value ($ mln)
Mkt. Shr.
# of deals
Nomura
8,146.3
27.0
6
1
CIMB Group Sdn Bhd
4,931.3
17.1
35
2
HSBC Holdings PLC
2,538.8
8.4
20
2
HSBC Holdings PLC
2,992.7
10.4
17
3
Citi
2,510.0
8.3
15
3
Malayan Banking Bhd
2,928.1
10.1
28
4
Standard Chartered PLC
2,114.1
7.0
19
4
RHB
2,689.8
9.3
24
5
National Bank of Abu Dhabi
2,095.7
7.0
16
5
Standard Chartered PLC
2,139.6
7.4
21
6
JP Morgan
1,826.6
6.1
8
6
AMMB Holdings Bhd
1,406.7
4.9
14
7
BNP Paribas SA
926.0
3.1
6
7
Dubai Islamic Bank PJSC
1,337.9
4.6
12
8
Morgan Stanley
717.7
2.4
5
8
National Bank of Abu Dhabi
1,181.4
4.1
10
9
Emirates NBD PJSC
700.2
2.3
9
9
JP Morgan
1,114.1
3.9
4
Societe Generale
621.3
2.1
3
10
968.3
3.4
6
30,153.3
100.0
62
28,923.0
100.0
87
10 -
Financial Advisor
FULL YEAR 2015 INTERNATIONAL ISLAMIC DCM RANKING
Value ($ mln)
1
Industry Total
Rank
-
Financial Advisor
Citi Industry Total
TOP MIDDLE EASTERN DCM ISSUES Proceeds Date ($ mil)
Issuer
Nation
Sector
Currency
7,908
22-Jun-15
Emirates NBD Bank PJSC
Utd Arab Em
Commercial Bank
STG
1,600
30-Oct-15
Lebanon
Lebanon
National Gov't
US
1,500
17-Nov-15
Bahrain
Bahrain
National Gov't
US
1,486
4-Jun-15
Egypt
Egypt
National Gov't
US
1,000
14-Jan-15
Dubai Islamic Bank PSJC
Utd Arab Em
Commercial Bank
US
1,000
5-Mar-15
IDB Trust Services Ltd
Switzerland
Mtg Securities
US
1,000
29-Apr-15
Lamar Funding Ltd
Cayman Islands
Mtg Securities
US
750
27-May-15
DIB Sukuk Limited
Utd Arab Em
Mtg Securities
US
DEALS INTELLIGENCE - FULL YEAR 2015
MIDDLE EASTERN IB ANALYSIS CONTACTS Thomson Reuters is the world’s leading source of intelligent information for businesses and professionals. We combine industry expertise with innovative technology to deliver critical information to leading decision makers in the financial, legal, tax and accounting, scientific, healthcare and media markets, powered by the world’s most trusted news organization. With headquarters in New York and major operations in London and Eagan, Minnesota, Thomson Reuters employs more than 50,000 people in 93 countries. For more information, go to www.thomsonreuters.com Thomson Reuters Deals Intelligence, a part of Thomson Reuters Banking & Research division, brings up to the minute market intelligence to our clients and the financial media through a variety of research reports including Daily Deals Insight, weekly Investment Banking Scorecard, and our industry-leading quarterly reviews highlighting trends in M&A and Capital Markets. For more information, go to: http://dmi.thomsonreuters.com @dealintel Contact Information: Americas/EMEA: Matthew Toole I +1 646-223-7212 I
[email protected] Asia: Elaine Tan I +632-858-4387 I
[email protected]
GLOSSARY *ME / Middle East - includes the following countries: Bahrain, Egypt, Iraq, Iran, Jordan, Kuwait, Lebanon, Oman, Qatar, Saudi Arabia, Syria, United Arab Emirates and Yemen *ISLAMIC FINANCE - Islamic Finance transactions are deals that prohibit the receiving of interest payments. Trade financing for these transactions is obtained through the purchase of inventory that will be resold at a pre-determined price on a future date (or "Murabaha"). * FEES- fees are calculated using Freeman & Co. proprietary algorithm where spreads or fees are not disclosed. Deal fees are on a gross basis before all expenses. Each underwriter or advisor is allocated its share of deal fees using Freeman & Co. allocation methodology, based on the number of underwriters or advisors on the deal and their role. No fees are allocated to syndicated members. Industry totals include fees on deals with undisclosed advisors. * M&A- The Thomson Reuters Mergers & Acquisitions database tracks changes in economic ownership at ultimate parent level in going business concerns. All deals involving a purchase of at least a 5% stake, or 3% with a value of at least US$1 million are tracked, subject to criteria. League tables include rank eligible mergers, acquisitions, repurchases, spin-offs, self-tenders, minority stake purchases and debt restructurings. League tables, commentary, and charts citing announced activity are based on Rank Date and include intended, pending, partially complete, completed, pending regulatory, and unconditional transactions. Rank Date is defined as the earliest public announcement of when a value can be applied to a transaction. * ECM- The Thomson Reuters Equity Capital Markets database covers domestic and international placements of equity offerings in addition to domestic and international equity-related transactions. This includes IPOs, follow-on offerings, accelerated bookbuilds and block trades (with certain restrictions) and convertible bonds. Convertible Bonds with a minimum life of less than 360 days are excluded. Minimum life defined as the difference between the settlement date and the earliest maturity date or first call/put option. * DCM- The Thomson Reuters Debt Capital Markets database covers underwritten debt with an issue size of over US$1 million, that matures in at least 360 days from settlement. It includes all internationally offered underwritten debt transactions in all currencies, Domestic issuance, Preferred Securities, High Yield and Emerging Market transactions that are offered in US and Globally, Asset Backed Securities, Mortgage Backed Securities, Collateralized Debt Obligations (CDOs), MTN takedowns and Certificate of Deposits, except in UK. Primary offerings only. All league tables are based on deal proceeds (total issue amount multiplied by the issue price) unless otherwise stated. Full credit is given to the bookrunner, equal if joint books. In cases of underwriter consolidation, credit is given to the surviving/parent firm. Non-US dollar denominated transactions are converted to the US dollar equivalent at the time of announcement.
While Thomson Reuters has used reasonable endeavors to ensure that the information provided in this document is accurate and up to date as at the time of issue, neither Thomson Reuters nor its third party content providers shall be liable for any errors, inaccuracies or delays in the information, nor for any actions taken in reliance thereon, nor does it endorse any views or opinions of any third party content provider. Thomson Reuters disclaims all warranties, express or implied, as to the accuracy or completeness of any of the content provided, or as to the fitness of the content for any purpose to the extent permitted by law. The content herein is not appropriate for the purposes of making a decision to carry out a transaction or trade and does not provide any form of advice (investment, tax, legal) amounting to investment advice, nor make any recommendations or solicitations regarding particular financial instruments, investments or products, including the buying or selling of securities. Thomson Reuters has not undertaken any liability or obligation relating to the purchase or sale of securities for or by any person in connection with this document.