Methodology and experimental setup for neuromarketing studies Prof. Fabio Babiloni Dept. Molecular Medicine, University of Rome «Sapienza», Rome, Italy BrainSigns srl, Rome, Italy
0
2
Introduction to the neuromarketing techniques for the evaluation of the commercial advertisings
2
Babiloni: Corso di Neuroeconomia e Neuromarkerting
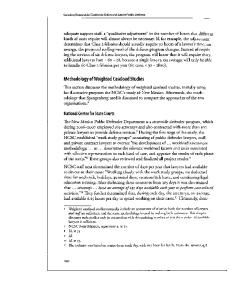
Devices used for the collection of the cerebral activity in response to external stimuli EEG
Electroencephalography
EKG Heart Rate (HR) and Galvanic Skin Response (GSR)
Mounting Electrode Cap Eye-Tracker
Biometric recording in different contest for different goals
3
Babiloni: Corso di Neuroeconomia e Neuromarkerting
METHODOLOGY: How to measure the relevant variables for the evaluation of commercial advertising
4
4
Babiloni: Corso di Neuroeconomia e Neuromarkerting
These variables can be measured during the evaluation of the commercial advertising by using EEG, HR and GSR
Approach
Withdrawal Interest
Memory Attenzione
Attention 5
Babiloni: Corso di Neuroeconomia e Neuromarkerting
Emotion
Neuroscience and marketing science: a possible marriage • A neuromarketing research performs typically a collection of
6
relevant consumer’s neurophysiologic signals subjected to an advertising sensory stimulation (i.e. a videoclip, a picture etc)
Electroencephalography
(EEG) is the recording of the electrical brain activity through a net of sensors posed on the subject’s head. Returns information about the «cognitive» processes undergoing during the adv observation.
Heart Rate (HR) , and/or Skin Conductance (Galvanic
Skin Response; GSR) signals could be also recorded in order to collect answers from the sympathetic and parasympathetic nervous system, linked with the perceived «emotional response» during the adv observation
•
Neurophysiological signals gathered (EEG, HR, GSR) return information about the different memorization, attention and emotional perception of the adv 6
Babiloni: Corso di Neuroeconomia e Neuromarkerting
Electroencephalographic techniques are able to track cognitive attention and memorization for ads •
•
•
High resolution EEG techniques are able to return accurate information about the cerebral spatiotemporal activity during the observation of sensory percepts in humans (Babiloni et al., 1996; 2003; 2005) Several papers have been demonstrated that existing a strict link between the EEG activity in a particular set of frequency bands (theta, beta, gamma) and particular cognitive event such as visual attention and memorization (from minutes to several hours based; Klimesh et al, 1999; Summerfield et al, 2005) It is hence possible to use the EEG technology and the variation of the power spectra in those frequency bands to track time-dependent changes of visual attention and memorization during the sensory perception of commercial ads (De Vico Fallani et al., 2008; Astolfi et al., 2008; Vecchiato et al., 2009) Summerfield, C., Mangels, J.A. Coherent theta-band activity predicts item-context binding during encoding. NeuroImage 24,692–703 2005. 7
Babiloni: Corso di Neuroeconomia e Neuromarkerting
7
Detail of the methodology and reason why’s to use one or other techniques (in our case EEG, GSR and HR instead fMRI)
It is possible to use the joint EEG, GSR and HR measurements for the detection of cerebral variables related to attention, memorization and emotive engage for different reasons listed below. EEG, GSR and HR techniques have the necessary timeresolution to follow the brain processes. In fact these EEG has a time resolution very high (fraction of second versus ten seconds as for hemodynamic measurements; i.e fMRI). They return information on different aspects of the cerebral activity, i.e EEG returns information on attention and memorization processes, while GSR and HR returns information on the emotive engage. The nature of these variables are multidimensional, and measuring only the cerebral aspect with the hemodynamic part is not complete nor useful. Such techniques are portable and could be applied in a naturalistic context to measure the subject during exposition to faces, products or video related to marketing activities, or even during focus group or observation of products in POS.
Babiloni: Corso di Neuroeconomia e Neuromarkerting
8
EEG device
GSR and HR device
Portability of EEG and possibility to estimate cortical activity using realistic model of the 8 head
Misurare lo stato interno durante la fruizione di un percetto sensoriale Es: Spot TV 9
Raccolta dell’attività cerebrale Come: EEG Cosa dà: – Attenzione – Memorizzazione
Raccolta della risposta emotiva Soggetto Test
Come: Risposte corporee (sudorazione, battito cardiaco) Cosa dà: Sfumature emotive
Acquisizione ed elaborazione dei dati biometrici
9
Babiloni: Corso di Neuroeconomia e Neuromarkerting
A reduced set of electrodes is sufficient if episodic memory and focusing attention are the target variables to be used in neuromarketing experiments
Episodic memory processes are generated in the prefrontal cortices and have a counterpart in theta frequency band (Klimesh, 1999; Summerfield et al., 2005) In addition, the frontal cerebral systems are those engaged in the maintenance of the attentional focus while posterior systems are responsible for the switch of the attention in humans (Posner), in the alpha2 frequency band. Thus, in the case in which memory encoding of the observed percept is looked for the sampling of the cerebral frontal areas is sufficient. For this reason a subset of frontal electrodes of the 1010 International system has been adopted for the collection of the cerebral data in our recordings In addition, available data from literature (Davidson, 1990, 1994, 1997 and successives) suggest how frontal cerebral cortices are also engaged in appreciation of the sensory percepts, as observed by using EEG data. The unbalance of the spectral EEG power in the alpha frequency band is related to the approach/withdrawal behavior and to the interest variable employed
Babiloni: Corso di Neuroeconomia e Neuromarkerting
EEG cap
EEG device
10
GSR and HR device
TV spot
11
Babiloni: Corso di Neuroeconomia e Neuromarkerting
Print matters
12
Babiloni: Corso di Neuroeconomia e Neuromarkerting
Variation of the EEG tracks attention and memorization during observation of sensory percepts •
We demonstrated and published that it is possible to detect signs of memorization for commercial ads by using EEG (Astolfi et al 2009, Vecchiato et al, 2009, 2010, 2011). • In the figure on the right, the red areas of the brain, viewed in a frontal perspective, highlight the cortical areas in which the activity during the observation of commercial ad that will remembered are higher when compared to the cerebral areas activated during the observation of forgotten ads. • Time varying spectral power of the recorded EEG traces are statistically linked with the memorization and attention during the ads • We hence used statistically significant EEG activity when compared to the baseline activity of the subject to track in time such cognitive variables. Babiloni: Corso di Neuroeconomia e Neuromarkerting
13
Tracking the cerebral activity during the observation of a commercial ad in different groups
Less activation on cerebral areas during brand exposition in population 1
14
More activation during the brand exposition on population 2
Babiloni: Corso di Neuroeconomia e Neuromarkerting
The analysis performed and the typical outputs • Recorded • •
• • •
the electroencephalographic EEG activity through a cap of electrodes in a non invasive way. Used realistic head models of head as volume conductor to assess the brain activity in the appropriate cortical areas. Used the collection of the heart rate (HR) through two electrodes placed on the left hand and right hand of the subject to assess the emotional state. Used the collection of the galvanic skin response (GSR) to assess the state of stress of the subject on the left hand. If required (optional solution), used a eyetracking device for the monitoring of the eyegaze position during the video observation. Spectral analysis of the EEG waveforms, and of the HR, GSR signals will be used and the results could be integrated with the eye-tracking in form of time-varying outputs for the indexes AI, MI, EE during the spot.
Babiloni: Corso di Neuroeconomia e Neuromarkerting
15
Summary: EEG, GSR and HR signals are able to track time-varying cognitive and emotional states •
•
•
•
•
At the end of this section we illustrated how modern neuroelectrical imaging techniques are able to track cognitive cerebral activity with high temporal (milliseconds) and spatial resolution (at the level of Brodmann areas). This statement is supported by more than 100 specific papers in scientific literature in the last 5 years (make a search for LORETA or high res on MEDLINE). With the EEG techniques is thus possible to track signs of memorization and attention on a msec base. With the use of Heart Rate and the Galvanic Skin Response is possible to infer the emotional state of the subject. On the right figure is presented an example of the track of emotionall activity during observation of a commercial clip, in color statistical significant activity with respect to the baseline (watching a documentary). Vecchiato et al,Computational intelligence and neuroscience, 2009
Babiloni: Corso di Neuroeconomia e Neuromarkerting
16
Details on the measurement of a baseline • • • • •
•
The measuring and the definition of the baseline is fundamental in neuroscience experiments. In our application of the EEG, GSR and HR measurements the baseline will be that recorded by the same subject being exposed to the same class of stimuli related to the marketing experiments but without their informative content. In other words, we need to remove all the confounds (variables that are not modelled in the experiment) by including them in the baseline. An example could help. Suppose to want collect EEG, GSR and HR data related to the observation of a commercial ads. There are a lot of variables that cannot be controlled, such as the person’s arousal in that moment of the day, his/her particular internal state (happy, not happy, bored etc). Hence, we need not only to collect the EEG, GSR and HR data while the subject is viewing nothing and successively when he view the ad, but we need to collect his/her cerebral and autonomic data while he/she is viewing the TV but without the ad of interest, for instance a documentary or a film. In this way all the same variables related to the sitting in front of a screen, viewing something in TV, etc, are paired and remains only the differences between what has been viewed.
17
Babiloni: Corso di Neuroeconomia e Neuromarkerting
The control of individual differences •
How is it possible to control the individual differences that could be so high between subjects? In fact, each persons arrive at the recording site with his/her personal blood pressure, heart rate, level of arousal etc etc. If we made an average of these values, we will get a great standard deviation (or variance) of the measured data.
•
The use of gaussian z-score statistic allow to remove the dependence of the collected data from the individual variations. In particular, the new data are obtained in this way for instance for the HR data of each participant to the test.
•
First, the mean HR and its standard value during the baseline condition has to be computed (mHR, sHR).
•
Then, on the actual values of HR during the test the following transformation applies
•
ZHR data = (actual value of HR data – mHR) / sHR
•
The new ZHR variable is statistically significant if is superior to 1.96, is sommable with the other z-scores obtained in the other subjects belonging to the same population investigated.
•
The individual differences not related are removed since each subject acts as a control of him/herself
Babiloni: Corso di Neuroeconomia e Neuromarkerting
HR 90
HR 120
HR 80
HR 70
HR 100
All these persons arrive to the test site with different HR since each one is different from the other The same is true for the other cerebral 18 variables
How we are going to control individual differences and avoid the impact of habituation •
The use of z-score make possible to control the individual differences in a statistical sense. In this proposal for all the variables gathered (i.e. EEG, GSR and HR) we will apply the z-score transformation.
•
Habituation is an important confound when the level of arousal of the person could change during the repetition of boring task. In this respect, the only analytical way to take into account the fluctuations of the arousal is the re-estimation of the baseline of the subject during the execution of the experimental task.
•
This will allow to the experimenters to re-compute the “baseline” for the subject during the test.
•
An example could explain better this procedure: suppose to record the GSR activity in a subject during a long test. Before you measured the baseline A (Bs A in the figure). Then you start a test B (for instance the manipulation of an object). If the test is long enough, it could be that the subject becames bored and its level of arousal changes. In this case to take another baseline (removing the stimuli from the subject) will take into account the habituation problem (Bs C). Then the test could continue (Test D). The values of the tests have to take into account this change in baseline.
Test D
Test B Bs C
GSR
Baseline is changed for habituation from A to C
Bs A 19
Babiloni: Corso di Neuroeconomia e Neuromarkerting
Summary: EEG, GSR and HR signals are able to track time-varying cognitive and emotional states •Modern neuroelectrical imaging techniques are able to track cognitive cerebral activity with high temporal (milliseconds) and spatial resolution (at the level of Brodmann areas) •This statement is supported by more than 1000 specific papers in scientific literature in the last 5 years (make a search for LORETA or high res on MEDLINE) •With the EEG techniques is possible to track signs of memorization and attention on a msec base •With the use of Heart Rate and the Galvanic Skin Response is possible to infer the emotional state of the subject •On the right figure is presented an example of the track of cerebral activity during observation of a commercial clip, in color statistical significant activity with respect to the baseline (watching a documentary)
20
Vecchiato et al,Computational intelligence and neuroscience, 2009
Babiloni: Corso di Neuroeconomia e Neuromarkerting
20
Misurare lo stato interno durante la fruizione di un percetto sensoriale Es: Spot TV 21
Raccolta dell’attività cerebrale Come: EEG Cosa dà: – Attenzione – Memorizzazione
Raccolta della risposta emotiva Soggetto Test
Come: Risposte corporee (sudorazione, battito cardiaco) Cosa dà: Sfumature emotive
Acquisizione ed elaborazione dei dati biometrici
21
Babiloni: Corso di Neuroeconomia e Neuromarkerting
Come si misura l’attività neuroelettrica … …. mediante sensori cerebrali, cardiaci, e di conducibilità cutanea 22
Filmato registrazione segnali fisiologici Babiloni: Corso di Neuroeconomia e Neuromarkerting
22
The measured cognitive and emotional variables can be represented graphically For the evalutation of the biometric response related to the observed TV commercials, we estimate the memorization, attention, pleasentness and emotion indexes from the EEG gathered traces. The memorization, pleasentness and attention indexes are estimated from the cerebral activity measured from the frequency spectrum of the EEG signal (Babiloni et al., 2006). Memorization
Pleasantness
Time
Time
Attention
Time
The emotion index is an indicator resulting from the combination of GSR and HR signals, interpreted as the scale alongside (Vecchiato et al., 2009). Emotion
23
Time Babiloni: Corso di Neuroeconomia e Neuromarkerting
Variation of the cerebral activity during the observation of a TV Commercial advertising for an analyzed sample population
The cerebral activity above the red line (0 value) indicates that the measured TV Commercial is perceived by the analyzed population better than baseline
The cerebral activity under the red line (0 value) indicates that the measured TV Commercial is perceived by the analyzed population worst than baseline Time
24
Babiloni: Corso di Neuroeconomia e Neuromarkerting
A TV Commercial can be analyzed frame by frame and in conceptual sequence: the frame segments In order to analyze the impact of the ad along the entire duration on the base of cerebral and emotional activities, a video is usually divided in several logical phases named frame segments,
related to different conceptual task in the ad creativity.
The temporal duration of each segment is represented in figures below by a colored line/area. Each temporal segment depends upon the TV Commercial; frequently the segments are like: Introduction, when the TV ad begins; Testimonial, where the testimonial appears; Product, devoted to presentation of the product or the service; Brand, with the appearance of the Company’s logo; Tail, which is a segment sometimes closing the ad with a flash recall of the narrative theme.
Introduction Speaker
Testimonial Product Brand Tutto
Time of the TV Commercial
Babiloni: Corso di Neuroeconomia e Neuromarkerting
Time of the TV Commercial
25
Variation of memorization and attention indexes during observation of sensory percepts In order to indicate the best and the worst received parts of the brodcasted TV advertising on the employed sample population indexes related to memorization and attention are used. Such indexes were estimated second by second along the TV ads, or also along the “frame segments” of it.
In this graph the memorization index increases until the product is presented. This is good, because the subject memorizes information related to the publicized product or service. Time
In this graph the attention index is low along the Tv Commercial, particularly during the initial phase of it. This is no good since it means that the attention of the subjects is not captured when the TV ads begins. The testimonial frame segment (the yellow area) is not high in attention and such index also decreases when the brand is proposed. In this case a different video montage or music could be suggested to better capture the sample attention. Babiloni: Corso di Neuroeconomia e Neuromarkerting
Time
26
Variation of pleasantness and emotion indexes during observation of sensory percepts
Time
In this graph the pleasantness index during the first phase of the testimonial (yellow area) is low. This is not good since means that subjects watch the TV ad without a particular pleasantness. The Product part of the TV ads (the green area) is observed with low pleasantness and also this is not good. Suggestions able to improve the quality of the TV spot perception will be to cut the Introduction and the first part of the testimonial appearance , to broadcast a reduced version of the TV ad.
The emotion index suggests that the initial part of this TV ad is not emotionally engaging. Emotion perceived by the analyzed subjects increases in this particular TV ad only when the product is presented and the brand is shown. Suggestions able to improve the emotional quality of the spot are related to the removal of the first part of it.
Time
Suggestions for the company: the product or service promoted is good, but the company could improve the narrative27 plot of its TV Commercial by reducing its length, because the initial part is not well received by the target sample Babiloni: Corso di Neuroeconomia e Neuromarkerting
When a TV advertising can be defined «a good advertising»?
Time Time
This is a typical example of a good TV advertisement, because the memorization index increases until the Product is presented in the clip. This is good, because the subject memorizes information related to the product. Also the pleasantness index is always positive along the TV ad. This means that the sample subjects are very interested when they watch the TV ad. Babiloni: Corso di Neuroeconomia e Neuromarkerting
28
When a TV advertising can be defined «a bad advertising»?
Time
Time
This is the typical example of a bad advertising because the attention index decreases until the product is presented. This is bad, because the subjects didn’t pay attention to the TV ad and especially to the product phase (during the green zone the attention is below the 0). Also the emotion index is always negative along the TV Ad. This is means that the subjects are not engaged positively during their watch of the TV Ad. Possible countermeasures to improve this situation could include the change of the music of the TV advertising, as well the reduction of the final part of the testimonial presence on the screen. 29 Babiloni: Corso di Neuroeconomia e Neuromarkerting
Two different emotional impacts: Cartier vs Prada parfum TV ads
In a TV commercial “Baiser Volé parfum by Cartier" a man and a woman are dancing until a final sweet kiss. The elegance of the spot lies in how everything was “hidden finely”. At the end, the really beautiful couple comes out of our field of vision, replaced by the parfum “Baiser Vole by Cartier” like suggesting that it’comes out as the result of their kiss. So the kiss is literally being stolen from our eyes while a low voice whispers in our ears that to see the end of the story we need to live it by buying the parfum.
The TV commercial “Prada Caddy parfum” shows the protagonist while seemingly docile and submissive, follows the piano lessons of his beautiful instructor, when suddenly, tired of so much study, jumps on him and involves him with her sex appeal in a crazy dance in the middle between a dance and a fight! Even the packaging of the perfume is engaging and lively, a cylindrical bottle that holds the perfume, honey-colored, with Prada written on a strip fuxia top.
Two emotional profiles different but in agreement with the campaigns styles: calm and positive the atmosphere in Cartier ad, more lively and aggressive that in Prada ad. 30
Babiloni: Corso di Neuroeconomia e Neuromarkerting
Tre variabili cerebrali per seguire l’impatto del messaggio pubblicitario •
E’ possibile seguire l’andamento dei processi di memorizzazione, attenzione e emozione durante l’osservazione di un percetto sensoriale (un filmato TV).
•
Questi andamenti vengono restituiti come variazioni di segnali relativi a tutta la popolazione analizzata. ATTENZIONE Alta
MEMORIZZAZIONE
31
EMOZIONE
Alta
Bassa
Bassa
Tempo dello spot
Tempo dello spot
Tempo dello spot
31
Babiloni: Corso di Neuroeconomia e Neuromarkerting
Dai pezzi del puzzle alla visione di insieme e viceversa
32
Emozione Memorizzazione
Tempo dello spot
Attenzione
Tempo dello spot
32
Tempo dello spot Babiloni: Corso di Neuroeconomia e Neuromarkerting
Dai pezzi del puzzle alla visione di insieme e viceversa
Key frame
33
Emozione Memorizzazione
10 8 6 4
Attenzione
2 0
-2
1
3
5
7
9 11 13 15 17 19 21 23 25 27 29
-4 -6 -8 Tempo dello spot
33
Babiloni: Corso di Neuroeconomia e Neuromarkerting
Quali risposte può fornire il neuromarketing •Un percetto sensoriale osservato o fruito verrà ricordato? 34
•Un percetto sensoriale ha provocato uno stato interno piacevole nel soggetto? •Un percetto sensoriale è stato fruito con attenzione cognitiva da parte del soggetto?
•Se stiamo testando uno spot, è possibile sapere quali parti verranno ricordate meglio?
34
Babiloni: Corso di Neuroeconomia e Neuromarkerting
Le informazioni che si ricavano e il loro impiego •Applicando le tecniche di neuromarketing alla pubblicità si riesce a scoprire quali elementi di un annuncio pubblicitario: hanno suscitato attenzione; hanno generato una traccia mnestica duratura; hanno indotto sensazione emotiva in linea con gli obbiettivi di comunicazione dell’azienda.
35
•In questo modo è possibile intervenire, ad esempio, per selezionare le scene più efficaci di uno
spot, massimizzandone la resa, in generale, così come in logica di ottimizzazione dei formati (dalla extended version a versioni ridotte).
35
Babiloni: Corso di Neuroeconomia e Neuromarkerting
Uno studio pilota condotto nel 2010 Esperienze su spot italiani
Al fine di validare gli indicatori, tempo fa abbiamo realizzato uno studio consistente nella raccolta delle risposte cerebrali e emotive di un campione di 40 soggetti adulti sottoposto alla visione di 40 spot reali di diverse categorie appena pianificati in TV e mai visti dal campione. Questi spot sono stati trasmessi in break pubblicitari all’interno di un documentario naturalistico della durata di circa 30’. Dopo circa 60 minuti dalla fine della seduta di registrazione biometrica, il campione è stato interrogato su Ricordo Spontaneo della pubblicità corretto (“[…] Lei si ricorda per caso qualche pubblicità e se si di quale ente o marca?” ), riconoscimento e gradimento. Per ogni singolo spot e soggetto sono stati analizzati i tracciati di attenzione, memorizzazione e engagement, calcolati gli indicatori quantitativi IM, IA e IE e correlati con il ricordo. L’unicità dello studio sta nel disporre di indicatori biometrici e di risposta verbale confrontabili in quanto ottenuti con la stessa metodologia e all’interno dello stesso campione. Di seguito 3 evidenze interessanti.
36
Babiloni: Corso di Neuroeconomia e Neuromarkerting
Esperienze spotcoinvolgere italiani Lesson Learnt 1: Pochi secondisuper il consumatore …
Durante la visione di uno spot da 30” in media 240 momenti di attenzione vs. 27 momenti di memorizzazione. Tradotto in tempo significa che una persona davanti a uno spot da 30” in media Mediamente una persona davanti a uno spot dedica: 30” dedica …
– 2,3 sec di attenzione; – 1,2 sec per la memorizzazione del contenuto. sec Cruciale che il brand o l’offerta siano compresi in questi pochi secondi. sec
37
Babiloni: Corso di Neuroeconomia e Neuromarkerting
spot italiani Lesson Learnt 2: L’IMEsperienze predice su efficacemente il ricordo di uno spot •C’è correlazione significativa tra l’Indice di Memorizzazione di uno spot e il numero di ricordanti il dato spot nei test a posteriori.
•E’ pertanto significativa la valutazione su base “biometrica” in pre-test della probabilità di memorizzazione di uno spot prima del suo impiego definitivo. 70%
Memorizzazione bassa
Mem. m. bassa
Mem. media
Mem. sostenuta
Mem. elevata Spot 12
60%
Spot 13
50%
% Ricordo
Spot 6 40%
Spot 11 Spot 7 Spot 10
30%
Spot 5 Spot 8
Spot 3
Spot 9
20%
Spot 4 10%
y = 0,90x - 0,02 R² = 0,68 (p