06-Corbin (Basics)-45428.qxd
8/20/2007
7:23 PM
Page 117
6 Memos and Diagrams To exercise maximum control over his experiences, the researcher requires an efficient system for recording them. Novices may think of note-taking and recording principally as devices that help with remembering and with the storage and retrieval of information. They are correct, but only on a rather mechanical level. . . . What our researcher requires are recording tactics that will provide him with an ongoing, developmental dialogue between his roles as discoverer and as social analyst. (Schatzman & Strauss, 1973, p. 9) Table 6.1
Definition of Terms
Diagrams: Visual devices that depict relationships between analytic concepts. Memos: Written records of analysis. Theoretical Sampling: Data gathering based on evolving concepts. The idea is to look for situations that would bring out the varying properties and dimensions of a concept.
Introduction The purpose of this chapter is to introduce the reader to memos and diagrams. Memos are a specialized type of written records—those that contain the products of our analyses. Diagrams also arise from analysis. They are visual devices that portray possible relationships between concepts. But memos 117
06-Corbin (Basics)-45428.qxd
8/20/2007
7:23 PM
Page 118
118——Basics of Qualitative Research
and diagrams are more than just repositories of thought. They are working and living documents. When an analyst actually sits down to write a memo or do a diagram, a certain degree of analysis occurs. The very act of writing memos and doing diagrams forces the analyst to think about the data. And it is in thinking that analysis occurs. Strauss (1987) states, “ . . . Even when a researcher is working alone on a project, he or she is engaged in continual internal dialogue—for that is, after all, what thinking is” (p. 110). In the 2nd edition of Basics, we broke memos down into several types— code notes, theoretical notes, and operational notes. In this 3rd edition, we want to get away from thinking about memos in a structured manner. The reason is that novice researchers often become so concerned with “getting it right” that they loose the generative fluid aspect of memoing. It is not the form of memos that is important, but the actual doing of them. However, one of the early reviewers of this text came up with an organizational scheme for the memo examples, used later in this chapter, that is quite descriptive and helpful in explaining the many types of memos that researchers can write. We present that scheme below. There are memos for: • • • •
Open data exploration Identifying/developing the properties and dimensions concepts/categories Making comparisons and asking questions Elaborating the paradigm: the relationships between conditions, actions/ interactions, and consequences • Developing a story line
—(courtesy of Anonymous Reviewer).
The important thing for the reader is that he or she not be concerned with writing memos according to each type. More important is to just get into the habit of writing memos. Writing memos should begin with the first analytic session and continue throughout the analytic process. Doing diagrams is more periodic but nevertheless very important. Doing memos and diagrams should never be viewed as chores, or as tasks to be agonized over. They are also not to be confused with finished papers ready for publication. Rather, memos and diagrams begin as rather rudimentary representations of thought and grow in complexity, density, clarity, and accuracy as the research progresses. One of the complaints we often hear from students is that writing memos and doing diagrams are just too time consuming. They say that they would rather make a few notes in the margins of their field notes. We puzzle over those remarks. Writing memos and doing diagrams are part of the analysis, part of doing qualitative work. They move the analysis forward and as such are just as important to the research process as data gathering itself.
06-Corbin (Basics)-45428.qxd
8/20/2007
7:23 PM
Page 119
Memos and Diagrams——119
Qualitative analysis involves complex and cumulative thinking that would be very difficult to keep track of without the use of memos. Furthermore, most research projects go on for several months at a minimum. Some extend for years. How could researchers remember what they were thinking months earlier unless those thoughts are written down some place? Then too, many studies are conducted by teams of two or more persons and researchers need a way to store and share their individual as well as mutual analytic sessions. Without memos and diagrams, it would be difficult to keep the lines of communication open between researchers or to retrace the process by which the researchers arrived at their final findings.
General Features of Memos and Diagrams There are some general features of memos and diagrams that would be analysts should be familiar with. We turn to these next. • Memos and diagrams vary in content, degree of conceptualization, and length, depending upon the research phase, intent, and the materials one is coding. In the beginning stages of analysis, memos and diagrams appear awkward and simple. This is of no concern. Remember, no one but the analyst (and possibly committee members) has access to the memos and diagrams • Though analysts can write on the actual interview or field notes, this is not practical, except perhaps in the earliest phases of open coding. We say this for several reasons: (a) It is difficult to write memos of any length or to diagram on field notes because usually there is insufficient space to develop ideas; (b) some of the original concepts may be revised as the analysis proceeds and these might be misleading and confusing when analysts return to a document to recode and are confronted by the old codes written in the margins; (c) it is difficult to retrieve information, in other words to combine or sort memos, if the margin of a field note or interview transcript is the only place where information has been stored; and (d) there are many computer programs available to assist with memo writing and diagramming, making it unnecessary to write in the margins of a document. Some of the texts and papers that are useful for introducing analysts to the pros and cons of computers for data analysis are Bong (2002); Fielding & Lee (1991& 1998); Kelle (1995& 1997); Lonkila (1995); Pfaffenberger (1988); Roberts & Wilson (2002); and Weitzman & Miles (1995). • Each analyst develops his or her own style for doing memos and diagrams. Some analysts use computer programs, others use color coded cards, while still others prefer putting written memos into binders, folders, or
06-Corbin (Basics)-45428.qxd
8/20/2007
7:23 PM
Page 120
120——Basics of Qualitative Research
notebooks. The method that the analyst uses for recording and managing memos is not as important as just doing them. However, we might add that computer programs now facilitate this process greatly. • While the contents of memos and diagrams are crucial to keeping a record of analyses they have functions in addition to storing information. Among the most important of these is that they force the analyst to work with concepts rather than raw data. Also they enable analysts to use creativity and imagination, often stimulating new insights into data. • Another function of memos and diagrams is that they are reflections of analytic thought. A lack of logic and coherence of thought quickly manifests itself when analysts are forced to put ideas down on paper. • Memos and diagrams provide a storehouse of analytic ideas that can be sorted, ordered and reordered, and retrieved according to the evolving analytic scheme. This ability becomes useful when it comes time to write about a topic, or when analysts want to cross-reference categories, or evaluate their analytic progress. Studying diagrams and reviewing memos can also reveal which concepts are in need of further development and refinement. • Analysts should code after every analytic session. In fact, the writing of memos often is the analytic session, especially for analysts working alone. However, it is not always necessary to do long memos or diagrams. When stimulated by an idea, an analyst should stop whatever he or she is doing and capture that thought on paper. A few generative ideas or sentences would suffice. When an analyst has more time, he or she can write a lengthier memo. • Summary memos can be written that synthesize the content of several memos. As the analysis moves along it is important that the analyst takes the time sit down and write a summary of where he or she thinks the analysis is at this point. Doing so really helps later with integration. Integrative diagrams can be used to visually display those ideas.
Specific Features of Memos and Diagrams In addition to the general features of memos, we offer some suggestions to make memos and diagrams more useful. There is nothing more frustrating than attempting to retrieve a memo that you recall writing but can’t find because it lacks identifying information. Some ideas for making memos and diagrams more useful include: • Date memos and diagrams. It is also helpful to include a reference to the document and raw data from which the memo was derived. (Including
06-Corbin (Basics)-45428.qxd
8/20/2007
7:24 PM
Page 121
Memos and Diagrams——121
an excerpt from the raw data is facilitated by the use of computer programs.) The reference can include the code number of the interview or observation; document; the date on which the data was collected; the page (and line number for those using computer programs); and any other means of identification that might prove useful later when retrieving the data. • Create a heading for each memo and diagram. This makes the contents more readily accessible. One can cross-reference memos or diagrams that relate two or more categories to each other. • Include short quotes or phrases of raw data in the memo. (Plus include date, page number and all other identifying information for easy retrieval.)
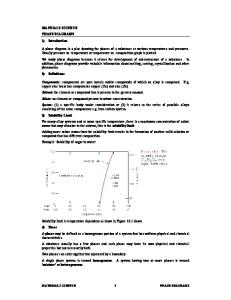
Screenshot 4
A memo is automatically “stamped” with the name of the author. In this example we also used the field to identify each memo within this book in the corresponding MAXQDA project. So, you can easily work simultaneously with the book data and the project data. Moreover, each memo can be given a title and can be linked to any of your codes (see chapter 5). A memo can be exported or printed out. A very useful feature is the option to freely define different memo types.
06-Corbin (Basics)-45428.qxd
8/20/2007
7:24 PM
Page 122
122——Basics of Qualitative Research
Screenshot 5
This screenshot shows how a memo is displayed at the very place where it is attached: between the text itself and the code visualisation. In this case, the brown symbol signifies that it is an exploratory memo. Mousing-over a memo will show an info screen indicating the memo title, author, creation date, and a preview of its text. The info fades out as soon as you move the mouse away.
These are handy reminders of the data that gave rise to a particular concept or idea (this happens automatically with computer programs). Later, when writing, the actual data can be used to illustrate that concept. • Regularly update memos and diagrams. As the analysis progresses new data leads to increased insight, therefore evolving into memos of more depth and complexity. • Keep a list of concepts and subconcepts available for reference (again this happens automatically with computer programs). This helps prevent duplication and oversight. • Take notice if several memos on different codes begin to sound alike. The analyst can recompare the concepts for similarities and differences, perhaps combining them or making notations of how they are different. • Keep multiple copies of memos or a computer back up of one’s work. A researcher who has lost important data due to computer failure knows how frustrating it can be not to have backup of the work. • Memos indicate when a category appears saturated—meaning when a category is well developed in terms of its properties and dimensions. Data
06-Corbin (Basics)-45428.qxd
8/20/2007
7:24 PM
Page 123
Memos and Diagrams——123
collection can then be directed towards other categories still in need of development. • If, as an analyst, you come up with two or more exciting ideas at the same time, you should jot down a few notes about each immediately. This way neither idea is lost and later they can write a memo on each. • Be flexible and relaxed when doing memos and diagrams. Worrying about correctness can stifle creativity and freeze thought. • Be conceptual rather than descriptive when writing memos. Memos are not so much about specific incidents or events, but about the conceptual ideas derived from these. It is the denoting of concepts and their relationships that move the research from raw data to findings. • Develop your own style and techniques for writing memos and doing diagrams. • Use a notebook or running log, separate from memos, to write up impressions of participant and researcher’s reactions during interviews or observations. A diary works well as a means of keeping an account of selfreflections during the entire research process.
Memos and Field Notes One of the reviewers of this text suggested that field notes are “in a way a form of memo.” Patton (2002) says, “Recording and tracking analytical insights that occur during data collection are part of fieldwork and the beginning of qualitative analysis” (p. 436). Whenever observations of events are made, the observations are filtered through the eyes of the researcher who can’t help but start thinking about and classifying the information. It just kind of happens spontaneously because persons tend to think consciously, or not in terms of concepts. And there is no reason not to jot down analytic ideas while in the field, for as Patton (2002) goes on to say, “ . . . repressing analytical insights may mean losing them forever, for there’s no guarantee they’ll return . . .” (p. 406). The point to be made is that if a researcher is out in the field collecting data, theoretical ideas will be stimulated by data and it is very appropriate to jot those theoretical ideas down before the researcher forgets them. In fact, it is almost impossible to be purely descriptive when writing about incidents out in the field because we naturally name and categorize what we see (Wolcott, 2001). However, I (Corbin) want to make a distinction between field notes and memos in order not to confuse novice researchers about the nature or importance of each. Field notes are data that may contain some conceptualization
06-Corbin (Basics)-45428.qxd
8/20/2007
7:24 PM
Page 124
124——Basics of Qualitative Research
and analytic remarks. Memos, on the other hand, are lengthier and more indepth thoughts about an event usually written in conceptual form after leaving the field. And as such, they are much more complex and analytical than any remarks that I might make on my field notes. For persons who are interested in ways of keeping memos and field notes separate in or out of the field, Schatzman and Strauss (1973) offer the following scheme. They suggest writing observational notes (ONs) that describe the actual events, writing theoretical notes (TNs) denoting the researchers thoughts about those events. And finally they suggest writing methodological notes (MNs) or reminders about some procedural aspect of the research (pp. 99–101). Complex note writing while out in the field might be difficult as the researcher might become so engrossed that he or she looses sight of what is going on. Lofland, Snow, Anderson, & Lofland (2006) help clarify “observational notes” with observational notes being reports of events or interactions observed in the “field.” Such notes might also include a description of the setting and perhaps some informal interviewing. Corbin follows a similar process when out in the field doing observational notes then writing memos when doing the analysis at home. For example, in the study of the articulation of patient care by head nurses, Corbin and Strauss (unpublished) wrote many memos based on Corbin’s observations. During each field work session, Corbin followed a head nurse, as a shadow, writing down to the best of her ability each thing that each head nurse did and said along with descriptions of the setting (there was never any problem with writing in notebooks as action occurred except for during psychotherapy sessions). At the end of the observational session, Corbin reviewed the day’s notes with the head nurse, going over the incidents and obtaining the head nurse’s explanations for his or her actions/interactions, serving as a kind of informal interview and verification session. Within the next day or so, Corbin would meet with Strauss and they would take each incident, analyze it, and write memos off their discussions using the same approach to analysis as they did with interviews. It was during the analytic sessions that interpretations and impressions of those incidents were derived. Our suggestion for field researchers would be to write observational notes documenting each incident, including as much description as possible, then to write memos from the observational notes–incident by incident—in a manner similar to interview data, always keeping in mind there is perhaps some conscious and unconscious analysis that occurs when gathering data.
Diagrams Everyone is familiar with diagrams. They are conceptual visualizations of data, and because they are conceptual, diagrams help to raise the researcher’s
06-Corbin (Basics)-45428.qxd
8/20/2007
7:24 PM
Page 125
Memos and Diagrams——125
thinking out of the level of facts. Diagrams enable researchers to organize their data, keep a record of their concepts and the relationships between them, and to integrate their ideas. Diagrams help researchers to explain their findings to colleagues and others in very systematic and organized ways. Most of all, doing diagrams forces a researcher to think about the data in “lean ways,” that is, in a manner that reduces the data to its essence. And if an analyst can do that, he or she has it all together. One can do qualitative analysis without doing diagrams but as is so often said “a picture is worth a thousand words.” Miles and Huberman (1994) are two researchers who use diagrams extensively for organizing data and illustrating conceptual relationships. They have this to say about diagrams: Conceptual frameworks are best done graphically, rather than in text. Having to get the entire framework on a single page obliges you to specify the bins that hold the discrete phenomena, to map likely relationships, to divide the variables that are conceptually or functionally distinct, and to work with all of the information at once. (p. 22)
Early diagrams are not elaborate. Like early memos, they are quite simple and hint at, rather than describe, relationships. Here are some diagrams from previous studies. Notice that they are very simple and help the researcher think about possible relationships. Complex diagrams showing multiple relationships often pertain more to theory building than description, though there can be descriptive diagrams Homogeneous Patients
Heterogeneous Patients
Easy work Difficult work
Figure 6.1
Phases of Illness Few-Many
Homogeneous/ Heterogeneous Patients: Easy/Difficult Work
Number of machines
Frequency
Few-Intermitted-Often
Early Middle Late
Figure 6.2
Illness Course: Machine-Time Dimension
Duration Short-Forever
126
Figure 6.3
Expressing
A Balancing Matrix
Life and death Carrying on
Interaction
Ward Work
Sentimental order
Personal Identity
7:24 PM
Enduring
Relieving
Illness Trajectory
8/20/2007
Inflicting
Minimizing
Preventing
Diagnosing
Pain Tasks
Consequences For
06-Corbin (Basics)-45428.qxd Page 126
06-Corbin (Basics)-45428.qxd
8/20/2007
7:24 PM
Page 127
Memos and Diagrams——127
as well. When constructing theory, even though concepts can be put together in different ways, the relationships proposed by the researcher are based on data and therefore can be said to have some grounding in the data. With continued comparison of concepts against actual data, proposed relationships become substantiated in that they continue to make sense and offer one explanation. With time, diagrams become more integrative and complex. Notice the diagrams from previous studies below. Though still relatively simple, many revisions took place in these diagrams before the authors arrived at the final versions. For other examples of the changes that take place in integrative diagrams over time, see Strauss, 1987, pp. 174–178.
Body, Biography and Trajectory
Direct
Energy, Mobility, Dizziness, other Symptoms (Parts/Systems), Sensus (Hearing, Seeing)
Indirect
Perception/sensations
Body
Total body Patient Spouse Staff Others
Self-Reflection Body parts Conceptions Body functioning level/duration
Cultural Ideological Peronal
Biographical Reviews
Trajectory projection Biographical projection
Figure 6.4
Caption to come
Biographical dimensions beauty, efficiency, visibility, instrusiveness, stigma, motherhood, sex, gender, wholeness of identity, occupation, isolated, temporary-persistent, etc.
128
Body
Figure 6.5
Caption to come
With chronicity limitations death Brought about by trajectory changes biographical changes interaction
Coming to Terms - takes place through confrontation
Biography
Takes places through letting go grieving reconstruction
From/to nonacceptance acceptance transcendence
leads to integration/reintegration proces - varies 0 to 100%
Crystallization decrystallization recrystallization
7:24 PM
Conception of Self
interpreted in present
Degrees of Conzeptualization segmented integrated?
Looping Process
8/20/2007
The BBC Chain
projection
recalls
Trajectory/Biography
reviews
Trajectory with Biography
Time
Contextualizing
Time Reflection Process
06-Corbin (Basics)-45428.qxd Page 128
06-Corbin (Basics)-45428.qxd
8/20/2007
7:24 PM
Page 129
Memos and Diagrams——129
Writing Memos and Doing Diagrams Now that we’ve had this rather lengthy discussion about memos and diagrams and their importance to the analytic process, we would like to provide some examples. The illustrations should reassure readers that there is nothing magical about writing memos or doing diagrams. The memos and diagrams presented pertain to analysis of “the pain experience.” As readers will notice, all a researcher needs to get the analytic process going is a small bit of data.
Screenshot 6
The picture shows the MAXQDA memo manager, which is accessible from the upper menu bar of the main screen (see “Memos”). It allows for having all memos of your project at a glance. Double clicking a line will open the memo itself, and–at the same time–the text to which it is attached will be opened up in the MAXQDA Text Browser window. The column “Author” shows who created the memo. In this project the author column is used to identify the memo. Each memo in this book has its ID in brackets and thus allows to easily work with the book data parallel to the data prepared in the project “JC-BasicsQR.mx3.” You may download the project on http://www.maxqda.com/ Corbin-BasicsQR or on www.sagepub.com/corbinstudysite. Each column of the memo manager can become the sort criteria for the table by just clicking on the column header. Thus, you may e.g. sort memos according to the type of memo, the title, etc.
06-Corbin (Basics)-45428.qxd
8/20/2007
7:24 PM
Page 130
130——Basics of Qualitative Research
Memo 11 Example of a Memo Showing Open Data Exploration April 4, 1997 Properties and Dimensions of the Pain Experience (Field note excerpt) The pain in my hands from arthritis is really bad in damp cold weather. I wake up with it in the morning and it lasts throughout the day. I hate to take medication because of all the possible side effects so the only time it seems to get better is at night when I am warm in bed and under the covers. (Quote from interview with subject #1, p.1 of field notes.) In my memo I write: This woman is describing her “pain experience,” that is, how she experiences pain and its relief. The description is from her perspective, reflects her experience, and not any objective measure of pain. We can see in her description that she expresses the properties of “intensity,” “location,” and “duration” of her pain. We note that “pain relief” for her comes from warmth and at night and that she is reluctant to take any medication. When she says that the pain is “really bad” at times she is giving us a dimension of the property of “pain intensity.” The “location” of the pain, she tells us, is in her hands and it is of “long” duration lasting throughout the day. “Pain relief” is possible “under conditions of warmth.” The possible use of medication is dismissed at least at this point in her “pain trajectory.” All of the properties of the pain including its management and relief are part of her “pain experience,” which of course is very individualized. (End of memo) Diagram Based on Memo Commentary on Memo and Diagram The above memo and diagram are not complicated or extensive. But they do get us started on our analysis. We have a concept, “the pain experience,” and we’ve identified some of the properties and dimensions of this particular woman’s “pain experience” (intensity, duration, location). We also have the concepts of “pain management” and “pain relief.” Now we could go back to the data to look for further descriptions of her “pain experience” either in the same interview, or we could turn to the interview with another research participant and compare the two descriptions. Or, before doing the latter, we could write additional memos off of the field note above to help us think about what we want to look for when we go back to the field to do another interview. Here we want to make a very important point. Every analyst must choose the depth of analysis he or she is reaching for and how much time he or she is willing to put into a study. We don’t want to over simplify the analytic process but neither do we want to overwhelm our readers with memo writing. We, the authors, continue to write memos off previous memos until we run out of ideas because that’s how we
06-Corbin (Basics)-45428.qxd
8/20/2007
7:24 PM
Page 131
Memos and Diagrams——131
Screenshot 7
The hierarchy of the Code System can be used to expand the dimensions of your categories. Furthermore, you may map your codes in MAXMaps, the graphics tool in MAXQDA. The connection between your data and its graphic representation in a MAXMap is vivid; that means you may open a code in MAXMaps and look at and import the coded segments as well as the memos, etc. Moreover, you may also use the mapping tool independently of your data and work with free objects to display your ideas and conceptions, like the MAXMap displayed in Figure 6.6.
work. But every analyst has his or her own approach, style, and work rhythm. In this book we want to provide information that is of to benefit experienced as well as novice researchers. We would be doing our readers a disservice if we did not provide a range of both complex and less complex memos. We leave it to our readers to select the level of complexity of analysis they are reaching for and how much time they are willing to invest in memo writing.
06-Corbin (Basics)-45428.qxd
8/20/2007
7:24 PM
Page 132
132——Basics of Qualitative Research Early Diagram on the Pain Experience
Individual Experience
Individualized
PAIN
Perception
Figure 6.6
Management
Relief
Caption to come
After writing the above memo, we continued with our analysis, writing another memo bouncing off of the first.
Memo 2 Example of a Memo That Identifies/Develops the Properties and Dimensions of Concepts/Categories April 4, 1997 The Pain Experience Taking off from the above memo we can hypothesize that pain can vary dimensionally in “intensity” from “severe to mild,” that it can be “located” anywhere in the body and in more than one place at the same time, and that it can “last”
06-Corbin (Basics)-45428.qxd
8/20/2007
7:24 PM
Page 133
Memos and Diagrams——133 (duration) a short or long time that is be continuous, intermittent, and temporary over the course of time. This gives me a range of dimensions, all of which enter into the “pain experience.” Also with this type of pain and for some persons, it is possible to “obtain relief” under certain conditions, so that “pain relief” can vary from “possible” to “impossible,” be “temporary” or “permanent” depending upon the person, the type or cause of pain, and a person’s response to it. To make it more complicated, it seems that “perception” of pain or the “pain experience” can vary depending upon many factors or conditions such as “location” of pain in the body—some areas being more sensitive than others, “degree of activity” one engages in, “time of day,” and even “odd things” like weather. Finally there is the property of “duration” of the pain. Duration can vary dimensionally as “continuous,” “intermittent,” or “temporary.” In the above case, one might say that the pain is “intermittent.” But how do all the various dimensions or variations along the properties of pain enter into the “pain experience”? Also, I have another question: what is the meaning of pain to this person? Hmm. The “subjective experience” of pain incorporates many factors and it is up to me to tease all of these out of the data. Other factors that might influence the pain experience but that are not brought out in this particular field note are “pain history” and both present and previous experiences with “pain relief,” and also if one believes that relief is possible in the future. Oh my! Pain relief and treatment are big areas that I’ve not yet explored but will have to before this study is over. As I continue to collect data and analyze the interviews I’ll be looking for data about these areas. (End of memo.) Diagram Based on Memo Commentary on Memo and Diagram In this memo and diagram we are laying out possible dimensions of pain and how they relate to the “pain experience.” Notice that memos and the diagram reflect a systematic thinking about the topic and that both come from the actual data. The analyst is using the data to stimulate thinking. Another point about memos is that they force the analyst to ask questions of the data and the questions direct theoretical sampling as indicated in the memo. When the analyst returns to collecting data he or she will be increasingly sensitive to those areas brought out in the analysis, listening carefully to how persons describe their pain experience including the pain history, experiences with pain relief, and treatment. These ideas need further exploration through data collection. Here is another memo and diagram written off the same field notes. This memo and diagram are more speculative than previous memos that came out of the data and are meant to give direction for theoretical sampling and to help the analyst break out of the analytic ruts that block thinking. The ideas that an analyst comes up in a brainstorming memo or diagram are not incorporated into the study.
134
Figure 6.7
Duration
+ .... −
Intensity
+ .... −
Pain Perception
** *
Location
leads to
Possible Yes/No
Permanent Yes/No
Pain relief
Brings about
Managements Strategies
7:24 PM
Caption to come
affects
8/20/2007
Degree of activity Time of day Location in Body & Sensitivity Weather Fatigue Cause (cancer; childbirth. . .)
Conditions
Pain Experience
Further Development of the Pain Experience
06-Corbin (Basics)-45428.qxd Page 134
06-Corbin (Basics)-45428.qxd
8/20/2007
7:24 PM
Page 135
Memos and Diagrams——135
Memo 3 Example of a Comparison and Question Asking Memo April 4, 1997 Brainstorming Memo About “The Pain Experience” and its Properties and Dimensions Working from my personal experience, professional training, and the literature, I know that arthritis is certainly not the only cause of pain. One can also have pain from an injury, say a pulled muscle or a mild burn. Pain then can vary in “type” from “burning” to “sharp,” “dull,” and even “throbbing.” It can be described as “horrible,” “overwhelming,” “disruptive” or just an “irritant.” Pain is “perceptual.” That means that if there happened to be an objective way to measure pain, two persons said to have the same objective pain would experience that pain differently because of who they are and what they bring with them to the pain experience. Some persons after surgery need lots of medication. Other persons need less. It’s because each person has a different “pain threshold” and different “reactions” to pain. Another point, the “pain experience” has a “trajectory” or course. The experience of pain does not begin with this pain but reaches back into the past, has a present, and enters into the next pain experience. Also this particular pain experience can vary being more or less intense over time. Thus, I now have some ideas for theoretical sampling such as looking for situations of temporary vs. chronic pain, intense pain versus more mild pain, and a pain history that includes relief from pain vs. a history unsatisfactory pain management. As I think about it, the pain experience is influenced by a combination of many factors such as intensity, duration, and whether or not it can be relieved partially, entirely, for good, or temporarily, as well as history. I recall a woman who had post-herpetic pain that never went away. She eventually died not from the pain per se but probably because she was worn down by it. Her history of looking for relief was a long one. In the end she just had to learn to live with the pain and decided that fighting it every day just was no longer feasible, getting at the meaning of pain and implications for daily life or biography. I can see that I have a lot of work to do to discover the relationships between pain and its properties, pain relief, and the pain experience. I also have a few questions that I would like to ask when I do that sampling. I should look at individuals with “chronic pain.” It is the property of chronicity that is driving me to collect data on persons, such as those with rheumatoid arthritics, herpetic pain, sickle cell anemia, and cancer. I should also look at those with “temporary” pain. Here it is the property of pain being “temporary” that is driving the data collection. I should go to persons with pain related to childbirth, surgery, or an injury to find temporary pain. Burns and amputations are both interesting areas because the pain may be “temporary” or “chronic” depending upon complications. Still another question is, what are the various patterns of the pain experience? Are there various patterns of experiencing pain that cross cut these various properties? How is the meaning of pain derived? Does whether or not pain is expected
136
Figure 6.8
+ ... −
Caption to come
I .... s
Duration Varies
Pain trajectory
Options
Willingness to use
Available
Searching for relief
Expectations about relief
Elusive
No
Impact
Suffering
Biographical
Depression
Anger
Pain relief
Temp - Permanent
Yes
7:24 PM
Intensity
Weather
Total - Partial
8/20/2007
Type
Fatigue
Conditions
Time of day
Cause
Activity
Pain Experience
Integrative Diagram for Pain Experience
06-Corbin (Basics)-45428.qxd Page 136
06-Corbin (Basics)-45428.qxd
8/20/2007
7:24 PM
Page 137
Memos and Diagrams——137 or not expected make a difference? Does the ability or probability to obtain relief make a difference? I mean, if one expects or believes that relief will come with treatment vs. the belief that there will be no relief despite treatment, does this make a difference in the experience? If pain is expected, what are the steps that are taken to prevent or lessen it? How do persons control their lives or activities to minimize pain? How do factors such as culture, age, gender, how long the pain has been going on, intensity, and efforts at relief affect the pain experience? (End of memo.) Diagram Based on Memo Commentary on Memo and Diagram The long memo above and the diagram are not complete, but they do demonstrate how a researcher thinks comparatively “chronic” and “temporary” to extend her or his thinking about properties and dimensions before going back into the field. The idea is to collect data on these two extremes then compare that data to see how properties and dimensions vary. Understanding a phenomenon like the “pain experience” which is very complex and personal in nature takes a lot of thought and data collection from a variety of areas. In the above memo and diagram the reader can also see how categories and subcategories become linked around a phenomenon such as the “pain experience” as he or she works with the data. But before anything hypothesized about in a memo or diagram is built into findings the researcher needs to collect data and make the necessary comparisons.
Memo 4 Example of a Memo that Elaborates the Paradigm: The Relationships Between Conditions, Actions/Interactions, and Consequences June 18, 1998 A More Advanced Memo on the Pain Experience After months of collecting data and immersing myself in the pain stories of others, what is the overall pain story to be told? I think the story is somewhat as follows. Pain is a difficult experience unless the pain is “very mild” and of very “short duration.” Every time I did an interview, I could feel the “intensity” of “suffering” of people who were experiencing “severe pain,” as they spoke about their experience. These people are driven to find “relief” but relief is often “elusive” (dimension of the ability to relieve of pain which can vary from relief being “obtainable” to being “elusive”). The search for relief often takes them down dead end paths with emotions ranging from “anger” to “depression” for many reasons (property of emotional response to pain). Not the least of which the “lack of control” over their lives and the “suffering” that they “endure.” Though there are many “treatment
06-Corbin (Basics)-45428.qxd
8/20/2007
7:24 PM
Page 138
138——Basics of Qualitative Research options” out there, finding one that works is not easy. There are a lot of “trial and error strategies” involved. It seems to me that “pain tolerance,” which is an interesting concept, diminishes when the pain is of “long duration” and people are “fatigued” or worn down by its “constancy.” “Searching for relief” can be compared to being lost in a dark forest at night, as one is trying to find a way through, an escape, but the escape path is blocked and difficult to locate in the dark. People sometime become “desperate” wondering if the suffering will ever end and sometimes wishing for death as an “escape” from their pain. Pain can “take over” a life. Sometimes life “revolves” around periods of pain and relief. “Every day life” is a very important concept here because of the potential impact of pain on every day life. Every day life has the potential to be disrupted “very little” or “greatly.” People seek relief not only to “get away” from the suffering but also so that they can “get on” with their lives. Pain is such a personal experience that it is difficult to explain and acute temporary pain is very different from chronic severe pain. I do see some patterns emerging. There are those persons who experience “acute temporary pain.” Their pain experience may have been intense but for the moment that intensity is forgotten when the situation has passed. Their pain experience is defined by how the pain was handled and the treatments made available for controlling it. Some persons within this group describe the pain experience as horrible, or poorly managed. Others describe it as not so bad. Whatever the pain experience, it becomes incorporated into a persons “pain history” coming back into play in future episodes of pain whether acute or chronic. There are those who suffer from “chronic pain.” They have developed management strategies for controlling its intensity and impact on daily life. They often describe their pain as bearable though they would rather be without it and continue to search for a cure. Their pain experience is modulated by the support and recognition that they receive from others and the hope that the situation is temporary. There are still avenues open to them. Then there is the group in which “every day” is a “pain experience,” the “constant pain sufferers.” Suffering defines their lives. Every day activities are severely limited. Depression is moderate to severe, as one would expect. There is little hope that the situation will improve. Their stories are touching. Diagram Based on Memo
Memo 5 Example of Memo Developing the Storyline June 20, 1998 Exploring Storyline Options I ask myself, what is the main concept or storyline that integrates these various groups? I am left perplexed. I know there is “Searching for Relief,” but that
06-Corbin (Basics)-45428.qxd
8/20/2007
7:24 PM
Page 139
Memos and Diagrams——139 seems such a logical and common explanation. It is a process that goes on but doesn’t explain or do justice to these varied experiences. There has to be an even better explanation. Hmm! I want to focus on the pain experience itself, what it is like to have pain, to suffer whether that pain is temporary or permanent. I keep coming back to the imagery of a forest at night and the darkness, which so reminds me of living with pain, being in darkness that is suffering both physically and often psychologically, the fear, the stumbling, the fatigue, and the discouragement. There is “Wandering in the Darkness of Pain,” or “Pain, A Story of Suffering” but neither of these ideas seem to quite capture it. I can’t yet put the feeling into words. I’ll have to keep thinking about the problem and hopefully the right conceptualization will emerge. Commentary on Memo As the reader can see, memos do wander as the analyst tries to think things out. And sometimes the analyst isn’t ready to do an integrative diagram on the major theme because he or she hasn’t arrived at an overarching scheme yet. Memos express the analyst’s own emotions and frustrations at having an inner sense of what is going on but being unable to articulate it at this time. And the inability to complete a diagram tells the analyst that he or she still has more thinking to do. Writing memos and doing diagrams force the analyst to keep searching for the “right” conceptualization. That is why memos and diagrams are such powerful analytic tools. Notice how the memos and diagrams later memos in this chapter demonstrate expanded thinking about the pain experience in comparison to the ones developed earlier in the study. Sorting of Memos The image that comes to our mind when we think about sorting memos is of an inexperienced researcher standing with stacks of memos in his or her hands; then, dropping them one by one on the floor, letting them fall where they will. The piles that result represent a fortuitous sorting of the concepts. There are times when we all feel this way, especially when we are inundated with conceptual ideas but can’t quite understand how they come together. Yet those of us with experience know that the research does eventually come together. After months of gathering data, studying the data, writing memos, and doing diagrams there is that inner sense, or “gut feeling” of what this data is all about. It’s difficult to explain but the story of our participants becomes part of us. It’s not that we have a chronic illness, or are drug addicts, gamblers, or new mothers. Rather it is that we’ve listened to their words, observed their actions, felt their emotions, taken on their burdens, and so understand what it is like for them. The final story may not be easy to synthesize into just a few words but it’s there in our minds. From our general reading of the memos we can write a descriptive story. Then using the categories/themes we’ve developed over time, we can translate our descriptive story into an analytic one. Yes, the story or theory (should theory be our aim) is a construction, but a construction grounded in data.
06-Corbin (Basics)-45428.qxd
8/20/2007
7:24 PM
Page 140
140——Basics of Qualitative Research With construction of a storyline the researcher can try out the scheme on research subjects, colleagues, committee members, friends, spouses, and companions. The final grouping of memos into specific topics as well as a whole enables researchers to write on each topic in detail as well as to present an integrated story/theory.
Summary of Important Points When analysts sit down to analyze those first field notes, they often feel overwhelmed by the task in front of them. It is difficult for novices to know where to start, what to look for, or how to recognize “it” when they see it. The words on a page may appear as an undifferentiated mass with little or no meaning other than what is most obvious. It happens to all of us so do not be concerned if it happens to you. The idea is just to take that first piece of data and sit down and write a memo about it. Don’t be concerned about how those first memos or diagrams look. It is not unusual for this early confusion and uncertainty to be reflected in memos and diagrams. Just remember that whatever a researcher writes in a memo or puts into an early diagram is less important than getting started with the analysis. Early analysis is about gaining insight and generating initial concepts. In order to make sense out of data one must first “chew” on it, “digest” it and “feel” it. The researcher has to take the role of the other and try to understand the world from the perspective of participants. This can be done in memos. Memos and diagrams are essential aspects of analysis whether the research aim is description or theory. As explained, memos and diagrams are more than just repositories of codes. They stimulate and document the analytic thought processes and provide direction for theoretical sampling. Furthermore, without memos and diagrams there is no accurate way of keeping track of the cumulative and complex ideas that evolve as the research progresses. Diagrams are visual representations of the relationships between concepts. The purpose of diagrams is to facilitate, not hinder, the analytic process. They too evolve and become more complex as the research progresses. Some persons are more adept at doing diagrams than other persons. There is no need for concern if one has difficulty doing diagrams. Some persons are just not visual. As a final note, there are no rules governing the writing of memos or the doing of diagrams. Each analyst develops his or her own style that carries him or her through the research process. Both memos and diagrams are useful later, when writing for publication and giving talks about the research.
06-Corbin (Basics)-45428.qxd
8/20/2007
7:24 PM
Page 141
Memos and Diagrams——141
Activities for Thinking, Writing, and Group Discussion 1. Turn ahead to the field notes located in Appendix I. Now begin to analyze the data putting your thoughts down in memos. Try to write different kinds of memos using the memos provided in this chapter as patterns. Naturally, with this limited data, you’ll not be able to write an integrative memo but you should be able to write a couple of memos about concepts you’ve identified and about some of the properties and dimensions of those concepts. 2. Make a couple of diagrams reflecting your analysis to this point. 3. Now bring your memos and diagrams to the group meeting and discuss them with the other group members. 4. Each group member can present a memo for discussion. 5. Based on the group discussion, write a group memo summarizing all of the ideas. 6. Do a group diagram putting all of your thoughts together.
Note 1. The identification code in brackets after each memo allows the user to easily find the memo in the prepared MAXQDA project which you find on: http://www .maxqda.com/Corbin-BasicsQR or on www.sagepub.com/corbinstudysite. See also screenshot 6.