Arch Public Health 2010, 68, 1-13
Melanoma incidence trends in Limburg after screening and prevention campaigns by
Vanstraelen D1†, Deleu H2, Van Robays J2, Dhollander D3,4, Cloes E3,5, Lousberg D3,6, Kuipers G7, Adriaens B7, Mebis J1, Mathei C3,6, Buntinx F3,6
Abstract Background Malignant melanoma is a skin cancer of which the incidence is said to be raising in recent years. Prevention may result in decrease of the incidence. Early detection may result in the detection of earlier stages of the disease. In Limburg a combined campaign of prevention and screening has been performed in recent years and its effects should be evaluated. Objectives To study time trends of malignant melanoma incidence and the evolution of stages of detected melanomas and to relate them to interventions in previous years. Methods An ongoing multi-faceted intervention, including information as well as screening invitations (Euromelanoma project) was implemented in 1999. Time trends of malignant melanoma were studied on the basis of data from the Limburg Cancer Registry (LIKAR) of 1996-2005. Stages were studied on the basis of an additional clinical registration completed by pathologists and dermatologists. Results Over the years 1996-2005, the crude incidence rate of malignant melanoma was 6.8/100,000 patient-years in males and 11.6 in females, with a European standardized incidence rate (ESR) of 6.4 in males and 10.5 in females. The incidence progressively increased with age.
†
Dr D. Vanstraelen has passed away after submission of this manuscript, but before it could be published.
1
Limburg Oncological Centre, Virga Jesse Ziekenhuis, Hasselt, Belgium
2
Ziekenhuis Oost Limburg, Genk, Belgium
3
Limburgse Kankersamenwerking (LIKAS), Hasselt, Belgium
4
Christelijke Mutualiteit Hasselt
5
Expertisecentrum Digitale Media (EDM), University of Hasselt, Hasselt, Belgium
6
Catholic University of Leuven, Department of General Practice, Clinical Epidemiology Unit, Leuven, Belgium
7
Province of Limburg, Department of Health, Hasselt, Belgium Correspondence:
[email protected]
2
Vanstraelen D, Deleu H, Van Robays J, Dhollander D, Cloes E, Lousberg D, et al.
In males, the ESR initially decreased, followed by a significant increase from 3.0 in 1998 to 7.6 in 2005. On average this is a yearly increase of 0.5 per 100,000 persons (p= 0.04). In females the curve fluctuates, resulting in almost similar rates in 1996 and 2004 (p=0.85), but with a sudden increase from 9.2 to 15.8 between 2004 and 2005. Neither the Breslow nor the Clarck classification showed any significant change over the registration period. The proportion of lymph node invasion, metastasis and ulcerations did not change. Discussion With the exception of a small and clinically irrelevant increase in ESR in males, no changes over time were detected in incidence or stage distribution. The effect of the intervention seems limited. Keywords Melanoma, screening, incidence trends Introduction Malignant melanoma is a relatively rare malignancy of the skin that seems to become more frequent over the years (1). The main cause is considered to be skin burn in sensitive people, especially in children (2), although most cancers will be detected above age 25 in females and age 35 in males (3). In far too many cases, melanomas are diagnosed in advanced stages and prognosis has been bad although it recently improved after the introduction of resection policies including a very broad zone of normal tissue. Starting in 1999, the provincial health authorities of the Belgian province of Limburg, together with regional health care workers and the funding organization TOKAP, adopted a comprehensive approach towards the population in order to prevent and detect melanomas early. The approach included sun protection information campaigns aimed at the population at large as well as at elective target groups, and yearly invitations for screening, within the framework of the Euromelanoma day. Information campaigns can only be expected to show results after decennia, unless the campaign also includes guidelines for self-examination of the skin and screening by physicians, which is the case here. Yearly screening of the total population, including self-examination of the skin can be expected to result in a higher incidence during a period of two years (first round effect), followed by a gradual decrease towards the original level. As a total population screening is unrealistic, the initial increase will be spread over a much longer period, maybe ten years or more and the incidence peak will be much lower and therefore difficult to detect. Even in this case, however, it can be expected that melanomas will be detected earlier, resulting in the detection of tumours of an earlier stage.
Screening and melanoma incidence trends
3
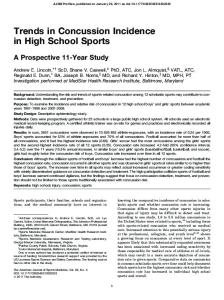
After ten years of campaigning, we used data of the Limburg Cancer Registry (LIKAR) (3) as well as a more detailed additional registration of melanomas to evaluate the time trend of both the incidence and the distribution of the stages over the years and tried to relate this to the screening and prevention campaigns. Methods Design We used a time trend analysis, comparing yearly incidence figures and tumour stages of melanomas diagnosed between 1996 and 2005. Population Our data relate to the population of the Belgian province of Limburg, situated in the northeast of Belgium. The territory covers 2422 km² or 7.9 % of the Belgian territory. On 1 January 2001 the population totalled 791,178, of which 395,579 men and 395,599 women. The degree of urbanisation is restricted: of the two largest cities Hasselt (n= 68,058 on 01/01/2001) and Genk (n= 62,842 on 01/01/2001) constitute 17% of the total population. Both are situated in the area of Central Limburg. Forty-four percent of the population lives in 32 municipalities with 20,000 inhabitants or less, and 39% in 10 municipalities with 20,000 to 40,000 inhabitants (Figure1). Figure 1: The distribution of the population
4
Vanstraelen D, Deleu H, Van Robays J, Dhollander D, Cloes E, Lousberg D, et al.
Interventions The intervention was designed and operationalised by a multidisciplinary group including physicians, funders, and policy makers. It was progressively built up over the last ten years, and included a number of methods (to be divided into patient information/primary prevention) and screening (and target groups):
The campaign called ‘Be sensible in the sun’ concentrated on taking appropriate precautions to prevent the emergence of malignant melanomas. It included the production and distribution of leaflets, brochures, a sundial (recently also available on the website), posters, postcards, sunscreen lotion labels, a sunscreen to be placed behind the windscreens of cars and lectures in different municipalities targeted at the general population.
Additional posters, postcards, leaflets, and a competition were addressed at camp leaders, youth clubs, after-school childcare programmes, playground activities, sports clubs and event visitors. A question and answer game was used for class five primary school children as a waiting room activity during the school medical check-up.
An inspirational folder was sent to local authorities and a life-size sun dial was made available to stimulate them to add their own activities to the common action of the province.
Adapted promotional materials were distributed through well-baby clinics.
A training course and a CD-ROM were developed for GPs.
Similar to elsewhere in Europe, from 1999 onwards, in Limburg the ‘Melanoma Monday’ was organised yearly in the first half of May, as a method to encourage the population and especially sensitive people to present themselves for a skin examination by a dermatologist free of charge (4). More than half of the Belgian dermatologists collaborate on the initiative. The yearly number of participating patients is between 4000 and 5000, without any specific trend. The number and percentage of positive cases have descended from 25 (0.9%) in 1999 to 8 (0.2%) in 2003.
Data collection Incidence rates were calculated from the LIKAR registry, which at the time of writing covers the years 1996-2005. The registry includes all cancers in inhabitants of the province of Limburg, which have been histologically or cytologically confirmed. A detailed description of its methods and procedures has been published elsewhere (3). More detailed information on each tumour was directly recorded from the pathologist and the referring clinician, in general the dermatologist. Until the year 2001, cases were retrieved from LIKAR, and both the pathologist and the clinician were asked to provide the additional information; from 2002 until 2005 data were prospectively identified by the pathologist. As a result these data are available until the year 2005.
Screening and melanoma incidence trends
5
For each diagnosis of a malignant melanoma, the pathologist completed a form recording APO thickness, presence of tumour cells at the section margins, presence of ulceration, presence of micro metastasis and pathological TNM (pTNM) classification. The form was sent to the clinician, who was asked to add the location of the primary tumour, the Clark and Breslow stage, the AJCC and TNM classification and the presence of any known metastasis (5). All the involved physicians were informed about the goals of the project and the procedure to be followed via the loco-regional quality evaluation groups (LOK). Each Belgian clinician has to be a member of one of these groups in order to keep their certification. The anonymity of each physician’s data towards the group was guaranteed. The whole project was validated by the ethical review board of the Belgian work against cancer. Outcome measures The TNM classification of malignant melanoma is presented in table 1, and incorporates three main prognostic features: tumour thickness (Breslow), anatomical Clark levels and the absence or presence of ulceration (5). Table 1: TNM classification of malignant melanoma T Classification pTis melanoma in situ (Clark level I)/severe melanocytic dysplasia pT1: -1.0 mm a: without ulceration b: with ulceration or level IV or V pT2: 1.01–2.0 mm a: without ulceration b: with ulceration pT3: 2.01–4.0 mm a: without ulceration b: with ulceration pT4: >4.0 mm a: without ulceration b: with ulceration N Classification pN0: pN1: pN2:
pN3:
no regional lymph node metastasis 1 lymph node a: micrometastasis b: macrometastasis 2-3 lymph nodes a: micrometastasis b: macrometastasis c: in-transit metastasis/satellite(s) without metastatic lymph nodes 4 or > metastatic lymph nodes, matted lymph nodes, or combinations of in-transit met(s)/satellite(s) and metastatic lymph node(s)
M Classification M1: Distant skin, subcutaneous, or metastasis beyond the regional lymph nodes M2: Lung metastasis M3: All other visceral or any distant metastasis
6
Vanstraelen D, Deleu H, Van Robays J, Dhollander D, Cloes E, Lousberg D, et al.
The Breslow index is the tumour maximum vertical diameter from the top of the granular layer or ulcerated tumour surface to the deepest point of invasion. It is measured in millimeters. The Anatomical Clark level is categorised from I to V and subsequently includes the epithelium only (I), the papillary dermis (II), the papillary-reticular interface (III), the reticular dermis (IV), and the subcutaneous fat (V). Ulceration (particularly if >3mm) is an independent adverse prognostic factor, with a ten-year survival of around 50% in case of ulceration versus 78% if non-ulcerated. Presence of tumour cells at the section margin or ulceration as seen during histological examination and known metastasis were recorded as either present or absent. Analysis For comparison, melanoma incidence rates have been stratified by gender and standardised for age according to the European standard population (ESR per 100,000 person-years). ESR values for males and females separately were linked to the year by simple linear regression analysis. Tumour thickness and classifications were linked to the year by Kruskall-Wallis analysis (categorical dependent variable) or linear regression analysis (continuous dependent variable) and by chi² testing or Kruskall-Wallis after categorisation of the years into three classes (1996-1999, 2000-2002, 2003-2005) (Table 2). Table 2: Depth and stage of the tumours according to three time periods Classification
class
Breslow (mm)
Clarck
pN
pM
1996-1999
2000-2002
2003-2005
total
3
21
30
21
72
1
12
19
11
42
2
36
41
36
113
3
67
42
54
163
4
48
58
38
144
5
11
11
9
31
PN0
158
145
165
468
PN1
4
3
8
15
PN2
1
0
0
1
PN3
0
2
1
3
14
4
7
25
PM0 PM1
Screening and melanoma incidence trends
7
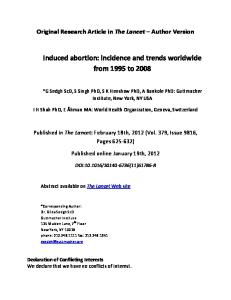
Results Incidence rates Over a period of ten years, LIKAR recorded 735 malignant melanomas, 271 in males and 464 in females. This results in an overall crude incidence rate of 6.8/100,000 patient-years in males and 11.6 in females or an ESR of 6.4 in males and 10.5 in females. The incidence progressively increases with age (Figure 2). Figure 2: Incidence of malignant melanoma according to age and sex (LIKAR 1996-2005) 30
25
♀
20
15
10
♂ 5
0 0-4y
5-9y
10-14y 15-19y 20-24y 25-29y 30-34y 35-39y 40-44y 45-49y 50-54y 55-59y 60-64y 65-69y 70-74y 75-79y 80-84y
85+
Figure 3: Time trend of the incidence (ESR/100,000 patient-years) of malignant melanoma in inhabitants of the Belgian province of Limburg (LIKAR 1996-2005) 18,0 16,0 14,0 12,0
ESR
10,0 8,0 6,0 4,0 2,0 0,0 1996
1997
1998
1999
2000
2001 year
males
females
2002
2003
2004
2005
8
Vanstraelen D, Deleu H, Van Robays J, Dhollander D, Cloes E, Lousberg D, et al.
In males, the ESR initially decreased, followed by a steady and statistically significant increase from 3.0 in 1998 to 7.6 in 2005. On average this is a yearly increase with 0.5 per 100,000 persons (p= 0.04). The proportion of the variance in incidence explained by time is 55%. In females the curve fluctuates, resulting in almost similar rates in 1996 and 2004 (p=0.85), but with a sudden increase from 9.2 to 15.8 between 2004 and 2005 (Figure 3). Clinical registration Some detailed information was available for 601 patients. At least one measure of staging was available for 509 patients. There were 219 males and 362 females (gender missing in 20 cases). Their mean age was 55 years (range 18-92). Mean age and sex ratio were stable over the three time periods that were analysed. There were 339 patients (56%) with a reported diagnosis of superficial spreading of malignant melanoma, 96 (16%) with a nodular melanoma, 51 (9%) with a lentiginous melanoma, and 43 (7%) with an in situ malignant melanoma. All other types counted less than 3% each. There was no increasing or decreasing trend in the relative occurrence of the most frequent types over the three time periods. Staging Depth of the lesion according to Breslow was available for 509 patients. Overall the depth was less than 0.5mm, between 0.5 and 3mm and more than 3mm in 149 (29%), 293 (57%) and 73 (14%) cases, respectively. There was no relation between the depth and year of diagnosis (p=0.40), nor between depth and the three time periods (chi² p=0.23) (Figure 4). Figure 4: Depth of the lesion according to Breslow over the years Breslow_3_cat=