DE-93-18-1
MEASURING AND CALCULATING LABORATORY EXHAUST DIVERSITY— THREE CASE STUDIES D.T. Hitchings, P.E., CIH
R.S. Shull, P.E., CIH
Member ASHRAE
Associate Member ASHRAE
ABSTRACT Diversity in laboratory exhaust systems can theoretically be used to downsize equipment and reduce capital and operating costs. This paper provides a method for analyzing and reporting laboratory diversity data and applies this method to three facilities. Results indicate that substantial diversity exists in real operating facilities provided that three key motivators are effectively in place. These motivators are (1) facility design and function, (2) training, and (3) monitoring and enforcement. It is suggested that the fume -hood -to -personnel ratio may predict the facility diversity provided that these motivators exist. Because of the small sample size reported here, more research is indicated to determine the accuracy of this ratio in predicting laboratory exhaust diversity. INTRODUCTION The variable-air-volume (VAV) approach to laboratory ventilation is becoming more popular throughout the world today. The improvements in laboratory fume hood face velocity controls and laboratory pressurization controls made in recent years have allowed VAV laboratory designs to become a viable and attractive alternative to the constant-volume-only systems. Fume hood face velocity controls can make the fume hood safer for the user if properly applied. Significant reductions in energy consumption and operating costs have been realized by owners of VAV facilities. But the reduction in capital costs made possible by taking advantage of fume hood diversity in a VAV laboratory facility is still not taken advantage of by most laboratory designers. The idea of exhaust system diversity has been acknowledged by most as theoretically sound, but it is frequently ignored when the heating, cooling, and air moving capacities of these systems are calculated. Engineers who design laboratory facilities tend to be extremely conservative when sizing the mechanical systems for
laboratories. This is due, in part, to the lack of published diversity data and track records for these systems (fear of the unknown) and the conservative, careful attitudes prevalent in the field. This paper attempts to fill a portion of the void in actual published laboratory airflow diversity data. Laboratory facility environmental control systems and their dynamics are complex. Measuring how they are operating can also be complex. Because of this complexity, standardized methods of analysis have not been established. This paper also seeks to establish a framework for reporting observed diversity data. This framework is summarized as follows: ●
Define diversity and other key variables.
●
Describe the lab design and control philosophy.
●
Describe data collection methods and accuracy.
●
Report observed and calculated performance data.
●
Discuss site-specific criteria that affect system use.
●
Report conclusions.
●
Discuss applications of these findings to other facilities, existing and proposed.
DEFINITIONS Total installed exhaust capacity: The sum of the maximum operational fume hood and specific exhaust flow rates for all sources in the facility is the total installed exhaust capacity. This should not be confused with the installed exhaust system capacity, which may be greater or less than this sum. For fume hoods with sash stops, the maximum operating flow rate is determined when the sash is open to the stop. For fume hoods without sash stops, the maximum operating flow rate is determined with the sash fully open. For specific exhaust sources, the maximum operating flow rate is determined when the damper is fully open. The volume flow rate for all fume hoods is based on the normal operating face velocity for the facility in
Dale T. Hitchings is president of Hitchings Associates, P.C., Midland, MI; Richard S. Shull is a manufacturing specialist at the Dow Corning Corp., Midland, MI. ASHRAE Transactions: Symposia
1059
which they are used. In the three cases cited in this paper the face velocity is 100 fpm (0.51 m/s) Diversity: The observed volume flow rate measurement expressed as a percentage of total installed exhaust capacity is the diversity.
Ideal Mean Diversity = {(Mean Adjusted Diversity) × (% of occupied hours) + (Minimum Possible Operating Diversity)
(2)
× (% of unoccupied hours)}
Diversity =
Actual Volume Flowrate Total Installed Exhaust Capacity
Example:
(1)
× 100%
Diversity data set: The complete set of diversity calculations for all observations in the reporting period is called the diversity data set. The diversity data set is used to determine the mean observed diversity; see Figures 3, 5, and 7 for examples of the diversity data sets in graphical form. Adjusted diversity data set: The original diversity data set that has been reduced by removing data from unoccupied time periods is called the adjusted diversity data set. Adjusted diversity data sets were used to determine the upper control limits (99% design diversity) for these systems. The effect of removing data from unoccupied time periods makes the analysis more conservative and tends to raise the 99% design diversity (see Table 2). Minimum observed diversity: The lowest diversity observed during the data collection period is the minimum observed diversity. Minimum possible operating diversity: The diversity that occurs when all the fume hoods are closed and the specific exhausts are at their minimum is the minimum possible operating diversity. Mean observed diversity: The mean of all observations in the diversity data set is the mean observed diversity. Mean adjusted diversity: The mean of all observations in the adjusted diversity data set, or, the mean diversity during occupied time periods is the mean adjusted diversity. Ideal mean diversity: The mean of a hypothetical data set consisting of the adjusted diversity data set (values during occupied periods) and all other data points (values during un-occupied periods) set to the minimum possible operating diversity. In other words, the ideal mean diversity is the mean diversity of the facility if normal usage occurred during occupied periods and if all the fume hoods were closed during unoccupied periods.
In facility no. 1, the mean adjusted diversity is 38%. The facility is occupied for 8 hours a day, five days a week, for a total of 40 hours. This is 24% of the 168-hour week. The minimum possible operating diversity is 31%. The unoccupied period is the remaining 76% of the week. Ideal Mean Diversity = (0.38)(0.24) + (0.31)(0.76) = 0.327 or 33%. Maximum observed diversity: The highest diversity observed during the data collection period is the maximum observed diversity. 99% design diversity: The diversity of the system that was exceeded by only 1% of the observations in the adjusted diversity data set. This number can also be interpreted as the upper control limit for a process with a 1% rejection rate. The classical statistical quality control methods of determining upper control limits assume normal distribution of the data. However, the laboratory exhaust diversity data collected were not normally distributed. In a non-normal distribution, the variance or standard deviation of the sample does not describe the distribution adequately enough to allow mathematical calculation of the control limit. To allow for non-normal distributions, the method used in this paper to determine the upper control limit was to record each observation in bins of 1% diversity increments and generate a frequency distribution. These frequencies are then summed to produce cumulative percentages for each bin. The diversity at which the cumulative percentage reaches 99% is the 99% design diversity. See Figures 4, 6, and 8 for examples of these histograms. This approach is only valid with large numbers of observations, as was the case with all three facilities described in this paper. CASE STUDY: FACILITY NO. 1 Facility Size & Use Facility no. 1 is an addition to a larger laboratory building. The addition has a net laboratory area of
1060
ASHRAE Transactions: Symposia
approximately 6400 ft2 (594 m2). There are four separate laboratories in this addition. This facility is an industrial research laboratory of a large chemical company. Wet chemistry is done in two of the four laboratories and dry sample preparation and dry dispensing are done in the other two labs. Thirteen laboratory personnel were using the facility during the data-collection period. Part-time personnel were added to the total as a percentage of their time worked.
to a central room pressurization control panel. Each laboratory has a general exhaust valve which is connected to the exhaust manifold and is actuated by the room pressurization control panel, which receives input from the room thermostat and a volume feedback from the general exhaust valve. The exhaust system static pressure is controlled at a constant 1.5 in. w.g. (374 Pa) by varying the exhaust fan speed. This facility uses 100% outside air, once-through, with no recirculation.
Hood Number, Type, and Capacity
Data Collection Methods and Accuracy
There are a total of 16 laboratory fume hoods in these four labs. There are two 4-ft (1.2 m) benchtop hoods, four 5-ft (1.5 m) benchtop hoods, six 6-ft (1.8 m) benchtop hoods, two 8-ft (2.4 m) walk-in hoods, and two 6-ft (1.8 m) distillation hoods. The fume hoods were all manufactured with bypasses in them the owner opted not to close up. Assuming a constant face velocity, this requires larger minimum exhaust flow rates than if these bypasses had been closed. The total installed exhaust capacity is 23,620 cfm (11,139 L/s). This includes approximately 200 cfm (94 L/s) of flammable storage cabinet ventilation and specific exhaust. The fume hoods in this facility operate with an average face velocity of 100 fpm (0.51 m/s).
A 0- to 10-volt analog output signal was connected from the room pressurization control panel of each of the four laboratories to a strip chart recorder for approximately one month. Data points from the strip chart, in 30 minute intervals, were input manually into a spreadsheet for later analysis. These voltages were converted to flow rates by using the following procedure. All the fume hoods were opened and the maximum possible flow rate was recorded from the pressurization control panel digital readout, and the corresponding voltage was recorded at that time. The same procedure was done with all the fume hoods closed to determine the minimum possible flow rate. These two points were then used to calculate slope and intercept figures. Each data point was converted from volts to cfm by multiplying by the slope of the calibration curve (cfm/volt) and then adding the intercept (cfm) to compensate for zero offset. The accuracy of this data collection method is limited to the accuracy of the flow feedback from each of the venturi air valves, which is claimed by the manufacturer to be ± 5% of reading.
Description of Laboratory Exhaust System and Controls Each laboratory has one exhaust fan and a common exhaust manifold. The fume hoods are equipped with sash-position-sensing type face velocity controllers with monitors and venturi air volume control valves. Each of the face velocity controllers is wired
ASHRAE Transactions: Symposia
1061
99% design f igure operates at
Observed Performance Data and Analysis Facility No. 1
means
that this
system
The first two figures in this paper show the raw data collected in order to provide perspective for the remaining normalized figures. Figure 1 shows the flow rate from a single laboratory for one week. Note the random, elevated activity between 8:00 a.m. and 5:00 p.m. Monday through Friday and the baseline activity during nights and weekends. This chart is representative of all seven of the individual laboratories in facilities no. 1 and 2. This chart was plotted using reduced y-axis scale to improve the resolution. Figure 2 shows the observed cfm (L/s) data collected during the entire data-collection period using full yaxis scale from zero to maximum flow; and a horizontal line representing the total installed exhaust capacity was included for perspective . Note that the peaks rarely reach halfway between zero and maximum. Refer to Table 1 for a summary of the observed data and calculation results from all the facilities. As shown in Figure 3, the maximum, mean, and minimum observed diversities calculated during the data-collection period were 57%, 34%, and 31%, respectively. The diversity value below which 99% of the data points fall is 53% diversity. This data set was reduced to include only working hours, so the
13,000
6,000 5,000
11,000
4,000
10,000
3,000
9,000
2,000
8,000
Flow (L/s)
Actual Exhaust Flow 12,000
1,000 Wed.
Tue.
Mon.
Thu.
Sat.
Fri.
Sun.
Sun, 16:00
Sun, 8:00
Sun, 0:00
Sat, 16:00
Sat, 8:00
Sat, 0:00
Fri, 16:00
Fri, 8:00
Fri, 0:00
Thu, 16:00
Thu, 8:00
Thu, 0:00
Wed, 16:00
Wed, 8:00
Wed, 0:00
Tue, 16:00
Tue, 8:00
Tue, 0:00
Mon, 16:00
Mon, 8:00
0 Mon, 0:00
7,000
Day & Time Figure 1 1062
Exhaust flow chart for a single laboratory for a typical week ASHRAE Transactions: Symposia
25,000 11,000
Total Installed Exhaust Capacity 23,600 cfm (11,150 L/s)
10,000 20,000
9,000
15,000
7,000 6,000 5,000
10,000
4,000
Flow (L/s)
8,000
3,000 5,000
2,000 1,000 Thu, 0:00
Tue, 0:00
Wed, 0:00
Sun, 0:00
Mon, 0:00
Fri, 0:00
Sat, 0:00
Thu, 0:00
Tue, 0:00
Wed, 0:00
Sun, 0:00
Mon, 0:00
Fri, 0:00
Sat, 0:00
Thu, 0:00
Tue, 0:00
Wed, 0:00
Sun, 0:00
Mon, 0:00
Fri, 0:00
Sat, 0:00
Thu, 0:00
Tue, 0:00
Wed, 0:00
Sun, 0:00
Mon, 0:00
Fri, 0:00
Sat, 0:00
Thu, 0:00
Tue, 0:00
0 Wed, 0:00
0
Day & Time Figure 2
Exhaust flow rate chart, facility 1. TABLE 1. Summary Of Observed and Calculated Data for Three Laboratory Facilities Facility Number of Personnel Number of Hoods Fume Hood to Personnel Ratio Net Laboratory Area Maximum Observed Diversity 99% Design Diversity Mean Adjusted Diversity Mean Observed Diversity Ideal Mean Diversity Minimum Observed Diversity Minimum Possible Operating Diversity Turndown (Max/Min Diversity) Observations Installed Exhaust System Capacity Minimum Possible Flow rate Maximum Observed Flow Per Person Maximum Observed Flow Per Hood
ASHRAE Transactions: Symposia
1 13 16 1.23
2 10 21 2.10
3 225 110 0.49
6,400 ft2 (595 m2) 57% 53% 38% 34% 33% 31% 31% 1.8:1 429 23,600 cfm (11,139 L/s) 7,435 cfm (3,509 L/s) 1,035 cfm (488 L/s) 841 cfm
3,000 ft2 (279 m2) 53% 49% 34% 29% 28% 26% 26% 2.0:1 413 29,500 cfm (13,924 L/s) 7,650 cfm (3,611 L/s) 1,564 cfm (738 L/s) 745 cfm
40,000 ft2 (3,716 m2) 70% 67% 58% 56% 50% 47% 45% 1.5:1 2496 145,300 cfm (68,582 L/s) 64,800 cfm (30,586 L/s) 452 cfm (213 L/s) 925 cfm
1063
60% 55%
99% Design (53% Diversity)
50% 45% 40% 35% 30% 25%
Mean Observed Diversity (34%)
20%
Ideal Mean Diversity (33%)
15% 10% 5% Thu, 0:00
Tue, 0:00
Wed, 0:00
Sun, 0:00
Mon, 0:00
Fri, 0:00
Sat, 0:00
Thu, 0:00
Tue, 0:00
Wed, 0:00
Mon, 0:00
Sun, 0:00
Fri, 0:00
Sat, 0:00
Thu, 0:00
Tue, 0:00
Wed, 0:00
Mon, 0:00
Sat, 0:00
Sun, 0:00
Fri, 0:00
Thu, 0:00
Tue, 0:00
Wed, 0:00
Sun, 0:00
Mon, 0:00
Fri, 0:00
Sat, 0:00
Thu, 0:00
Tue, 0:00
Wed, 0:00
0%
Day & Time Figure 3
Exhaust diversity chart, facility 1. (397 L/s)
or below 53% diversity 99% of the time during working hours. Factors Affecting Patterns of Use, Facility No. 1 Type of Controls Installed: The fume hood face velocity controls are set at a constant face velocity of approximately 100 fpm (0.51 m/s) and there is no provision for user-selectable face velocities. The monitors for the controls alert the user by audible and visual alarms. There is a provision for providing maximum exhaust for the fume hood by pressing the emergency exhaust button, which opens the exhaust valve 100%. Each of the fume hood monitors also has a photocell that activates audible and visual alarms if the lights in the laboratory go out while the fume hood is open past a minimum setpoint, which is usually 2 to 4 in. (0.05 to 0.10 m). Training: All personnel in each of the laboratories were trained in the theory and operation of the exhaust system and the fume hood velocity controls after system start-up occurred. Safe fume hood operating procedures were taught to these groups in the context of a group safety meeting. A certain portion of the re1064
(351 L/s)
(436 L/s)
searchers in the facility relocate periodically, and the percentage of them who have not had first-hand training tends to increase over time. This is overcome by their colleagues training them or by periodic, informal, one-on-one training by the author. TABLE 2 Comparison Of 99% Design Diversity Calculations From The Diversity Data Sets And The Adjusted Diversity Data Sets Facility:
99% Design Diversity Using The Entire Diversity Dataset
1 2 3
50% 44% 66%
99% Design Diversity Using The Adjusted Diversity Dataset 53% 49% 67%
Monitoring and Enforcement: There is no formal method of monitoring or enforcing the proper use of the face velocity controls or policing the closing of fume hoods during nights and weekends. However, each of these laboratories is on a regular security guard route, and when the guard discovers a fume hood night energy waste alarm has been activated on a hood he or she will call the home of the researcher who is responsible for the fume hood. If the reASHRAE Transactions: Symposia
searcher cannot be contacted, then the next person in the laboratory hierarchy will be called until someone is reached who can deal with the problem. Over a period of about a month after system start-up these calls were reduced significantly. Most of the time they occur in the summer, when there is still enough light coming in through the laboratory windows to prevent the night energy waste alarm from being activated when the laboratory lights are turned off. A few hours
ASHRAE Transactions: Symposia
1065
70
100%
99% Design
90% 60 50
70% 60%
40 53%
50%
30
40% 429 Observations
30%
20
20%
Cumulative Percentage
80%
10 10%
60%
55%
50%
45%
40%
35%
30%
0% 25%
0
Diversity Figure 4
Adjusted diversity histogram, facility 1.
later, after it becomes dark outside, the alarm will be activated. System design: This system was designed to operate fully VAV with flow-tracking-type room pressurization controls. No diversity was assumed when selecting the mechanical equipment and completing the system design. The operation of the system has been excellent except for temperature regulation of air handler discharge temperature during times when the outside ambient temperature is between 30 and 35¡F (-1.1 and 1.7¡C). This was caused by freeze protection controls and leakage through face and bypass dampers. No user-related or exhaust system problems have occurred, however, which might have caused a change in user behavior and operation of the system. Noise: Great care was taken to reduce noise levels in the laboratory by proper fan selection and efficient ductwork design and sound traps. During start-up, the system operated very quietly and no problems were discovered. Start-up occurred in early spring. A few months later, after ambient temperatures had increased and additional sensibleheat-producing equipment had been added to the laboratories, a noise problem did occur. When all the fume hoods were closed and there was not enough airflow through the system to keep the internal temperatures at or below setpoint, the general exhaust valves would open, as they were supposed to, to 1066
stimulate more supply flow. When this occurred, a great deal of noise was produced by the general exhaust valve, which propagated backward through the duct and out the exhaust grille in the ceiling. This was objectionable enough to the researchers that they would leave a fume hood open to prevent it from occurring. When this was discovered, a sound trap was inserted in the ductwork between the exhaust grille and the general exhaust valve. This solved the problem completely and the researchers no longer leave a fume hood open to compensate. CASE STUDY: FACILITY NO. 2 Facility Size and Use Facility no. 2 is actually only one-half of a laboratory facility wing. The entire wing has six labs, three on each side of the hallway. The data for facility no. 2 represents three laboratories on one side of this facility, which were converted from constant-volume to variable-volume fume hoods by the installation of fume hood face velocity controls and new exhaust systems. The net area of these laboratories is All three approximately 3,000 ft2 (279 m2). laboratories are used for wet organic chemistry. Ten researchers used the fume hoods in these laboratories during the data collection period. Part-time personnel ASHRAE Transactions: Symposia
were added to the total as a percentage of their time worked. Hood Number, Type, and Capacity There are 21 fume hoods in these three laboratories in the following combination: eight 4-ft (1.2 m) benchtop hoods, five 6-ft (1.8 m) distillation hoods, two 8-ft (2.4 m) distillation hoods, two 6-ft
ASHRAE Transactions: Symposia
1067
(1.8 m) walk-in hoods, three 8-ft (2.4 m) walk-in hoods and one 10-ft (3.0 m) walk-in hood. Three of the fume hoods were new at the time the laboratories were renovated. These hoods were specified as VAV hoods and have tight construction with very low air leakage. The remaining 18 hoods were bypass-type hoods which were modified by closing the bypasses. The air leakage in these modified hoods is also very low. The total installed exhaust capacity is 29,480 cfm (13,910 L/s). This includes approximately 40 cfm (19 L/s) of flammable storage cabinet exhaust. The fume hoods in this facility operate with an average face velocity of 100 fpm (0.51 m/s). Description of Laboratory HVAC and Controls There are no room pressure controls because the laboratory spaces are connected to the corridor via large openings with no doors. The fume hoods are equipped with sash-position-sensing type face velocity controllers with monitors and venturi air volume control valves. Each of the face velocity controllers is wired to an exhaust system summing panel located in each laboratory. This facility uses 100% outside air, once-through, with no recirculation. Data Collection Methods and Accuracy A 0- to 10-volt analog output signal was connected from the exhaust system summing panels in each of the three laboratories to a strip chart recorder
1068
for approximately one month. The data from the strip charts were handled the same way as in facility no. 1 with the exception that all three of the calibration curves were definitely linear and went through the origin. The manufacturer’s reported accuracy is also similar to facility no. 1 at ± 5% of reading. Observed Performance Data and Analysis, Facility No. 2 Refer to Table 1 for a summary of the observed data and calculation results from all the facilities. The maximum, mean and minimum observed diversities calculated during the data collection period were 53%, 29%, and 26%, respectively. The diversity value below which 99% of the data points fall is 49% diversity. This data set was reduced to include only working hours, so the 99% design figure means that this system operates at or below 49% diversity 99% of the time during working hours. Factors Affecting Patterns of Use Facility No. 2 The type of controls installed, training, monitoring, and enforcement are identical to facility no. 1. System design: This system was a constantvolume supply and constant-volume exhaust system before renovation. Over the years, many more fume hoods had been installed in the building than could be suppported by the building make-up air system. This
ASHRAE Transactions: Symposia
40
caused some serious building pressure problems, which were impairing fume hood performance, impairing temperature and humidity control performance, producing excessive noise, and making it difficult to open the outside doors of the building. The owners chose to attack the exhaust side of the problem and assume that by installing fume hood face velocity controls that the building pressure problems and the other problems cited would be reduced. The alternative was to install additional make-up air capacity at approximately twice the cost of the exhaust system renovation and with increased energy costs. The 21 constant-
volume exhaust systems with one fan per fume hood were replaced with 35 two manifolded systems, one serving nine fume 30 hoods and the other serving twelve fume 25 hoods. Each of these two 413 Obs new systems has a single fan. Face velocity 20 controls were also installed on the fume 15 hoods at this time. The exhaust systems operate at 10 a constant static pressure. The system which was installed first uses a 5 variable -speed fan to maintain system pressure 0 while the newer system uses a constant-speed fan and a variable outside-air Diversity bypass damper to control system static pressure. The overall system performance has imFigure 6 Adjusted diversity histogram, facility 2. proved significantly since 39%
34%
29%
24%
19%
99% Design
60% 55% 99% Design (49% Diversity)
50% 45% 40% 35% 30% 25% Mean Observed Diversity (29%) Ideal Mean Diversity (28%)
20% 15% 10% 5%
Tue, 0:00
Wed, 0:00
Mon, 0:00
Sat, 0:00
Sun, 0:00
Fri, 0:00
Thu, 0:00
Tue, 0:00
Wed, 0:00
Sun, 0:00
Mon, 0:00
Fri, 0:00
Sat, 0:00
Thu, 0:00
Tue, 0:00
Wed, 0:00
Sun, 0:00
Mon, 0:00
Fri, 0:00
Sat, 0:00
Thu, 0:00
Tue, 0:00
Wed, 0:00
Sun, 0:00
Mon, 0:00
Fri, 0:00
Sat, 0:00
Thu, 0:00
Tue, 0:00
Wed, 0:00
Mon, 0:00
0%
Day & Time Figure 5
Exhaust diversity chart, facility 2.
ASHRAE Transactions: Symposia
1069
the modifications to the exhaust systems were made. The building’s static pressure now approaches ambient during working hours, and temperature and humidity control has been improved by reducing infiltration. The results are a more comfortable laboratory environment. Noise: Great care was taken to reduce noise levels in the laboratory by proper fan selection, efficient ductwork design, and sound traps. Noise levels in the laboratories were reduced approximately 3 dBA from pre-renovation levels.
CASE STUDY FACILITY NO. 3 Facility Size and Usage Facility No. 3 houses 225 researchers in 60 laboratory modules with a net laboratory area of 40,000 ft2 (3,716 m2). The laboratories are divided among two wings and three floors. The laboratories themselves form the center of the wings. Immediately adjacent to the laboratories are open landscape-style offices. The perimeter of the building contains enclosed offices. Work in these laboratories includes a variety of research and development activities including wet chemistry and analytical services. Hood Number, Type, and Capacity In facility No. 3 there are a total of 110 laboratory fume hoods as well as various specific exhaust points (see Table 1). There are 17 4 ft (1.22 m) bench hoods, 46 6 ft (1.82 m) bench hoods, and 47 8 ft (2.43 m) walk-in hoods. At a 100 fpm (.51 m/s) face velocity at the fume hoods, the total installed exhaust capacity is 145,300 cfm (68,600 L/s) including a specific exhaust flow rate of 15,000 cfm (7,080 L/s).
1070
ASHRAE Transactions: Symposia
Description of Laboratory HVAC and Controls Each laboratory space may have several hoods, all of which are controlled by a hot wire, through-thewall-type face velocity controller. Specific exhaust points are generally controlled by the user with a manual damper. Some specific exhaust points have a powered actuator with remote switching for on-off control from the operator station. All exhaust sources in a laboratory wing share a central exhaust fan system. Four staged, variable-speed fans maintain 1.7 in. w.g. (423 Pa) negative static pressure in the main duct. A separate hot wire, through-the-wall room pressure controller operates dampers in supply air variable-air- volume (VAV) boxes to maintain the laboratory space at a slight negative pressure relative to the adjacent office areas. The system is a VAV cooling system with reheat and is controlled with a digital energy management system. If normal exhaust flows through the hoods are not sufficient to remove sensible heat gains, there is an additional damper on the exhaust duct main that opens on a call for cooling. All supply air to the laboratory spaces is oncethrough. No air is recirculated in the labs. As an extra measure of safety, the office areas immediately adjacent to the laboratories also utilize a once-through approach. The supply air to these adjacent office areas is available as make-up air to the laboratories via transfer grilles. Separate air handling systems serve the perimeter offices and the remaining parts of the facility. Data Collection Methods and Accuracy The designers of the facility were reluctant to install flow measurement devices in the exhaust streams because of the increased maintenance and ongoing accuracy concerns that arise from a corrosive exhaust air stream. Instead, air flow measuring devices were installed on the laboratory supply air systems with the assumption that the building pressurization controls would balance supply and exhaust volumes. It is important to note that this assumption is not always valid. Normally the laboratory designer tends to be more concerned with the diversity of the exhaust than the supply, since exhaust is what the user directly determines by adjusting the hood sash opening. Because the raw data for this facility represents supply flow and not exhaust flow, testing was performed to test the validity of the assumption that supply and exhaust flow rates tracked together. The method used to check how well supply and exhaust volumes tracked together utilized smoke from ASHRAE Transactions: Symposia
a hand-held smoke generator at openings from the facility to the outside. This is a qualitative measurement of building pressurization. Smoke flow at these openings was observed as the exhaust flow rates were taken through the range from maximum to minimum by closing fume hood sashes. A slight negative pressure was maintained through the range of normal exhaust flows as indicated by a gentle flow of smoke into the openings. As a final step, exhaust dampers controlling sensible cooling were closed by energy management system override. At this time, the facility went slightly positive as indicated by a gentle flow of smoke out of the building. Further investigation revealed that the number and size of the supply air VAV boxes was such that an excess supply volume was delivered even when all boxes went to their minimum position. There were two main reasons for this excess supply air. The minimum flow rates for the VAV boxes were set based on the lowest repeatable flow rate of pneumatic controller. In addition, the boxes were sized for a reasonably low pressure drop, creating a very low velocity pressure at the controller sensor. Therefore, they were slightly oversized for the minimum condition. The combination of a large VAV box and pneumaticcontrolled minimum led to a lower turn-down ratio for the supply system than for the exhaust system. Based on this information, it was concluded that the supply and exhaust volumes tracked well down to the point where the supply air minimum was reached. Data were collected every 15 minutes for four weeks from flow transmitters on four supply fans. The sensing device was an averaging pitot tube array mounted in the inlet of the fan coupled to a differential pressure transmitter with square root extractor. These supply fans were arranged in redundant pairs and operated so that a second fan staged on when the first fan could not maintain the desired static pressure in the supply ductwork. Because the fans were staged, inlet velocities were always above 1000 FPM (5.1 M/s) , providing better than 5% overall accuracy across the range of normal flow rates. Variable-speed drives controlled all fan motor speeds as required. Observed Performance Data and Analysis, Facility No. 3 Refer to Table 1 for a summary of the observed data and calculation results from all the facilities. The diversity value below which 99% of the data points fall is 67% diversity. This data set was reduced to include only working hours so the 99% design figure 1071
means that this system operates at or below 67% diversity 99% of the time during working hours. The mean observed diversity and the minimum observed diversity shown in Table 1 and Figure 7 are artificially high due to the difference between the minimum possible supply flow rate and the minimum possible exhaust flow rate, and are shown for reference only. The 99% diversity figure, however, should be accurate because the facility operated with exhaust flow rates significantly above the minimum supply flow rate during working hours. Factors Affecting Patterns of Use, Facility No. 3 Type of Controls Installed The controls installed on the hoods allowed the user to select from five choices: Minimum, which equaled 50 fpm (0.25 m/s); 75 fpm (0.38 m/s); 100 fpm (0.51 m/s);
1072
ASHRAE Transactions: Symposia
75% 70% 99% Design (67% Diversity)
65%
Mean Observed Diversity (56%)
60% 55% 50% Ideal Mean Diversity (50%)
45% 40% 35%
Sat, 4:45
Thu, 15:15
Tue, 15:15
Wed, 15:15
Mon, 15:15
Sun, 15:00
Sat, 15:00
Fri, 15:00
Thu, 14:30
Wed, 14:30
Tue, 14:15
Mon, 13:45
Sun, 13:45
Sat, 13:45
Thu, 0:45
Wed, 0:45
Tue, 0:45
Mon, 0:30
Sun, 0:30
Sat, 0:15
Fri, 0:15
Thu, 0:15
Wed, 0:15
Tue, 0:15
Mon, 0:15
Sun, 0:00
30%
Day & Time Supply diversity chart, facility 3. 100.00%
99% Design
90
90.00%
2496 Observations
80
80.00%
70
70.00%
60
60.00% 67%
50
50.00%
10
10.00%
0
0.00% 75%
20.00%
65%
20
60%
30.00%
55%
30
50%
40.00%
45%
40
Cumulative Percentage
100
70%
Figure 7
Diversity % Figure 8
Adjusted diversity histogram, facility 3.
ASHRAE Transactions: Symposia
1073
150 fpm (0.76 m/s); and emergency, which fully opens the exhaust damper. An alarm light on the controller warned the operator if the actual face velocity differed from the setpoint for more than a few seconds. A differential pressure gage was permanently installed on each hood to measure the pressure drop through the hood. This served as another indicator of hood performance for the operator. Actual face velocity matched setpoint in approximately 15 seconds after a full range sash position change. Training Formal training was provided to all personnel when the building was first occupied. This consisted of an explanation of the whole supply and exhaust system with a focus on how the use of the hood affected the rest of the building. Proper selection of the face velocity setpoint and use of the sash was explained in detail. Emergency procedures were also covered. Ongoing safety meetings in the facility keep awareness of correct procedures high. Each hood has a laminated plastic instruction tag posted by the controller that summarizes proper operation. Monitoring and Enforcement The campus site where this facility is located supports round-the-clock shifts of operators that run the utilities for a central distribution system. As part of their duties, these operators go through the facility on off-hours about once a week looking for hoods that have sashes open. They close any sashes they find open and record the names of the people responsible for the open hoods. These names are then passed on to the facility manager. Repeat offenders have charges accrued against their expense accounts for wasting energy. System Design This facility was designed from the beginning to support a variable-air-volume concept. Although no diversity was assumed, all aspects of the system support varying levels of use. Start-up and operation of this facility were very smooth. Users have not seen upset conditions that lead them to distrust the system. Noise Special efforts were made to keep fan generated noise to very low levels within the labs. Sound traps mounted in the ductwork and good system design practice led to a quiet operation at all rates.of use. Fume hood users are not able to tell at what fraction of capacity the facility is running based on noise levels. DISCUSSION, CONCLUSIONS AND RECOMMENDATIONS The authors feel there are two primary motivators and one secondary motivator that fundamentally determine whether or not diversity will exist in a labora1074
tory facility. The first primary factor is the system design and function. Laboratory pressure, temperature, humidity, etc. must remain stable despite varying fume hood or specific exhaust use. The second primary motivator is training. The operator of the hood must understand how to use the hood and the associated controls. The operator must also have an understanding of why proper use of the hood is important. The third motivator is monitoring and enforcement. It is called a secondary motivator because it is generally the mechanism that locates a shortfall in system function or operator training. Enforcement is the most effective method of dealing with those who do not comply with established procedures, especially when there are consequences (positive or negative) associated with the enforcement activity. Each of the three facilities described in this paper has met minimum levels of performance in both the primary and secondary motivators. Comparison of the data and results presented in this paper should only be made with facilities that have comparable levels of performance in these motivating areas. The exhaust (or supply) diversity chart (Figures 3, 5, and 7) can be a powerful tool in evaluating the operation of an existing facility. Below is a list of things to look for when developing an energy conservation strategy based on a diversity chart. 1. Flow peaks or lack of well-defined valleys on nonworking hours: This indicates that hood users are not closing hood sashes when they leave the laboratory. The magnitude of this problem can be measured using the difference between the mean observed diversity and the ideal mean diversity. Note that this measure does not differentiate between legitimate hood usage in the non-working hours and hoods left unattended by forgetful users. As long as either one occurs the mean observed diversity cannot be lowered to the ideal mean diversity. 2. Peaks near or at the total installed exhaust capacity: This indicates that operators open their hood sashes during their working hours whether they are using them or not. This is a signal of poor work habits which can be addressed by training or monitoring and enforcement methods. 3. Relatively high minimum observed diversity: Lowering the minimum can be a potential source of great energy savings. The minimum is determined by a variety of factors including control set points, leakage rates, sensible heat loads, and air quality standards. In some systems the leakage rates around dampers or at duct joints may deterASHRAE Transactions: Symposia
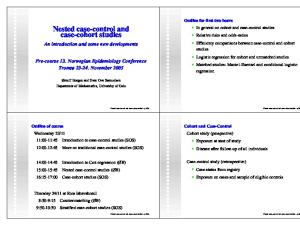
mine the minimum. In others, the air required to remove sensible heat gain may be the limiting factor (depending on the temperature of the supply air). In still others, air quality standards may determine the minimum. A review of the 99% design diversity results from the three facilities described in this paper show a relatively broad range (refer to Table 1). Facility no. 3 had the highest 99% design diversity at 67%. Facility no. 2 had the lowest at 49%. Data from all three facilities strongly support the concept that diversity is a real phenomenon that will occur in real laboratory facilities if certain minimum conditions exist. However, if diversity could not be predicted with more precision than is indicated by the range mentioned above, determination of diversity for design purposes would be difficult. The authors suggest that there is a method that may serve to better predict the diversity of a particular facility. Aside from the primary and secondary motivators already described, the next most influential factor affecting diversity is the ratio of hoods to laboratory personnel. The 99% design diversity numbers have been plotted against the hood/personnel ratio in Figure 9. A linear regression was performed and the resulting line is also shown in Figure 9. For the three facilities reviewed in this paper, a strong correlation exists between the diversity and the number of hoods per user. This makes sense, since one would expect hood utilization to increase as more personnel were required to share the available hoods. Caution is recommended when attempting to apply this correlation to other facilities. Three data points
ASHRAE Transactions: Symposia
are a very small sample and the need for more research in this area is indicated. Extrapolation of the line or application to facilities with low numbers of people or hoods is not recommended. Note that this ratio ignores specific ventilation. As the specific exhaust rate fraction of the total installed exhaust capacity for a facility increases, the accuracy of this method is expected to diminish. The authors believe that if more research is done, and a larger sample size is used to increase the statistical significance, a 99% design diversity may be predicted for a well-designed, functional facility with trained personnel and a monitoring and enforcement system. Knowing the 99% design diversity at the design stage allows the size of facility-wide mechanical systems supporting heating, cooling, humidification and other non-safety functions to be reduced. The 99% design diversity should not be used to size the exhaust or supply fan capacity. Undersizing the exhaust and supply has strong safety implications for the hood user. These fans should continue to be sized for the total installed exhaust capacity. The difference between the total installed exhaust capacity and the observed diversity that will occur can then be treated as a safety factor. Note that the diversities discussed in this paper apply to the facility as a whole. Thus, only the equipment supporting the whole facility can take advantage of this diversity. While local diversity may occur in various parts of the facility, the local diversity may differ substantially from the diversity of the whole. Therefore, care must be taken when sizing ducts, pipes, and other equipment serving only a subset of the facility.
1075
National Research Council. 1986. Prudent practices for handling hazardous chemicals in laboratories. Section H: Laboratory Ventilation. Washington,DC: National Academy Press. Rabiah, T.M., R.P. Garrison, and R.K. Sachdev. 1989. Comparisons of variable-volume fume hood controls. ASHRAE Transactions 95(2). Shumaker, R.B. 1989. User's experiences with variable-volume laboratory fume hood exhaust systems. ASHRAE Transactions 95(2).
BIBLIOGRAPHY ANSI. 1989. ANSI Standard Z9. 5-1989, Laboratory ventilation. New York: American National Standards Institute, Inc. Ashbrook, P.C. and M.M. Renfrew, eds. 1991. Safe laboratories: Principles and practices for design and remodeling. Chelsea, MI: Lewis Publishers, Inc. ASHRAE. 1989. ASHRAE handbook—1987 HVAC systems and applications, chapter 30, “Laboratories”; chapter 32, “Duct Design” Atlanta, GA: American Society of Heating, Refrigeratingand Air-Conditioning Engineers, Inc. CRC handbook of laboratory safety, 3rd ed. 1991. A.K. Furr, ed. Boca Raton, FL: CRC Press, Inc. Lacey, D.R. 1989. Observed performance of VAV hood controls. ASHRAE Transactions 95(2). Monsen, R.R. 1989. Practical solutions to retrofitting existing fume hoods in laboratories. ASHRAE Transactions 95(2). NFPA. 1986. NFPA Standard Code No. 45, Fire protection for laboratories using chemicals, chapter 6, "Laboratory ventilating systems and hood requirements. " Quincy, MA: National Fire Protection Association.
DISCUSSION
Jeff Brouillette, Physical Plant Mechanical Engineering Supervisor, University of Texas, Austin: I understand the value of VAV. However, taking diversity to decrease the size of systems limits the long-term flexibility of the facility. VAV system complexity makes maintenance difficult and expensive. It also may not save money when minimum ventilation rates are considered. I feel a better approach would be heat recovery to allow for savings. R.S. Shull: This paper was focused on providing diversity data from the field and makes no attempt to critique the concept of variable air volume. The advantages or disadvantages of VAV are discussed ex-
70
Facility No. 3 60
Facility No 1 50
Facility No. 2 Regression Line: y = (-11.0)x + 70.3
40
Correlation Coefficient (R-Squared) = 0.87 30
20
10
0 0
0.5
1
1.5
2
2.5
Hood to Personnel Ratio (Hoods/Person) Figure 9 1076
Relationship between fume hood/personnel ratio and 99% diversity ASHRAE Transactions: Symposia
tensively in other places Similarly, this was not a paper about what to do with diversity predictions once they are established (although the authors do briefly comment on this in the recommendations section). John Mentzer, Chief Engineer, SSOE, Troy, MI: Did the exhaust flow used for development of the minimum possible diversity include general air-conditioning exhaust? If yes, did you make the measurements with lights and equipment on or off? Shull: In the general case, the diversity calculations include the exhaust required for general ventilation. Because the general exhaust is small compared to the hood exhaust, it has little effect on the 99% design diversity. For the minimum possible condition, the effect is more significant. As stated in the paper, only facilities 1 and 3 had general exhaust. In order to establish the minimum possible diversity for facility 3, the tie between general exhaust and cooling demand was disabled. This would be equivalent to the case where all lights and equipment were off and only duct leakage was measured from general ventilation system. Note that the minimum possible condition for facility 3 is known to be skewed upward because of supply-side flow measurement and constraints. For facility 1, the minimum possible diversity was established with equipment and lights on.
ASHRAE Transactions: Symposia
1077