Chapter
Measures of Poverty
Summary Assume that information is available on a welfare measure, such as income per capita, and on a poverty line, for each household or individual. This chapter explains how one may then construct summary measures of the extent of poverty. The headcount index (P0) measures the proportion of the population that is poor. It is popular because it is easy to understand and measure. But it does not indicate how poor the poor are. The poverty gap index (P1) measures the extent to which individuals fall below the poverty line (the poverty gaps) as a proportion of the poverty line. The sum of these poverty gaps gives the minimum cost of eliminating poverty, if transfers were perfectly targeted. The measure does not reflect changes in inequality among the poor. The squared poverty gap index (also known as the poverty severity index, P2) averages the squares of the poverty gaps relative to the poverty line. It is one of the Foster-Greer-Thorbecke (FGT) class of poverty measures that allow one to vary the amount of weight that one puts on the income (or expenditure) level of the poorest members in society. The FGT poverty measures are additively decomposable. It is also possible to separate changes in the FGT measures into a component resulting from rising average incomes, and a component resulting from changes in the distribution of income. The Sen-Shorrocks-Thon index combines measures of the proportion of poor people, the depth of their poverty, and the distribution of welfare among the poor. This measure allows one to decompose poverty into three components and to ask: Are there more poor? Are the poor poorer? Is there higher inequality among the poor? 67
4
Haughton and Khandker
4
Other measures of poverty are available. The time taken to exit measures the average time it would take for a poor person to get out of poverty, given an assumption about the economic growth rate; it may be obtained as the Watts Index divided by the growth rate of income (or expenditure) of the poor.
Learning Objectives After completing the chapter on Measures of Poverty, you should be able to 1. Describe and explain the headcount index, indicate why it is popular, and explain why it is an imperfect measure of poverty. 2. Describe and compute the poverty gap and poverty severity indexes, and evaluate their adequacy as measures of poverty. 3. Explain and evaluate the FGT (Foster-Greer-Thorbecke) family of poverty measures. 4. Compute the Sen and Sen-Shorrocks-Thon indexes of poverty, and show how the latter may be decomposed to identify the sources of changes in poverty. 5. Compute the Watts index and the related time taken to exit measure. 6. Argue that there is no single best measure of poverty.
Introduction Given information on a welfare measure such as per capita consumption, and a poverty line, the next issue is deciding on an appropriate summary measure of aggregate poverty. A number of aggregate measures of poverty can be computed. The formulas presented in this chapter are all based on the assumption that the survey represents a simple random sample of the population, which makes them relatively easy to understand. Where the sampling is more complex—the typical situation in practice—weighting is needed, and the relevant formulas and associated programming are somewhat more difficult, but can be handled fairly easily by most major statistical packages such as Stata, SPSS, and SAS.
Headcount Index By far, the most widely used measure is the headcount index, which simply measures the proportion of the population that is counted as poor, often denoted by P0. Formally, 68
,
(4.1)
CHAPTER 4: Measures of Poverty
4
where Np is the number of poor and N is the total population (or sample). If 60 people are poor in a survey that samples 300 people, then P0 = 60/300 = 0.2 = 20 percent. For reasons that will be clearer below, it is often helpful to rewrite (4.1) as (4.2) Here, I(·) is an indicator function that takes on a value of 1 if the bracketed expression is true, and 0 otherwise. So if expenditure (yi) is less than the poverty line (z), then I(·) equals 1 and the household would be counted as poor. The greatest virtues of the headcount index are that it is simple to construct and easy to understand. These are important qualities. However, the measure has at least three weaknesses: First, the headcount index does not take the intensity of poverty into account. Consider the following two income distributions: Headcount Poverty Rates in A and B, Assuming Poverty Line of 125 Expenditure for each individual in country Expenditure in country A Expenditure in country B
100 124
100 124
150 150
150 150
Headcount poverty rate (P0) 50% 50%
Clearly, there is greater poverty in country A, but the headcount index does not capture this. As a welfare function, the headcount index is unsatisfactory in that it violates the transfer principle, an idea first formulated by Dalton (1920) that states that transfers from a richer to a poorer person should improve the measure of welfare. With the headcount index, if a somewhat poor household were to give to a very poor household, the index would be unchanged, even though it is reasonable to suppose that poverty overall has lessened. Some argue that if it is to be meaningful, the headcount index should imply that there is a “jump” or discontinuity in the distribution of welfare at about the poverty line, so it makes sense to speak of the poor and the nonpoor. In practice, such a jump is not found (Ravallion 1996). Second, the headcount index does not indicate how poor the poor are, and hence does not change if people below the poverty line become poorer. Indeed, the easiest way to reduce the headcount index is to target benefits to people just below the poverty line, because they are the ones who are cheapest to move across the line. But by most normative standards, people just below the poverty line are the least deserving of the poor. Third, the poverty estimates should be calculated for individuals, not households. If 20 percent of households are poor, it may be that 25 percent of the population is
69
Haughton and Khandker
4
poor (if poor households are large) or 15 percent is poor (if poor households are small); the only relevant figures for policy analysis are those for individuals. But survey data are almost always related to households, so to measure poverty at the individual level we must make a critical assumption that all members of a given household enjoy the same level of well-being. This assumption may not hold in many situations. For example, some elderly members of a household, or girls, may be much poorer than other members of the same household. In reality, consumption is not always evenly shared across household members.
Poverty Gap Index A moderately popular measure of poverty is the poverty gap index, which adds up the extent to which individuals on average fall below the poverty line, and expresses it as a percentage of the poverty line. More specifically, define the poverty gap (Gi) as the poverty line (z) less actual income (yi) for poor individuals; the gap is considered to be zero for everyone else. Using the index function, we have Gi = (z – yi) × I(yi < z)
(4.3)
Then the poverty gap index (P1) may be written as (4.4) This table shows how the poverty gap is computed, divided by the poverty line, and averaged to give P1, the poverty gap index. Calculating the Poverty Gap Index, Assuming Poverty Line of 125 Expenditure for each individual in country Expenditure in country C Poverty gap Gi /z
70
100 25 0.20
110 15 0.12
150 0 0
160 0 0
Poverty gap index (P1)
0.08 [= 0.32/4]
This measure is the mean proportionate poverty gap in the population (where the nonpoor have zero poverty gap). Some people find it helpful to think of this measure as the minimum cost of eliminating poverty (relative to the poverty line), because it shows how much would have to be transferred to the poor to bring their incomes or expenditures up to the poverty line (as a proportion of the poverty line). The minimum cost of eliminating poverty using targeted transfers is simply the sum of all the poverty gaps in a population; every gap is filled up to the poverty line. However, this interpretation is only reasonable if the transfers could be made perfectly efficiently, for instance, with lump sum transfers, which is implausible. Clearly, this assumes that the policy maker has a lot of information; one should not be surprised
CHAPTER 4: Measures of Poverty
4
to find that a very “pro-poor” government would need to spend far more than this in the name of poverty reduction. At the other extreme, one can consider the maximum cost of eliminating poverty, assuming that the policy maker knows nothing about who is poor and who is not. From the form of the index, it can be seen that the ratio of the minimum cost of eliminating poverty with perfect targeting (that is, Gi) to the maximum cost with no targeting (that is, z, which would involve providing everyone with enough to ensure they are not below the poverty line) is simply the poverty gap index. Thus, this measure is an indicator of the potential savings to the poverty alleviation budget from targeting: the smaller the poverty gap index, the greater the potential economies for a poverty alleviation budget from identifying the characteristics of the poor—using survey or other information—so as to target benefits and programs. The poverty gap index still violates Dalton’s transfer principle. To see this, consider the following example:
Poverty Gap Poverty Rates in A and B, Assuming Poverty Line of 125 Expenditure for each individual in Poverty gap country rate (P1) Expenditure in country A Expenditure in country B
99 79
101 121
150 150
150 150
0.10 0.10
Headcount index (P0) 50% 50%
For both of these countries, the poverty gap rate is 0.10, but most people would argue that country B has more serious poverty because it has an extremely poor member. One could think of the distribution in B as being generated from that in A by transferring 20 from the poorest person to the next poorest person—hardly an improvement in most people’s eyes, yet one that has no effect on the poverty gap rate.
Squared Poverty Gap (Poverty Severity) Index To construct a measure of poverty that takes into account inequality among the poor, some researchers use the squared poverty gap index. This is simply a weighted sum of poverty gaps (as a proportion of the poverty line), where the weights are the proportionate poverty gaps themselves; a poverty gap of, say, 10 percent of the poverty line is given a weight of 10 percent while one of 50 percent is given a weight of 50 percent; this is in contrast with the poverty gap index, where the gaps are weighted equally. Hence, by squaring the poverty gap index, the measure implicitly puts more weight on observations that fall well below the poverty line. Formally, (4.5)
71
Haughton and Khandker
4
This table shows how the poverty gap is computed, divided by the poverty line, squared, and averaged to give P2, the squared poverty gap index. Calculating the Poverty Gap Index, Assuming Poverty Line of 125
Expenditure in country C Poverty gap Gi /z (Gi /z)2
Expenditure for each individual in country
Squared poverty gap index (P2)
100 25 0.20 0.04
0.0136 [= 0.0544/4]
110 15 0.12 0.0144
150 0 0 0
160 0 0 0
The measure lacks intuitive appeal, and because it is not easy to interpret it is not used very widely. It may be thought of as one of a family of measures proposed by Foster, Greer, and Thorbecke (1984), which may be written, quite generally, as (4.6) where α is a measure of the sensitivity of the index to poverty and the poverty line is z, the value of expenditure per capita for the ith person’s household is xi, and the poverty gap for individual i is Gi = z – xi (with Gi = 0 when xi > z). When parameter α = 0, P0 is simply the headcount index. When α = 1, the index is the poverty gap index P1, and when α is set equal to 2, P2 is the poverty severity index. For all α > 0, the measure is strictly decreasing in the living standard of the poor (the higher one’s standard of living, the less poor one is deemed to be). Furthermore, for α > 1 the index also has the property that the increase in measured poverty because of a fall in one’s standard of living will be deemed greater the poorer one is. The measure is then said to be “strictly convex” in incomes (and “weakly convex” for α = 1). Another convenient feature of the FGT class of poverty measures is that they can be disaggregated for population subgroups and the contribution of each subgroup to national poverty can be calculated. Example: Suppose that the headcount poverty rate in the urban areas, where 40 percent of the population lives, is 8 percent, and that the rural poverty rate is 35 percent. Then the national poverty rate may be obtained as the weighted average of these subnational poverty rates, as P0 = P0,urban(Nurban/N) + P0,rural(Nrural/N) = .08(0.4) + 0.35(0.6) = 0.242, or 24.2 percent.
72
Although the FGT measure provides an elegant unifying framework for measures of poverty, it leaves unanswered the question of the best value of α. The measures of poverty depth and poverty severity provide information complementary to the incidence of poverty. It might be the case that some groups have a
CHAPTER 4: Measures of Poverty
4
high poverty incidence but low poverty gap (when numerous members are just below the poverty line), while other groups have a low poverty incidence but a high poverty gap for those who are poor (when relatively few members are below the poverty line but with extremely low levels of consumption). Table 4.1 provides an example from Madagascar. According to the headcount measure (P0), unskilled workers show the third highest poverty rate, while the group is ranked fifth according to the poverty severity index (P2). Compared to herders, unskilled workers have a higher risk of being in poverty, but their poverty tends to be less severe. The types of interventions needed to help the two groups are therefore likely to be different. Table 4.1 Poverty Indexes By Subgroups, Madagascar, 1994
Small farmers Large farmers Unskilled workers Herders and fishermen Retirees and the handicapped
Headcount [P0] (percent) 81.6 77.0 62.7 51.4 50.6
Rank
Poverty gap [P1] (percent)
1 2 3 4 5
41.0 34.6 25.5 27.9 23.6
Rank
Poverty severity ⴛ 100 [P2]
Rank
1 2 4 3 5
24.6 19.0 14.0 16.1 14.1
1 2 5 3 4
Source: Coudouel, Hentschel, and Wodon 2001.
Review Questions 1. In a sample of 5,000 households, 800 households have expenditure levels below the poverty line. This means that the headcount poverty rate
° ° ° °
A. Was 16 percent. B. Was 0.0625. C. Cannot be computed from these numbers. D. Is too small to be computed accurately.
2. A society consists of four individuals with the following incomes: 200, 220, 300, and 320. The poverty line is 250. The poverty gap index is then
° ° ° °
A. 0.5. B. 0.08. C. 0.16. D. 20.
3. The squared poverty gap index (sometimes referred to as the poverty severity index) is obtained by computing the square of the poverty gap index, which puts more weight on the very poor.
° °
True False
73
Haughton and Khandker
4 4. Which of the following statements is most accurate?
° ° ° °
A. Policy makers like to use the poverty severity index because it puts more weight on the plight of the poor than the poverty gap or headcount indexes. B. The measure of the relative poverty of different groups in society—for instance, rural versus urban populations—is typically not affected very much by whether one uses the headcount, poverty gap, or poverty severity indexes to measure poverty. C. The poverty gap index typically shows poverty to be more severe than does the headcount index. D. If income were transferred from a poor person to a very poor person, the poverty gap index would fall.
Sen Index Sen (1976) proposed an index that seeks to combine the effects of the number of poor, the depth of their poverty, and the distribution of poverty within the group. The index is given by (4.7) where P0 is the headcount index, μP is the mean income (or expenditure) of the poor, and GP is the Gini coefficient of inequality among the poor. The Gini coefficient ranges from 0 (perfect equality) to 1 (perfect inequality), and is discussed in chapter 5 in the context of measuring inequality. The Sen index can also be written as the average of the headcount and poverty gap measures, weighted by the Gini coefficient of the poor, giving Ps = P0G p + P1(1 – G p).
(4.8)
It can be shown (Xu and Osberg 2002) that the Sen index may also be written as ,
(4.9)
where GPP is the Gini coefficient of the poverty gap ratios of only the poor and is the poverty gap index calculated over poor individuals only. The Sen index has been widely discussed, and has the virtue of taking the income distribution among the poor into account. However, the index is almost never used outside of the academic literature, perhaps because it lacks the intuitive appeal of some of the simpler measures of poverty, but also because it “cannot be used to decompose poverty into contributions from different subgroups” (Deaton 1997, 147).
The Sen-Shorrocks-Thon Index 74
The Sen index has been modified by others, and one of the more attractive versions is the Sen-Shorrocks-Thon (SST) index, defined as
CHAPTER 4: Measures of Poverty
4 (4.10)
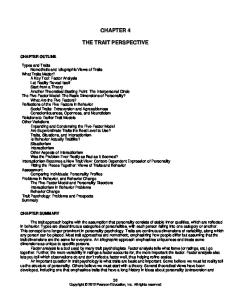
which is the product of the headcount index, the poverty gap index (applied to the poor only), and a term with the Gini coefficient of the poverty gap ratios (that is, of the Gn’s) for the whole population. This Gini coefficient typically is close to 1, indicating great inequality in the incidence of poverty gaps. Example: In 1996, 12.4 percent of the population of Quebec province (Canada) was in poverty. The poverty gap index, applied to the poor only, stood at 0.272. And the Gini coefficient of the poverty gap ratios was 0.924. Thus the SST index was 0.065 = (0.124 × 0.272 × (1 + 0.924)). Osberg and Xu (1999) used the SST index to compare poverty in the United States and Canada over time. Figure 4.1 shows that while poverty was similar in the two countries a generation ago, it is now clearly higher in the United States than in Canada. One strength of the SST index is that it can help give a good sense of the sources of change in poverty over time. This is because the index can be decomposed into Figure 4.1 Comparison of Canada and the United States Using the SST Index, 1971–94
Source: Osberg and Xu 1999, reproduced with permission from Canadian Public Policy—Analyse de Politiques. Note: Poverty line based on half of median equivalent income. The 95% confidence interval is the mean ± 2 standard deviations, based on 300 bootstraps.
75
Haughton and Khandker
4
(4.11) which may be interpreted as, percentage change in SST index = percentage change in headcount index + percentage change in poverty gap index (among poor) + percentage change in (1 + Gini coefficient of poverty gaps). In plain English, this allows us to decompose poverty into three aspects: Are there more poor? Are the poor poorer? And is there higher inequality among the poor? Example: The information in table 4.2 comes from Osberg and Xu (1999), and traces the evolution of poverty in the Canadian province of Newfoundland between 1984 and 1996. It is clear that most of the change in the poverty rate over time was due to variations in the number of people in poverty (P1), rather than in the size of the poverty gap per poor person (P1P) or the distribution of poverty among the poor (GP). Note that the values of the SST index provided by Osberg and Xu in figure 4.1 do not give just a single point estimate for each observation; the authors also provide a confidence interval. Because the SST index is complex, it is not possible to compute these confidence intervals analytically. Instead, they are computed artificially using bootstrapping. The basic idea behind the bootstrap is straightforward and clever. Suppose we have a survey sample of 2,000 households. Now pick a sample of 2,000 from this sample with replacement—that is, pick a household, then put it back into the sample, pick another household, put it back into the sample, and so on, until you have picked 2,000 households. Some households will be chosen more than once, but that is fine. Now compute the SST index using this artificial sample. Then repeat the process many times; Osberg and Xu used 300 repetitions. The result is a distribution of values of the SST from which it is easy to find, say, the 95 percent confidence interval. Sample Stata code to generate confidence intervals for the SST index is given in appendix 3, in the exercises associated with chapter 5. Table 4.2 Decomposition of Poverty and Changes in Poverty in Newfoundland, 1984–96
1984 1989 1994 1995 1996
SST index
P0
P1P
1 + GP
ΔlnSST index
ΔlnP0
0.137 0.095 0.105 0.125 0.092
0.245 0.169 0.184 0.212 0.164
0.304 0.296 0.304 0.316 0.294
1.844 1.897 1.884 1.864 1.897
–0.370* 0.104 0.168 –0.307
–0.372* 0.086 0.141 –0.254
ΔlnP1P
Δln (1 + GP)
–0.027 0.026 0.038 –0.071
0.028 –0.007 –0.010 0.018
Source: Osberg and Xu 1999.
76
Note: Poverty line is half of median equivalent income, using the “Organisation for Economic Co-operation and Development scale”—that is, equivalent income = 1 + 0.7(Nadults – 1) + 0.5(Nchildren). * denotes statistically significant at the 95 percent level.
CHAPTER 4: Measures of Poverty
4
The Watts Index The first distribution-sensitive poverty measure was proposed in 1968 by Watts (see Zheng 1993), and in its discrete version takes the form (4.12) where the N individuals in the population are indexed in ascending order of income (or expenditure), and the sum is taken over the q individuals whose income (or expenditure) yi falls below the poverty line z. The following table shows how the Watts index is computed, by dividing the poverty line by income, taking logs, and finding the average over the poor. Although it is not a particularly intuitive measure, the Watts index is increasingly used by researchers because it satisfies all the theoretical properties that one would want in a poverty index. Ravallion and Chen (2001) argue that three axioms are essential to any good measure of poverty. Under the focus axiom, the measure should not vary if the income of the nonpoor varies; under the monotonicity axiom, any income gain for the poor should reduce poverty; and under the transfer axiom, inequality-reducing transfers among the poor should reduce poverty. The Watts index satisfies these three axioms, but the headcount (P0) and poverty severity (P1) measures do not. Calculating the Watts Index, Assuming Poverty Line of 125 Expenditure for each individual in country
Case 1 (poor) Expenditure in country C z/yi log (z/yi) Case 2 (less poor) Expenditure in country C z/yi log (z/yi) Case 3 (deeper poverty) Expenditure in country C z/yi log (z/yi)
Watts index
100 1.25 0.223
110 1.14 0.128
150 0.83 –0.182
160 0.78 –0.247
0.088
110 1.14 0.128
120 1.04 0.041
150 0.83 –0.182
160 0.78 –0.247
0.042
90 1.25 0.329
120 1.10 0.041
150 0.83 –0.182
160 0.78 –0.247
0.092
Table 4.3 presents a variety of poverty measures for a selection of 13 countries using the $2/day standard (actually, US$60.8 per month in 2005 prices). These were computed by the World Bank’s PovcalNet program (http://iresearch.worldbank.org/ PovcalNet/povcalNet.html), which first fits a Lorenz curve to available data (which are typically grouped) on the distribution of per capita income (or expenditure), and
77
Haughton and Khandker
4
Table 4.3 Measures of Poverty (with a $2/day Poverty Line) and Inequality for Selected Countries and Regions
Year Nigeria India, rural Uganda India, urban Haiti Senegal China, rural Vietnam Armenia South Africa China, urban Guatemala Peru Paraguay Mexico
2003 2004/5 2005 2004/5 2001 2005 2005 2006 2003 2000 2005 2006 2005 2005 2006
Mean per montha 39 50 53 62 64 67 71 83 84 153 162 200 224 257 330
P0 (%)
P1 (%)
P2 × 100
Watts
Gini
Mean log deviation
83.9 79.5 75.6 65.8 72.1 60.3 55.6 48.4 43.4 42.9 9.4 24.3 19.4 18.4 4.8
46.9 30.9 36.4 26.0 41.8 24.6 19.5 16.2 11.3 18.3 2.1 8.9 6.3 7.3 1.0
30.78 14.66 21.12 12.90 28.98 12.96 8.92 7.04 4.13 9.66 0.81 4.43 2.68 4.06 0.31
0.838 0.429 0.581 0.378 0.812 0.374 0.274 0.223 0.143 0.273 0.029 0.129 0.088 0.108 0.012
0.429 0.305 0.426 0.376 0.595 0.392 0.359 0.378 0.338 0.578 0.348 0.537 0.520 0.539 0.481
0.320 0.160 0.305 0.233 0.675 0.259 0.213 0.234 0.198 0.605 0.209 0.525 0.484 0.546 0.405
Source: World Bank, PovcalNet, accessed November 4, 2008. Note: P0 is the headcount poverty rate; P1 is the poverty gap index; and P2 is the poverty severity index. The poverty line is set at US$2 per day ($60.8 per month). a. Mean monthly expenditure (or income) per capita in 2005 purchasing power parity US$.
then applies the chosen poverty line to estimate the poverty rates; further details about PovCalNet are given in chapter 10. All of our admonitions about the pitfalls of comparing poverty rates across countries must be borne in mind here, but the purpose of this tabulation is not so much to rank countries but rather to ask whether the different measures of poverty tell a consistent story. By and large, countries with lower mean levels of per capita expenditure (or income) have higher headcount poverty rates, and also have higher poverty gaps, poverty severity, and Watts indexes. The exceptions are interesting: Haiti has an unexpectedly high level of poverty as measured by the headcount rate, and South Africa has an unusually high amount of poverty as measured by the poverty severity index; these are a consequence of the very high levels of inequality in those countries. In passing, we might note that the Watts index tracks P2 more closely than it tracks the headcount poverty rate.
Time Taken to Exit
78
Most poverty profiles for Cambodia, and indeed for most countries, rely on the three basic classes of FGT poverty statistics discussed above. But when thinking about poverty reduction strategies, it may be useful to show how long it would take, at different potential economic growth rates, for the average poor person to exit poverty. A poverty statistic with this property was derived by Morduch (1998); the statistic is
CHAPTER 4: Measures of Poverty
4
decomposable by population subgroups and is also sensitive to the distribution of expenditure (or income) among the poor. For the jth person below the poverty line, the expected time to exit poverty (that is, to reach the poverty line), if consumption per capita grows at positive rate g per year, is (4.13) Thus, the time taken to exit is the same as the Watts index divided by the expected growth rate of income (or expenditure) of the poor. What effect can economic growth have on the elimination of poverty? Figure 4.2 shows the average time it would take to raise the consumption level of a poor person in Cambodia to the poverty line, for various hypothetical growth rates. It is assumed that this growth rate is continuous, is in real terms, and is distributionally neutral among the poor. If the economic growth rate enjoyed by the poor were only 1 percent per year, it would take over 20 years for the average poor person to exit poverty. But at a growth rate of 4 percent per year it would take less than six years for the average poor person to exit poverty. Hence, economic growth that acts to raise the real consumption levels of the poor can have a powerful effect on the elimination of poverty. Despite the potency of economic growth, it will generally take more than just growth to rapidly improve the lives of the very poor. The expected time to exit poverty for those people who are so poor that they are below the food poverty line in Cambodia—that is, they cannot afford enough food, even if they were to devote all their consumption spending to food—is more than 15 years, even at a 3 percent
Figure 4.2 Average Exit Time from Poverty
Source: Authors, based on Morduch (1998).
79
Haughton and Khandker
4
continuous annual growth rate. Thus, targeted programs are likely to be needed to deliver benefits to the poor, for instance, in the form of improvements in their human and physical assets or through interventions (for example, infrastructure and markets) that improve the returns they get from those assets.
Other Measures There are other additive poverty measures that are distribution-sensitive. Following Atkinson (1987), one can characterize a general class of additive measures, encompassing the Watts index, the FGT class of measures, and some other measures (such as the second measure proposed by Clark, Hemming, and Ulph [1981]), as taking the following form: (4.14) where p(z, yi) is the individual poverty measure, taking the value zero for the nonpoor (yi > z) and some positive number for the poor, the value of which is a function of both the poverty line and the individual living standard, nondecreasing in the former and nonincreasing in the latter. Given the wide variety of aggregate measures of poverty that are available, which ones should be used? We turn to this question in chapter 5.
Review Questions 5. An important strength of the Sen-Shorrocks-Thon index of poverty is that it allows one to decompose changes in poverty into changes in the headcount index, changes in the poverty gap index (for the poor), and changes in the distribution of the poverty gap.
° °
True False
6. The Watts index of poverty is
° ° ° ° 80
A. Computed by dividing the poverty line by income for all individuals and taking the average of the log of this ratio over the sample. B. Computed by dividing the poverty line by income for all individuals below the poverty line and taking the average of the log of this ratio over the sample. C. Computed by dividing the poverty line by income for all individuals and taking the log of the average of this ratio over the sample. D. Computed by dividing the poverty line by income for all individuals below the poverty line and taking the log of the average of this ratio over the sample.
CHAPTER 4: Measures of Poverty
4
7. It can be shown that the average time taken to exit from poverty (t) is given by W/g, where W is the Watts index and g is
° ° ° °
A. The size of the sample (that is, the number of households surveyed). B. The average age of individuals in the sample. C. The growth rate of real income (or consumption) per capita per year. D. The percentage of households that are poor.
References Atkinson, Anthony. 1987. “On the Measurement of Poverty.” Econometrica 55: 749–64. Clark, Stephen, Richard Hemming, and David Ulph. 1981. “On Indices for the Measurement of Poverty.” Economic Journal 91 (361): 515–26. Coudouel, A., J. S. Hentschel, and Q. D. Wodon. 2002. “Poverty Measurement and Analysis.” In A Sourcebook for Poverty Reduction Strategies, ed. J. Klugman, 29–69. Washington, DC: World Bank. Dalton, Hugh. 1920. “The Measurement of the Inequality of Incomes.” Economic Journal 30: 384–61. Deaton, Angus. 1997. The Analysis of Household Surveys: A Microeconometric Approach to Development Policy. Baltimore, MD: Johns Hopkins University Press for the World Bank. Foster, James, J. Greer, and Eric Thorbecke. 1984. “A Class of Decomposable Poverty Measures.” Econometrica 52 (3): 761–65. Morduch, Jonathan. 1998. “Poverty, Economic Growth, and Average Exit Time.” Economics Letters 59: 385–90. Osberg, Lars, and Kuan Xu. 1999. “Poverty Intensity: How Well Do Canadian Provinces Compare?” Canadian Public Policy—Analyse de Politiques 25 (2):179–95. Ravallion, Martin. 1996. “How Well Can Method Substitute for Data? Five Experiments in Poverty Analysis.” The World Bank Research Observer 11 (2): 199–221. Ravallion, Martin, and Shaohua Chen. 2001. “Measuring Pro-Poor Growth.” Policy Research Working Paper No. 2666, World Bank, Washington, DC. Sen, Amartya K. 1976. “Poverty: An Ordinal Approach to Measurement.” Econometrica 44 (2): 219–31. Xu, Kuan, and Lars Osberg. 2002. “On Sen’s Approach to Poverty Measures and Recent Developments.” Working Paper, Department of Economics, Dalhousie University, Halifax, Nova Scotia. Zheng, B. 1993. “An Axiomatic Characterization of the Watts Poverty Index.” Economics Letters 42 (1): 81–6.
81