MATT Final Design Report University of San Diego Electrical Engineering Senior Project ELEC 492 Fall 2004 December 3, 2004
Instructors: Dr. Kramer & Dr. Pateros Also Prepared For: Don Reed, Director of Communications & Navigation (SAIC)
Prepared By: Erin Fullinwider Joey Church
ELEC 492 Fall 2004
MATT
Fullinwider Church
Table of Contents List of Figures and Tables: ............................................................................................................................................2 Introduction: ..................................................................................................................................................................3 Problem Summary: ........................................................................................................................................................3 Background Summary: ..................................................................................................................................................4 Technical Survey: ..........................................................................................................................................................4 Project Description: .......................................................................................................................................................5 Operational System vs Mock-Up System: ................................................................................................................5 Specifications:...........................................................................................................................................................8 FPGA System I/O : ...................................................................................................................................................9 Theory of Operation: ..............................................................................................................................................10 QPSK Modulation..............................................................................................................................................10 QPSK Demodulation..........................................................................................................................................11 Phase Correlator.................................................................................................................................................13 Code Correlator..................................................................................................................................................14 Transmitter:.............................................................................................................................................................18 Carrier Phase Generator: ....................................................................................................................................18 Code Clock: .......................................................................................................................................................19 CDMA Sequence Generator and Spread Spectrum Modulator:.........................................................................20 QPSK Modulator: ..............................................................................................................................................22 PCI to Local Bus & C/C++ Interface Control Software: ...................................................................................22 Receiver: .................................................................................................................................................................24 Receiver Signal Acquisition:..............................................................................................................................24 QPSK Demodulation DS despreading: ..............................................................................................................25 Data Error Checker: ...........................................................................................................................................25 Code Correlator:.................................................................................................................................................25 Phase Correlator:................................................................................................................................................27 PCI to Local Bus & C/C++ Interface Control Software: ...................................................................................29 Eight-Channel Receiver: ....................................................................................................................................29 Hardware Description:.................................................................................................................................................29 Alpha Data ADM-XRC-II board: ...........................................................................................................................29 AD9772A DAC Evaluation Board: ........................................................................................................................30 AD9432 ADC Evaluation Board: ...........................................................................................................................31 Integration of Modules and Test Plan:.........................................................................................................................32 System Performance:...................................................................................................................................................33 System Simulation in Matlab:.................................................................................................................................33 Project Deliverables:....................................................................................................................................................34 Project Constraints and Risks: .....................................................................................................................................34 Design Schedule: .........................................................................................................................................................35 Budget: ........................................................................................................................................................................36 Alternate Design Ideas: ...............................................................................................................................................36 QPSK Modulator: ...................................................................................................................................................36 Sine / Cosine Look-up-Table:.................................................................................................................................37 Phase Correlator:.....................................................................................................................................................37 C Control Interface: ................................................................................................................................................37 Signal Demodulation: .............................................................................................................................................38 Suggested Future Alterations:......................................................................................................................................39 Personnel: ....................................................................................................................................................................40 References: ..................................................................................................................................................................41 Appendix A: Glossary of Acronyms ...........................................................................................................................42 Appendix B – PCI User Interface System Set-Up Equations ......................................................................................43 Appendix C – MATT.m Matlab File ...........................................................................................................................44 Appendix D – Personnel Resumes ..............................................................................................................................50
1
ELEC 492 Fall 2004
MATT
Fullinwider Church
List of Figures and Tables: Figure 1: The Operational System ...........................................................................................................5 Figure 2: Mock-up System (Virtex-II FPGAs are located inside the computer) .................................................6 Figure 3: Overall System Block Diagram ..................................................................................................7 Table 1: QPSK Modulated Signal - I + Q ................................................................................................10 Figure 4: I-channel sequence ................................................................................................................10 Figure 5: Q-channel sequence ...............................................................................................................11 Figure 6: QPSK Modulated signal .........................................................................................................11 Figure 7: QPSK signal multiplied by cosine and sine waves .......................................................................12 Figure 8: Accumulated signals ..............................................................................................................12 Figure 9: Input signal and the generated signal used for correlation with a slight phase offset. ...........................13 Figure 10: Input signal and fully correlated generated signal, phase match. ....................................................14 Figure 11: The signals used code correlation. The code is not matched in this figure. ......................................15 Figure 12: Xnor of received Qcode and time shifted sequences. ..................................................................16 Figure 13: Code Correlation of matched code sequences. ...........................................................................17 Figure 14: Transmitter Block Diagram ...................................................................................................18 Figure 15: Phase Generator ..................................................................................................................19 Figure 16: Code Clock Generator ..........................................................................................................19 Figure 17: CDMA sequence generator block diagram................................................................................20 Figure 18: CDMA sequence generator....................................................................................................21 Table 2: CDMA Coding and Decoding ...................................................................................................21 Table 3: Composite L5 Transmitted Signal Phase (Default Values) ..............................................................22 Table 4: Phase Shift Block RAM...........................................................................................................22 Figure 19: Graphical User Interface .......................................................................................................23 Figure 20: Receiver Block Diagram .......................................................................................................24 Figure 21: Code Correlator block diagram ..............................................................................................26 Figure 22: Phase Correlator block diagram ..............................................................................................28 Figure 23: Picture of ADM-XRC-II PCM ...............................................................................................29 Figure 24: ADM-XRC-II PCM card schematic ........................................................................................30 Figure 25: AD9772A Evaluation Board wiring schematic ..........................................................................31 Figure 26: AD9432 evaluation board wiring schematic. .............................................................................31 Figure 27: ModelSim Simulation of the Transmitter. .................................................................................32 Figure 28: MATT.m simulation of Gaussian noise. ...................................................................................33 Figure 29: Project Schedule..................................................................................................................35 Figure 30: Original C Interface. ............................................................................................................38
2
ELEC 492 Fall 2004
MATT
Fullinwider Church
Introduction:
The United States Naval Observatory Master Clock, located in Washington DC, is responsible for the keeping and transferring of time data for the United States. The Master Clock transfers the “master” time to eight remote substations located in undisclosed areas of the United States. Today, the transferring between the master clock and the remote substations is done one by one via satellite. At this time the master clock and each of the eight remote substations have one transmitter and one receiver. Since time is transferred to each remote substation one by one, there is a slight inaccuracy of time at each station. This error, on the order of nanoseconds, is an error that can become burdensome in such things as 911 calls and naval applications. In our project, Modem Addressing Time Transfer (MATT), we will synchronize the time transferring event so the master clock transfers the time to all eight remote substations simultaneously. To do so, the master clock will need one transmitter and an eight channel receiver, while the eight remote substations will continue to have one transmitter and one receiver. For our purpose MATT will not be used with a satellite; however, if SAIC wishes they will be able to make minor changes to our design allowing them to use MATT with a satellite network. SAIC provided us with some sample specifications, but ultimately they want a design that is flexible and can altered quite easily.
Problem Summary:
The task at hand was to design a modem (modulator/demodulator) capable of transmitting and receiving data. The transmitter system is responsible for modulating the data and sending it out and the receiver is responsible for demodulating and recovering the transmitted data. The modulation schemes are based on GPS technology. The system is also designed for complete future flexibility; such as altering transmission rates and bit resolutions can be accomplished with minimum effort.
3
ELEC 492 Fall 2004
MATT
Fullinwider Church
Background Summary:
Time Keeping Background The first monitoring of time was done with the sundial. As time progressed so did the way time was monitored. Time is now monitored, tracked, and transmitted by the US Naval Observatory. The US Naval Observatory is responsible for the most accurate atomic clock system, the Master Clock. Accurate time information is essential in many aspects of military operations, navigation systems, and communications and intelligence fields. To transfer time the most precisely and accurately the US Naval Observatory uses two-way satellite time transfer (TWSTT) between the master clock and 8 remote clocks around the US. The master clock and the 8 remote clocks each consist of one transmitter and one receiver. Twoway satellite time transfer allows an imprecision of less than 0.2 nanoseconds and an inaccuracy of about 1.0 nanosecond. This imprecision and inaccuracy may be the result of the single channel receiver at the master clock. Market Background SAIC has identified a small market for this type of technology, specifically in the government and defense sectors. Incidentally, SAIC plans on selling 10 units. These 10 units include the 8 substations, 1 main base station, and 1 spare. Technical Survey:
Our project will require the following software for design and simulation: Xilinx ISE 6.3i for VHDL code and project navigation XST or Synplicity for synthesis Aldec and ModelSim for simulation C software for PCI interface The above software tools were accessible to us through SAIC and the University of San Diego’s engineering department. All team members have had experience with Xilinx, XST, C software, MatLab, and ModelSim. Our project required the following hardware for design: Virtex II FPGA Board – (ADM-XRC-II) Analog Devices AD9772A Evaluation Board (14-bit DAC) Analog Devices AD9432 Evaluation Board (12-bit ADC) Micro-coax cables Computer The above equipment was accessible to us through SAIC, where some of our lab work was completed. As a way to test the performance of the system, our project required the use of an oscilloscope and logic analyzer.
4
ELEC 492 Fall 2004
MATT
Fullinwider Church
Project Description:
Operational System vs Mock-Up System: In the operational system, Figure 1, data is transmitted from a base station to eight separate substations. These eight remote substations can then transmit data back to the base station. This requires there to be an eight-channel receiver at the base station.
Figure 1: The Operational System
In the system developed and built (the mock-up system, Figure 2), the transmission over the satellite network was omitted. For the transmitter, data from a computer was modulated using a FPGA and transmitted through a micro coaxial cable to a DAC. The receiver sent this signal into an ADC and then to a coaxial cable back into the computer in which the FPGA demodulated the signal and saved the data. The digital output and input is a 8-bit vector. In an operational system, the coaxial cable from the DAC would connect to a system that would bump up the specified 5.115 MHz IF signal to the satellite signal frequency, which is in the range of GHz. The satellite network may possibly be GPS satellites or some other network. The signal would then be transmitted over the satellites and received by a system that steps down the signal back to the 5.115 MHz IF signal, which runs into the ADC.
5
ELEC 492 Fall 2004
MATT
Fullinwider Church
Figure 2: Mock-up System (Virtex-II FPGAs are located inside the computer)
Figure 3, shows the overall high-level system block diagram. Before transmission or reception could occur, certain control registers had to be initialized. Some examples of these control registers include such things that set-up carrier frequency, CDMA code sequences, and data channel enables. The registers, constants, and data was written directly to the FPGA from the PCI interface. Data was buffered in registers, and transmitted at a symbol rate of 250bps. The data was then modulated with the CDMA code sequences, which are at a rate of 1.023Mbps. The value of the data then relates to a certain phase shift in the carrier wave. The digital carrier wave, with QPSK modulation, was converted from a 8bit digital word, to an analog signal. The analog signal was transmitted via a coaxial cable to an ADC, which was converted back into a 8bit digital word. The receiver then used a correlator to match the phase of the carrier signal, and multiplied a matched carrier signal with that of the modulated one to obtain the Spread Spectrum modulated signal. The I-signal was then XOR’d with a matched CDMA I-sequence to obtain the original data. The data was then read from the FPGA and stored in a file on the computer, via the PCI interface. For a simultaneous multiple channel receiver, there would need to be basically multiple receivers instantiated in the FPGA, each with different CDMA sequences and phase correlations (this is not shown in Figure 3).
6
ELEC 492 Fall 2004
MATT
Fullinwider Church
Figure 3: Overall System Block Diagram
7
ELEC 492 Fall 2004
MATT
Fullinwider Church
Specifications: The system was designed to handle various specifications. However these are the specifications used in the demonstration. Inputs/Outputs: -PCI-to-local bus through PMC card slot -Coaxial Cable from FPGA to DAC or from ADC Clocks: - 100MHz FPGA internal clock - 1.023MHz center nominal code clock Transmitter signal: - Independent I & Q Channels & independent control - 8-bit Digital QPSK modulation with DS spread spectrum - 1.023MHz CDMA sequence - 5.115 MHz Center Frequency Nominal - 250 Hz symbol rate / 125 BPS data rate. - Passed through DAC and transmitted over micro-coaxial cable Receiver Signal: - 8-Channels (16 separate I & Q channels) - Received in through an ADC from micro coax cable - Input: 8-bit Digital word signal - QPSK demodulation with DS spread spectrum decoder - 5.115 MHz Center Frequency Nominal - 1.023 MHz CDMA sequence - Independent I & Q and channel control Data Type: - 250 Hz symbol rate / 125 BPS data rate. - Separate I & Q data channels DDS: - Produces sine and cosine waves - 5.115 MHz Center Freq Nominal - Takes into account Doppler shift CDMA Sequence: - Generated via three LFSRs, using L5 encoding - Generates separate 1-bit digital streams for I & Q channels - Data rate will be 1.023 MHz
8
ELEC 492 Fall 2004
MATT
Fullinwider Church
FPGA System I/O : Transmitter: Inputs: o Clock (1bit) o Reset (1 bit) o Load (1 bit) o System Enable (1 bit) o Data Transmission Enable (1 bit) o I data (1 bit) o Doppler Shift Value (16 bits) o Carrier Phase ∆Frequency (16 bits) o Code Clock ∆Frequency (16 bits) o XBI: (13 bits) o XBQ: (13 bits) Outputs: o Modulated Signal Out (8 bits) o Clock out for DAC (1 bit) Receiver: Inputs: o Clock (1bit) o Reset (1 bit) o Load (1 bit) o System Enable (1 bit) o Data Rate (16 bits) o Doppler Shift Value (16 bits) o Carrier Phase ∆Frequency (16 bits) o Code Clock ∆Frequency (16 bits) o XBI: (13 bits) o XBQ: (13 bits) o I Demodulation Threshold (16 bits) o Q Demodulation Threshold (16 bits) o Phase Correlation Threshold (16 bits) o Accumulator Period (8 bits) o Code Correlator Period (12 bits) o Modulated Signal In (8 bits) Outputs: o Data received (1 bit) o System Ready (1 bit) o Clock out for ADC (1 bit)
9
ELEC 492 Fall 2004
MATT
Fullinwider Church
Theory of Operation: QPSK Modulation For the Quadrature Phase Shift Key modulation scheme, two bits of data can be sent simultaneously. In our design, one channel is used to send data, and the other solely contains information about the CDMA code. The I-channel, short for ‘in-phase,’ is made up of ± cos(ω); meanwhile the Q-channel, short for ‘Quadrature-phase,’ is made up of ± sin(ω). If the I-bit is ‘0’, then the I-channel transmits +cos(ω), and if the I-bit is ‘1’, then the I-channel transmits –cos(ω). Likewise, if the Q-bit is ‘0’, then the Q-channel transmits +sin(ω), and if the Q-bit is ‘1’, then the Q-channel transmits – sin(ω). The QPSK modulated signal then is made up by adding the I-channel with the Q-channel as seen in Table 1. Table 1: QPSK Modulated Signal - I + Q
I Q
I+Q
0
0
cos(ω t ) + sin(ω t)
0
1
cos(ω t ) - sin(ω t)
1
0
-cos(ω t ) + sin(ω t)
1
1
-cos(ω t ) - sin(ω t)
I+Q: cos(ω t + α ) 7 π 4 1 2 cos( ω t + π 4 5 2 cos( ω t + π 4 3 2 cos( ω t + π 4
2 cos( ω t +
) )
) )
So, if we are transmitting an I-sequence of 0..0..1..1, then the I-channel would look like:
Figure 4: I-channel sequence
Where, the black vertical lines represent the rising edges of the code clock (moments at which I&Q change). As you can see from Figure 4, the phase shifts by 180 º when the I sequence changes from ‘0’ to ‘1.’ The cosine term has a DC value of one added to it, because in our VHDL code we are working with unsigned positive binary numbers. Likewise, if we transmit a Q-sequence of 0..1..0..1 simultaneously with I, the Q-channel would look like:
10
ELEC 492 Fall 2004
MATT
Fullinwider Church
Figure 5: Q-channel sequence
Again we add a DC value of one to the sine term. In this example, the code clock is a multiple of 2π, thus it is easy to look at the I&Q modulated sequences and deduce the I&Q values based upon the phase. The QPSK modulated signal comes from adding the I-channel to that of the Qchannel as in Figure 6.
Figure 6: QPSK Modulated signal
QPSK Demodulation The QPSK modulated signal is generated in the transmitter and is the input to the receiver; however there can be phase and amplitude shifts during transmission thus slightly altering the signal input to the receiver. The receiver is able to accommodate for the phase shift by the use of a phase correlator, discussed later. But for now, we assume that the phase of QPSK input signal to the receiver matches that of a pure sine and cosine wave generated in the receiver at the carrier frequency. The first step to demodulating the QPSK signal is to multiply the signal by cos(ω t) and sin(ω t). Doing this causes the phase-shifted signal to look more like an amplitude- shifted signal, as seen in Figure 7. The term multiplied by cosine contains the I-data, and the term multiplied by sine contains the Q-data.
11
ELEC 492 Fall 2004
MATT
Fullinwider Church
Figure 7: QPSK signal multiplied by cosine and sine waves
To get the original I&Q data out of these two new signals we created, we accumulate the sequences for an accumulator period (with duration somewhere between the carrier and code periods) and make a decision based on a threshold value. The accumulate process is similar to that of an integrator. Figure 8 shows the signals accumulated for each code clock period. On the rising edge of the code clock we make a decision whether the data is zero or one by comparing the accumulated sum to a threshold value. The threshold value must be cleverly chosen to reflect the amplitude of the input signal, in this example it was set at 3500, which is approximately halfway between the high peak and low peak. As you can see, if the accumulated sum is greater than the threshold it corresponds to a ‘0’, and if the sum is less than the threshold, it corresponds to a ‘1’.
Figure 8: Accumulated signals
12
ELEC 492 Fall 2004
MATT
Fullinwider Church
So, from using logic, we are able to obtain the I-sequence of 0..0..1..1, and the Q-sequence of 0..1..0..1. But since the threshold decision is made at the end of the accumulate process (which in this example was for 1 code clock period); the received data is delayed by one code clock cycle. Phase Correlator For the demodulation process to work correctly, the phase of the sine and cosine terms used to demodulate the signal must be in sync with that of the phase of the input signal. Thus we need the following signals to be in sync, with matching phases θ: QPSK input = 2 cos( θ + β ) , where β is a discrete value corresponding to I&Q Cosine = cos( θ ) Sine = cos( θ + 3π/2 ) The correlation process basically has two steps; the first is to check if the generated phase matches that of the input phase, and the second step is to shift the generated phase until it does match. In this process we must assume that the frequencies of the input match that of the generated signal, which is a valid assumption since frequency shifts should be accounted for by the Doppler register in the phase generator. Since the input signal is a quadrature-phase shifted signal, it is easiest to create a signal with phase shifts that match that of the input signal to use when correlating. Thus depending on the I&Q values (which must also be correlated), we shift the generated phase of a cosine wave appropriately as in Table 1. So in our example we are receiving a sequence of IQ equal to 00..01..10..11. Figure 9 shows the input signal and the generated signal, which will be used to correlate the phase. Notice that before the phase is correlated there will be a slight phase mismatch.
Figure 9: Input signal and the generated signal used for correlation with a slight phase offset.
To correlate the signal, again we take advantage of the multiply and accumulate process. We multiply the input signal by the generated signal and accumulate it over a certain period of time. The multiplication of the two terms will be greatest when the phase of the two signals match. At the end of the accumulation period, we have what we call our correlation number. If the correlation number is greater than a threshold, we know that the signal is phase correlated. If the correlation number falls short of the threshold, then we slightly shift the phase of the generated signal and run through the accumulation process until the phase does match. The amplitude difference between the input signal and the generated signal will play a role in setting an 13
ELEC 492 Fall 2004
MATT
Fullinwider Church
appropriate threshold value. Figure 10 shows the case when the phase is matched, or fully correlated.
Figure 10: Input signal and fully correlated generated signal, phase match.
Since phase is circular and repeats itself, we don’t have too far to shift to get in phase. The direction to shift the phase is determined by also multiplying the signal by the sine-shifted signal and accumulating. Thus: o If the Cosine Correlation number is greater than the threshold, the phases are correlated and no phase shift is necessary. o Otherwise we compare the Cosine Correlation number to the Sine Correlation number. o If the Cosine Correlation number is greater we need to subtract phase. o If the Sine Correlation number is greater we need to add phase. Code Correlator The generated I&Q codes need to be correlated, and match that of the I&Q codes received. The I&Q codes are used in the phase correlation process, the I-code is needed to obtain the data, and the code clock is needed to demodulate the signal. When we correlate the code sequences, we are shifting the code clock until the signal codes generated match that of the ones received. We only correlate to the Q-code sequence, since the Q-channel is transmitted dataless it is not encrypted with data; however, we only need to correlate one of the sequences to provide a code clock match (the I-sequence will also be correlated when Q is correlated since they share the same code clock). The code correlator process is similar to that of the phase correlator, but it is easier since the sequences are only one bit. We must first generate three time-shifted code sequences. One sequence is used to correlate the code (the prompt sequence), and the other two provide information of the direction to shift (early and late sequences). Since the received code sequences are delayed by one accumulator period, the prompt generated Q sequence must also be delayed by one accumulator period. The early sequence is delayed slightly less than one code clock period, while the late sequence is delayed slightly longer. If Td is equivalent to the delay of one accumulator period, then the three generated signals are: Qearly Qprompt Qlate
= Qgen x (Td – α) = Qgen x (Td) = Qgen x (Td + α) 14
ELEC 492 Fall 2004
MATT
Fullinwider Church
Where α represents the amount of shift between the early and prompt, or late and prompt sequences. Figure 11 shows the generated Q code, the time shifted early, prompt, and late codes, and received code. The generated Q code is 101100… The prompt code is delayed by exactly one code clock period, while the early code is delayed slightly less and the late code is delayed slightly more. The received code occurs after the prompt code but before the late code.
Figure 11: The signals used code correlation. The code is not matched in this figure.
To correlate the code sequence, we first exclusively-nor the received sequence with the early, late, and prompt sequences. What this does is output a ‘1’ if the two sequences match at that moment, and output a ‘0’ if they mismatch. Figure 12 shows the exclusive-nor of the early, prompt, and late sequences with the received sequence. As you can see from Figure 12, Pcorr has the least zeros, however for the code to be correlated we expect Pcorr to be a constant ‘1.’ It is also visible that Lcorr matches more than Ecorr.
15
ELEC 492 Fall 2004
MATT
Fullinwider Church
Figure 12: Xnor of received Qcode and time shifted sequences.
To get a correlation number, we accumulate the three exclusively-nored sequences for a specified period of time. The prompt correlation number is then compared to the threshold, which is the number of clock cycles that we accumulated for. If the prompt correlation number does not match the threshold, then the code is mismatched and we compare the early and late correlation numbers to half the threshold value. If the early and late correlation numbers are less then ½ the threshold then we are most likely more than one code chip off of being correlated thus we will shift by one code chip. The direction of the shift doesn’t matter as long as it is consistent, since the code sequences will repeat every 1023 code chips (1ms). Otherwise if we are within one code chip we then compare the late correlation number to that of the early correlation number. Whichever correlation number is higher indicates in what direction to shift the generated signals. The generated code signals are shifted by shifting the code clock. In this example, the x-axis is in terms of clock cycles, thus if we accumulate for 775 clock cycles, the prompt correlation number should be very close to 775 if the codes are matched. The correlation numbers in this example are as follows: Early correlation Number = 635 Prompt correlation Number = 735 Late correlation Number = 715 The prompt correlation number does not meet the threshold, thus we compare the late and early correlation numbers. Since the late correlation number is greater than the early correlation number, the code clock will be shifted accordingly and the generated I&Q signals will occur slightly later. The xnor, compare, and shift processes are repeated until the prompt code matches the received code. Figure 13 shows the case when the received Q code sequence matches that of Qprompt.
16
ELEC 492 Fall 2004
MATT
Fullinwider Church
Figure 13: Code Correlation of matched code sequences.
17
ELEC 492 Fall 2004
MATT
Fullinwider Church
Transmitter: The transmitter block diagram in Figure 14, was implemented digitally in VHDL. It outputs a 8bit parallel data stream containing the QPSK modulated signal with direct-sequence code spreading. The digital output was then converted to an analog signal through the use of an external DAC.
Figure 14: Transmitter Block Diagram
Carrier Phase Generator: The Carrier Phase was generated through a technique of Direct Digital Synthesis (DDS) as in Figure 15. It generates phase values (0º to 360º) that repeat at a frequency of 5.115 MHz. It has two 16-bit accumulators, one which contains Doppler information (acceleration) and one that contains phase information (velocity). The carrier phase generator has two control registers: Doppler_Increment and Phase_Increment.
18
ELEC 492 Fall 2004
MATT
Fullinwider Church
Figure 15: Phase Generator
The Doppler accumulator generates values that simulate ionspheric acceleration. In cases in which there is no Doppler effect, the Doppler increment is set to zero. The output frequency depends on the clock frequency, accumulator width and phase increment. f out 2 Nbits ∆θ = (Equation 1) f clk Thus, if we use 16-bit accumulators and a clock frequency of 100MHz, the required value for the phase increment (∆θ) as shown in Equation 1 is “0D18”H to produce a 5.115 MHz signal. Code Clock: The Code Clock generates the clock input for the CDMA code generator. The center nominal frequency of the code clock is 1.023 MHz. The Code Clock was generated in a DDS-type fashion, Figure 16, such that the transmitter can simulate ionspheric acceleration and the receiver can acknowledge this ionspheric acceleration. The most significant bit (MSB) from the phase accumulator is the code clock pulse. Thus, from Equation 1, if we use 16-bit accumulators and a clock frequency of 100 MHz, the required value for the phase increment (∆θ) is “029E”H to produce a 1.023 MHz signal.
Figure 16: Code Clock Generator
19
ELEC 492 Fall 2004
MATT
Fullinwider Church
CDMA Sequence Generator and Spread Spectrum Modulator: Direct Sequence (DS) spread spectrum was used to multiplex the data channels. A different pseudo-random number (PN) sequence was used for each data channel, which is referred to as Code Division Multiple Access (CDMA). Each transmitter has two data channels (I&Q), so if there are nine transmitters there must be 18 CDMA code sequences. The CDMA sequence bit rate is that of the code clock, which is 1.023 MHz.
Figure 17: CDMA sequence generator block diagram
The CDMA sequences were obtained by three linear feedback shift registers (LFSRs): one common, one for the I-channel, and one for the Q-channel. Figure 18, shows a detailed block diagram of the CDMA sequence generator (Provided by SAIC). There is parallel loading of the initial states of the registers. Each tapped bit is exclusively-or’d together and the result is shifted back into the register. The system can synchronously or asynchronously reset itself. The output from the common register is exclusively-or’d with the output of the XBI register to create the XI sequence. Likewise the XQ sequence was created. The generated code sequences are psuedorandom. Every 1ms they will reset and repeat the code sequence which consists of 1023 code chips.
20
ELEC 492 Fall 2004
MATT
Fullinwider Church
Figure 18: CDMA sequence generator
The I&Q CDMA sequences are XOR’d with their corresponding input data streams, to create the two DS sequences. When receiving the data, as seen in Table 2, the data can be obtained by XOR’ing the DS sequence with the CDMA sequence. Each DS sequence is a one-bit data stream, which makes up a 2-bit control word for the phase shifter. Each data channel also has an enable, for turning on and off data transmission. However, in our design all the data is sent via the I-channel, and the Q-channel is dataless and only sends the CDMA code sequence. Table 2: CDMA Coding and Decoding
Transmitter DS sequence Data PN ‘Data XOR PN’ 0 0 0 0 1 1 1 0 1 1 1 0
Receiver Data DS sequence PN ‘DS XOR PN’ 0 0 0 1 1 0 1 0 1 0 1 1
21
ELEC 492 Fall 2004
MATT
Fullinwider Church
QPSK Modulator: The Quadrature Phase Shift Key (QPSK) Modulator is capable of transmitting two bits of information simultaneously. One bit of information is sent over the In-phase channel (Ichannel), and the other bit is sent over the Quadrature-phase channel (Q-channel). There are four distinct phases then associated with QPSK; 0º, 90º, 180º, and 270º. Table 2 shows the mapping of the phase shift with the corresponding digital input. Phase shifts are relative to current phase values. Table 3: Composite L5 Transmitted Signal Phase (Default Values) I5 0 1 0 1
Q5 0 0 1 1
Nominal Phase Shift 0 -90 +90º 180º
The transmitter utilizes one block of 4x16 block RAM for phase shift seen in Figure 14. The input to the block RAM is the two bits of I&Q information, which corresponds to certain addresses in the RAM. The output from the block RAM is a 16-bit phase shift word corresponding to the I and Q inputs. Table 4 shows what memory is accessed in each block RAM, in hexadecimal, for the four possible I&Q inputs. The RAM has been initialized by using the RAMB4_S16 component in Xilinx Table 4: Phase Shift Block RAM I 0 0 1 1
Q 0 1 0 1
Phase Shift Phase (degrees) 0 90 270 180
RAM 0000 3FFF BFFF 7FFF
The output from the phase shift block RAM is added to the output of the phase accumulator and the sum is the input to the Sine/Cosine Look-Up-Table. The Sine/Cosine Look-Up-Table has a cosine digital wave output and a sine digital wave output. . PCI to Local Bus & C/C++ Interface Control Software: The FPGA used in our design is attached to the PCI bus through a PCI Mezzanine Card (32-bit at 33 MHz). All C/C++ code was implemented in Microsoft Visual Studio 6.0 and is used to initialize the transmitter. The user will be able to access the C/C++ code through a graphical user interface, as shown in Figure 19. In step 1 of the GUI the user is asked to input information for the transmitter. Values for the FPGA clock frequency, carrier output frequency, code output frequency, accumulator width, transmitter speed and receiver speed have the default values as shown; however, if the user desires to change these values he/she will be able to do so. The default values were chosen according to the specifications given. If the specifications were to 22
ELEC 492 Fall 2004
MATT
Fullinwider Church
change, the user will be able to enter the new specified values. However, if the default value for the accumulator width is changed in C/C++ it will also need to be changed in the VHDL code. If this were the case a WARNING box will appear in C\C++ to let the user know he/she must change the VHDL before loading the FPGA board. Once all the information asked for is provided, the Calculate button in step 2 calculates the phase increments and Doppler shift, see the equations used to do so in Appendix B. Step 3 interfaces the C/C++ code with the FPGA board. This is where the phase increments, Doppler shift, and satellite information are written as register values to memory-chips on the ADM-XRC-II PCM card through the PCI bus. These values are then buffered until synchronously read and updated by the FPGA.
Figure 19: Graphical User Interface
23
ELEC 492 Fall 2004
MATT
Fullinwider Church
Receiver: The receiver takes an analog input, and passes it through an ADC to provide a 8-bit parallel digital data stream containing the QPSK modulated signal with Direct-Sequence code spreading. The demodulation is implemented digitally in VHDL. The substations only require a onechannel receiver; however the base station requires an eight-channel receiver. The receiver is responsible for demodulating the QPSK signal, despreading the DS sequences, and detecting and saving the received data. Figure 20 shows a high-level block diagram of the receiver. Note that for the eight-channel receiver at the base station, the receiver logic must be instantiated eight times.
Figure 20: Receiver Block Diagram
Receiver Signal Acquisition: Signal acquisition is not something we needed to address in our mock-up system (because it does not include transmission over a satellite network). But it is briefly discussed here because it is something that would need to be done if the operational system were implemented. Before the QPSK signal can be processed into the ADC, the signal must first be conditioned. The receiver antenna must first be able to capture the desired signal (based on the code channel), which generally only carries 10-16 watts. The noise is generally 600 to 4000 times stronger than the signal, so an array of bandpass filters and low-noise amplifiers must be used to obtain a usable signal. 24
ELEC 492 Fall 2004
MATT
Fullinwider Church
Next the signal must be down-converted in frequency. For example, if using the GPS L1 carrier frequency of 1.57542 GHz, the frequency needs to be converted to an IF frequency of 5.115 MHz for the FPGA to effectively process the signal. The frequency down-conversion can be accomplished by multiplying the input signal by a cosine wave of frequency (L1-IF). This creates two bandwidth images centered at fIF and f2L1-IF. Afterwards this signal is passed through a bandpass filter centered about our fIF of 5.115 MHz, to obtain the signal at a lower carrier frequency and with less bandwidth. This frequency down-conversion does not affect the code chip frequency, which will remain constant throughout this process. Finally the signal must be amplified and given a DC offset that will be suitable for the ADC to process. QPSK Demodulation DS despreading: To demodulate the 14 bit phase shifted signal, and obtain 1 bit I&Q sequences, we used a process of multiply, accumulate, and compare. To obtain the I-sequence, we multiplied the input signal with a pure cosine wave, accumulated for one accumulator period, and compared the accumulated value to a threshold value at the end of the accumulate period. If the accumulated value was greater than the threshold we received a ‘0’, and if it was less then the threshold then we received a ‘1’. Similarly the Q-sequence was obtained; the only difference is that we multiplied by a pure sine wave. Since the decision of what value was received is made at the end of the accumulator period, the received I&Q sequences are delayed by one accumulator period. To obtain the transmitted data (despread the code sequence), which is sent via the I-channel, the I-sequence received was XOR’d with the generated I-sequence, delayed by one accumulator period. Thus the received data was also delayed by one accumulator period (which is taken account for when considering the transmission time of the data). The demodulation process required that the frequency and phase of input carrier wave matched that of the cosine and sine waves generated, and the phase and frequency of the generated code clock matched the received code transitions. This requires the use of a phase correlator to ensure that the generated sine and cosine waves are in phase and at the proper frequency. A code correlator is used to ensure matching generated and received sequences at similar transition times. Data Error Checker: Since the data is being received at a rate of 1/(Accumulator period), it is being received at a much higher rate than the data output rate. Thus the data error checker module sums up the numbers of 1’s and 0’s received and clocks out whichever value was received mostly at the desired data rate. This process will help eliminate data bit errors. Also the data error checker outputs a real-time approximate of the data received which is used in the phase correlator. Code Correlator: The code correlator has the task to generate I&Q sequences that match that of the received I&Q sequences. The code correlator, as depicted in Figure 21, contains a code generator which generates the I&Q codes sequences exactly in the same way that they were constructed in the 25
ELEC 492 Fall 2004
MATT
Fullinwider Church
transmitter as long as they are initiated in the same fashion (same tap numbers and initial sequences).
Figure 21: Code Correlator block diagram
Since the pseudo-random codes are generated in the exact same fashion, they are identical; however there may be some phase and frequency shifts. To get the generated sequences to completely match the received sequences, the code clock is altered. The receiver code clock is generated in a similar fashion to that of the transmitter code clock; the only difference is that the accumulators in the receiver code clock have a parameter allowing for shifting. The Doppler accumulator in the code clock generator takes care of frequency shifts and the code correlation process eliminates the phase mismatch of the received and generated code sequences. The Q-channel is sent dataless, thus it only contains the CDMA sequence and is not “corrupted” with data. This is done to simplify the correlation process. The correlation process only needs to be done to the Q-sequence, because if the Q-code is correlated, the I-code will also be correlated. The generated Q-sequence is used to create three time-shifted code sequences; early, prompt, and late. One sequence is used to correlate the code (the prompt sequence), and the other two provide information of the direction to shift (early and late sequences). The early sequence is early by one code clock period in comparison to the prompt, while the late sequence is delayed by one code clock period. Since the received code sequences are delayed by one accumulator period, the early, prompt, and late generated Q sequences then are also delayed by exactly one accumulator period (Td). To correlate the code sequence, we first exclusively-nor the received sequence with the early, late, and prompt sequences at every rising clock pulse. What this does is output a ‘1’ if the two sequences match at that moment, and output a ‘0’ if they mismatch. The output of each of the XNOR’d sequences are accumulated for specified number of clock cycles, controlled by the 26
ELEC 492 Fall 2004
MATT
Fullinwider Church
correlation period counter. When the counter reaches the specified count, the sums of the accumulators (correlation numbers) are compared. The prompt correlation number is then compared to the threshold, which is the number of clock cycles that we accumulated for. If the prompt correlation number does not match the threshold, then the code is mismatched and we then compare the late correlation number to that of the early correlation number. Whichever correlation number is higher indicates in what direction to shift the generated signals. The clock controller block sends a two bit signal out to the clock phase shift block. If the signal is “00”, then the sequences are correlated and the code clock does not require any shifting. If the control signal is “10”, we add phase to the code clock phase accumulator, which causes the next clock pulse to come earlier. Likewise, if the control sequence is “01”, we subtract phase to the code clock phase accumulator, which causes the next clock pulse to come later. If the control sequence is “11”, then we add enough phase to shift the signal by an entire code chip. Otherwise the amount of phase added or subtracted will correspond to one clock cycle. The XNOR, accumulate, compare, and shift process is repeated until the prompt correlation number meets the threshold, and the code sequences match. Even after the sequences are correlated, the correlate process will continue to ensure that the codes are in phase. Phase Correlator: The phase correlator has the task to generate sine and cosine waves that match the frequency and phase of the received input QPSK signal. The phase correlator, as depicted in Figure 22, contains a phase generator which generate the phase exactly in the same way that they were constructed in the transmitter as long as it is initiated in the same fashion (same Phase_Increment). The receiver phase generator must also be initialized with the appropriate Doppler_Increment register to compensate for frequency shifts during transmission.
27
ELEC 492 Fall 2004
MATT
Fullinwider Church
Figure 22: Phase Correlator block diagram
The input signal is phase shifted signal, thus in order to correlate the phase a signal with matching phase shifts is created. The phase generator passes a phase out to a shift block RAM, which is controlled by the generated I&Q sequences. This phase shift corresponds to the appropriate shifts associated if the signal was represented by a single cosine wave. The shifted phase is passed through a cosine look up table that creates a signal that matches that of the input, however there may be some phase offset. A sine wave is also created to aid as reference of what direction to shift the phase. Similarly to the code correlator, the input signal is multiplied with the generated sequence and accumulated for a specified number of clock cycles. In the case that the two sequences are exactly in phase with one another, the correlation number (sum of the accumulator at the end of the correlation period) will be the highest. If the correlation number is greater than the threshold value, then the phase is matched, and if the correlation number falls below the threshold then the cosine correlation number is compared to the sine correlation number and a control signal is sent to shift the phase in the phase generator in the appropriate direction. The multiply, accumulate, compare, and shift process is repeated until the phase is correlated and continuously runs to ensure phase matching. Meanwhile, the phase generator passes out phase through a sine cosine look-up table which provides the sine and cosine waves necessary in the QPSK demodulation process.
28
ELEC 492 Fall 2004
MATT
Fullinwider Church
PCI to Local Bus & C/C++ Interface Control Software: The C control is used to initialize the receiver in a similar fashion as that of the transmitter. The user will enter the same data that was necessary for the transmitter; however, the user will also enter data concerning threshold values, code correlator period, and accumulator period for the receiver. The C software writes register values to memory on the ADM-XRC-II PCM card. These values are then buffered until synchronously read and updated by the FPGA. The FPGA saves the received data in external memory until the C control software reads from the memory on the FPGA card and save the data on the computer. Eight-Channel Receiver: An eight-channel receiver is required at the base station. To implement the eight-channel receiver, the one channel receiver will basically have to be implemented eight times. The difference between the eight separate receivers will be the code sequences will be different for each channel. Each channel will require its own phase generator and correlator since the phase offset and Doppler effect will also vary among the 8 channels.
Hardware Description:
Alpha Data ADM-XRC-II board: The Alpha Data ADM-XRC-II board provided to us by SAIC is a PCI Mezzanine Card that houses a Virtex-II XCV6000-ff152 FPGA on it. The Virtex-II XCV6000-ff152 has:
o o o o o o o
33792 slices 67584 flip flops 67584 4-input LUT’s 824 Bonded IOBs 144 Block RAMs 144 18x18 Multipliers 16 Global Clocks Figure 23: Picture of ADM-XRC-II PCM
The transmitter and receiver together approximately take up 1% of the chips resources. Thus there is plenty of room to implement an eight-channel receiver on this particular FPGA, and room left over for more DSP (filters that would improve system performance). In all practicality, our design could be implemented on a smaller chip but this board is what SAIC already has. It contains a user programmable clock between 0.5 MHz and 100 MHz, in which we use the 100 MHz clock. It supports local bus speeds up to 66MHz. It contains two types of I/O. One type is 29
ELEC 492 Fall 2004
MATT
Fullinwider Church
the front-panel I/O with 146 user signals and can be accessed from the back of the computer using micro-coax cables. The rear-panel I/O has 64 user signals and connects to the computer’s local bus via the PCM.
Figure 24: ADM-XRC-II PCM card schematic
Signals that initialize the system or contain system status are connected to the rear-panel I/O. These signals include things such as receiver threshold values, system ready status, data, and system controllers such as carrier phase increment, initial code sequences, load, reset, and enable. Signals that connect to the front-panel I/O are the digital values of the QPSK modulated signal (out for transmitter and in for receiver). It will also send a reference clock to the DAC and ADC. The FPGA is programmed from Xilinx using a JTAG header. A parallel cable provided with the Alpha Data card runs from the parallel port into a hole cut in the back of the computer and connects to appropriate programming pins on the card. Once the FPGA is programmed, the C code is used to control the operation of the system. There are two ways of reading and writing to the FPGA; In direct slave mode, the data is buffered through extra hardware on the card. In direct master mode, the FPGA can directly request control over the local bus. We use the direct master mode. AD9772A DAC Evaluation Board: For the digital-to-analog converter we used the Analog Devices 14-bit AD9772. The chip is in the center of an evaluation board with all the appropriate resistors, amplifiers, etc. permanently wired to it. We only use 8 of the 14 bits to send the digital data into the DAC. Since the DAC uses a 2’s complement coding scheme, which is not used in our design, the most significant bit needs to be grounded. The digital data to the AD9772A comes directly from the ADM-XRC-II card via a ribbon cable which interfaces to a 40-pin IDC connector. The DAC requires the use of three power supplies to provide approximately 3.3V for the AVDD (analog voltage), DVDD 30
ELEC 492 Fall 2004
MATT
Fullinwider Church
(digital voltage), and CLKVDD (clock voltage). The analog output is received out of the DAC through a coax cable.
Figure 25: AD9772A Evaluation Board wiring schematic
AD9432 ADC Evaluation Board: The coax cable is then connected into an Analog Devices 12-bit AD9432 analog-to-digital converter. Once again the ADC chip is on an evaluation board. The evaluation board requires the analog signal, encode clock, and power supplies as its inputs. The output from the ADC is 8bits of digital data that is sent back into the ADM-XRC-II card via ribbon cables. Again since the ADC uses a 2’s complement coding scheme, which is not used in our design, the most significant bit needs to be grounded.
Figure 26: AD9432 evaluation board wiring schematic.
31
ELEC 492 Fall 2004
MATT
Fullinwider Church
Integration of Modules and Test Plan:
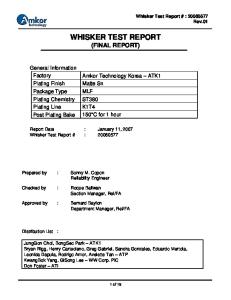
By using structural VHDL the various components, or modules, of the entire system were programmed individually and then incorporated later into a larger structure, the main program. The individual modules, such as the code generator and phase generator, were programmed, simulated and tested on their own first. Testing of each component was performed in ModelSim. Once the testing results were accurate, the components of the individual modules were combined into the main program. To do so, each component was declared in the main program and its own VHDL model was included in the project so the main program was able to locate it. Once all the components were included in the main program, the main program was simulated and tested in ModelSim as well. MATT utilizes two main programs, one for the transmitter and one for the receiver. We tested the system functionality using MatLab models. To test the overall VHDL code, we ran simulations using ModelSim, if the results from ModelSim resembled the results from MatLab, the code was assumed accurate. In necessary cases data was tested by outputting it to a logic analyzer or oscillioscope. In the test configuration, the transmitter and receiver are located on one FPGA. Thus they are initialized by a single GUI. The transmitter sends data of the current time on the computer. This data is modulated and ran through the DAC and ADC evaluation boards in which the signal is input back into the FPGA and demodulated. The GUI will then display the data received and at what time it was received. The ModelSim simulation of the transmitter is shown in Figure 27. In the simulation you can see the CDMA codes generated and the QPSK wave, which has distinct phase shifts when the codes change. This simulation indicates to us that the transmitter design is correct. However, for debugging purposes, certain signals such as the code clock were outputted to an oscilloscope to view its functionality and verify the desired rate.
Figure 27: ModelSim Simulation of the Transmitter.
32
ELEC 492 Fall 2004
MATT
Fullinwider Church
In the original testing of the receiver, we included the transmitter VHDL program directly into the receiver’s program. After demodulation of the signal is shown to work with known matched phases, we added various carrier and code phase shifts to the output signal of the transmitter to simulate and verify the working functionality of the receiver’s phase and code correlators. System Performance:
No concrete specifications on system performance were provided to us by SAIC; such as signal to noise ratios or bit-error rates. However we did keep in mind these topics during our design process, and we tried to generate ideas that would minimize errors in received data. The design is considered successful when we can successfully receive data (without error) in our mock-up system configuration. Presence of other factors that may occur over the satellite network which where unknown to us, may have to be looked into by whoever has the task of implementing the entire system. Theoretical system performance can be calculated in Matlab or explored in simulation. System Simulation in Matlab: The m.file ‘MATT.m’ (included in Appendix C – MATT.m Matlab File) was created to model the transmitter and receiver functionality, and was originally created for exploration of design alternatives. However, since it can be used to accurately calculate appropriate correlation thresholds, it is being included as a project deliverable. These threshold values are extremely dependent of carrier and code rates, and the amplitude and DC offset of the received QPSK signal; yet the calculation of these thresholds is hard to formulate and quantize. MATT.m makes finding threshold values quite easy, which these thresholds must be entered into the control GUI. The other alternative is to simulate the project in ModelSim (or your other favorite simulator), but this is a time consuming and painstaking process and requires knowledge of Xilinx and ModelSim. MATT.m also can serve as a foundation to explore system performance. For example, it can simulate carrier phase offsets, in which it was found that at our proposed rates the system can still correctly receive data if the phase offset is less than ±18º. It can be used to find the lowest signal to noise ratio in which no bit errors occurred; which was found to be 1.85. It can also explore code correlation in different cases of code chip offsets.
Figure 28: MATT.m simulation of Gaussian noise.
The lowest SNR in which bit errors did not occur was at 1.85. The yscale ranges from 0 to 28. 33
ELEC 492 Fall 2004
MATT
Fullinwider Church
Project Deliverables:
The following things are delivered in the MATT System Package. • Well commented VHDL code for the transmitter and receiver • Well commented C Interface control GUI code • MATT.m file • Pin maps for the test configuration • IO memory maps • Wiring diagrams of the test configuration This is delivered in a bounded book, and includes the codes on a CD. This data will also be posted on the USD engineering site in PDF format. Project Constraints and Risks:
Constraints: Access to SAIC lab and equipment was somewhat difficult. Between high-security, our SAIC mentor always being out of town, and the lab being used for other projects made it difficult to go in and use SAIC’s equipment. Our project is not a huge priority for SAIC, thus making it hard to find time when we can use their equipment to implement the design. Many unique include files and definitions in C/C++ concerning the ADM-XRC-II card were located on the hard drive at SAIC. However, about two years ago that hard drive crashed and the files were no where to be found when we tried to compile the software. It too k a lot of time to replace the lost files and they were too big to copy to the computers at USD. This made it difficult to get too far in writing the C code away from SAIC. In the nature of GPS, it may take a long time for the receiver to correlate to the transmitted signal. It is difficult to create and run a simulation for this long time period. Thus it is hard to verify full system stability in the ModelSim simulations. Anticipated Risks: The phase correlator has been one of the hardest parts to design for. It seems extremely inherently unstable. The phase correlator depends on the code correlator to provide proper I&Q codes. The code correlator depends on the Qcode received, which depends on the correct phase output from the phase correlator. The code cannot correlate efficiently until the phase is correlated, and the phase cannot correlate until the code is correlated. But this is how GPS systems are, a miracle that they work! It just might take a while for both to correlate. The functionality of the system depends highly on the levels of the thresholds set in the receiver. These thresholds are dependent upon the transmission rates and the scaling of the received signal (amplitude and DC offset). The MATT.m file needs to be used to model the desired system correctly to determine the appropriate threshold values. 34
ELEC 492 Fall 2004
MATT
Fullinwider Church
Anticipated risks concerning the C/C++ software would mostly occur if the user input invalid information. This would then load the FPGA board with invalid information and the system would malfunction or not even work at all. Design Schedule:
Key Deadlines October 22, 2004:
-Submit CDR written report -Update webpage
October 29, 2004:
-CDR oral report and demonstration
December 7, 2004:
-Final demonstration #1
December 10, 2004: -Final demonstration #2 By October 29, 2004 we will have a working transmitter and single channel receiver to demonstrate. The C/C++ software for the PCI interface will be slightly different for the demonstration given that the FPGA board used at USD will be external, whereas the FPGA board at SAIC is internal. Between October 29th and the final demonstration on December 7th, we will debug if necessary and address any issues of concern brought up in the Critical Design Review. By December 7, 2004 we will be able to demonstrate the final design of a transmitter and receiver. Figure 29 shows the complete project schedule for Fall 2004.
Figure 29: Project Schedule
35
ELEC 492 Fall 2004
MATT
Fullinwider Church
Budget:
MATT is funded by SAIC, which already has the equipment that will be needed for implementation of our mock-up system. Software development was done mostly with the free web version of Xilinx ISE; which included XST for synthesis and ModelSim for simulation. However, SAIC did later provide us with the complete package of Xilinx ISE 6.3i. When using the computer at SAIC, the project was synthesized with Synplicity. The licensing for these higher end tools are expensive (and varies greatly on factors of who the licenses are for), but they are not necessary to have in the product development. If we were pursuing this project without the assistance of SAIC, the costs of the absolute necessary hardware for the mock-up system (for all the software development could be done using the free versions) would approximately be $8,500. This budget for the Mock-up system can be broken down as follows: Virtex II FPGA Board (ADM-XRC-II): $8,000 Analog Devices AD9772A(14-bit DAC) PCB Evaluation Board: $200.00 Analog Devices AD9432 (12-bit ADC) PCB Evaluation Board: $200.00 Micro-coax cables: $100 This assumes that we would use one FPGA for both the transmitter and receiver. If SAIC were to pursue to fully implement the project at full scale, they would run a more detailed analysis of the budget. Ideally a PCM card would be designed with a FPGA and the ADC or DAC implanted on it, however for project development, we will not consider this or other optimizations of the design product. Taking on this project would cost SAIC approximately $100,000 to $200,000 just in labor and approximately $10,000 for each transmitter or receiver unit constructed plus the costs of the computers housing the units. Alternate Design Ideas:
QPSK Modulator: The transmitter architecture was pretty much laid out by SAIC and GPS standards. It basically consists of a DDS whose phase is shifted by the I&Q codes. DDS design in FPGAs is a common occurrence, thus the architecture for that is pretty much laid out. SAIC provided us with the code for the accumulator_loadable and LFSR_Shift_Register. GPS standards provide diagrams in how the code sequences should be generated. The QPSK signal is formulated by distinct phase shifts depending on I&Q. If I = ‘0’ we transmit +cos(t), or –cos(t) if I = ‘1’. Likewise if Q = ‘0’ we transmit +sin(t), or –sin(t) if Q = ‘1’. The signals are then added together. This could have been accomplished by creating +cosine and +sine waves, then accordingly invert them if I or Q equals ‘1’ before they are added together. This could easily be done by the not(X) command in VHDL. The reason that the phase shift method was used instead was to provide more flexibility with the design. Later if SAIC decided that they wanted to use a different phase shift configuration (such as 45º, 135º, 225º, and 315º ), they could accomplish this very easily. 36
ELEC 492 Fall 2004
MATT
Fullinwider Church
Sine / Cosine Look-up-Table: The 8-bit sine / cosine look-up-table designed is not an optimum design. It was originally going to be designed via the Xilinx Core Generator, but since we did not have access to the Core Generator with the free webpack of ISE at USD we used excel as a last minute alternative to design a look-up-table for our PDR demonstration. The look up table holds values for both sine and cosine at a given phase. An optimum design would utilize half as much memory, only holding the cosine wave, and shift the input address by 90º to map the sine wave. The look-uptable was never intended for use after the PDR demonstration, but since it worked fine enough it was never a priority to optimize it. Phase Correlator: In the receiver, the dependency of the phase correlator on the data received caused us some concern. For one, the data received is delayed by one data period, thus to efficiently compare the input signal to a receiver generated mimic signal the input and mimic signals should also be delayed by one data period. However this would require exhaustive use of long shift registers or memory to delay these signals. If the carrier clock is at 100 MHz, to delay the input and mimic signals by one data period at 250Hz would require two shift registers with a width of 400,000 bits each; or another option would be to continuously write current values and read delayed values from a block RAM. One alternative we explored was to remove this dependency on the data received. This could be done by subtracting sin(t) from the input signal if the Qcode is ‘0’, or by adding sin(t) if the Qcode is ‘1’. What this does is strip off the Qcode and create a BPSK signal only modulated by the Icode. Now we can multiply by +cosine and -cosine, accumulate and compare the two correlation numbers to a threshold and each other. By using logic we can determine if the phases are correlated and if not, then we can determine in which direction to shift. Matlab was used to help develop this logic, however the reason this method was not implemented was because the logic is quite intense and correlation is obtained if the correlation number falls between a threshold range, in which this range is quite tight. Also in subtracting the ± sine wave from the input, you must be concerned with the differential amplitudes and DC offsets. We ended up coming up with the current phase correlator design, by deciding that given the huge difference in carrier and data rates that there should not be too much cause for concern on the phase correlator’s dependency on the data received. The phase correlator will most likely induce a phase shift every time there is a data bit transition (which will occur approximately every 40920 accumulator periods, however this one clock cycle shift should not affect system performance at this rate. If we felt that this erroneous phase shift was a problem, delaying the input and mimic signals by one accumulator period is more realistic. We then came up with the idea to send a real-time approximate data received value from the data error checker module that will provide a more stable data input for the phase correlator. C Control Interface: Originally the user was going to input the necessary specifications into a simple input/output screen, such as the generic one seen in Figure 30. This design was simple and efficient; 37
ELEC 492 Fall 2004
MATT
Fullinwider Church
however, not very user friendly. The purpose of the C/C++ PCI interface is to not only communicate with the FPGA board but to also be easily manipulated and used by the user. This original design did not allow the user to choose to use default values or their own specified values, instead the user would need to input all the values necessary, whether default or not. This leaves large room for error. This design also did not make it easy to reset the system. Overall, it was decided it would be better to interact with the user through a graphical user interface. All the same tasks could be performed and it would be much more user friendly.
Figure 30: Original C Interface.
Another alternative design idea had to do with the GUI. We debated using the Glade GUI program that is coded with C/C++; however, the libraries needed for the program were not easily attainable and were constantly being erased from the hard drives in Loma 207. Once we discovered Microsoft Visual 6.0 had a relatively similar GUI program we decided to use it instead.
Signal Demodulation: The QPSK demodulator went through a few different ideas. Probably the most unrealistic idea was to run the input signal into a reverse Sin/Cos look-up-table and map the input amplitude to a phase. This would be ideal because we could use logic to detect phase shifts, and it would eliminate the need for a phase correlator. This was an unrealistic idea because for one, this mapping is not linear. The amplitudes (other than ±1) correspond to two different phases. Even 38
ELEC 492 Fall 2004
MATT
Fullinwider Church
if we found away around the non-linear mapping, this technique would absolutely demand on proper full scaling of the input signal to function, which would be quite difficult to do. The QPSK signal can be demodulated in various ways. The first step was to do something to the input signal to separate the I&Q codes. One explored method of doing this is to subtract the input signal by a pure cosine wave to create an amplitude modulated signal of the I-channel. Likewise an amplitude modulated signal of the Q-channel can be created by subtracting a pure sine wave from the QPSK input signal. The reason why multiplication of cosine and sine to separate the codes was chosen over this method is because it creates a greater amplitude difference in the AM signals. Next the amplitude modulated signal needed to be resolved to a single bit for each code sequence. The first idea was run the signal through a low-pass filter to try to eliminate the carrier and keep the basic shape of the amplitude envelope. The other idea was to construct a digital envelope detector that would detect peaks in the signal and slowly decay until another peak is detected. This could provide a good envelope of the signal if the time constant of the delay was designed correctly. Both of these methods would require a comparison to a threshold value somewhere in the process. The accumulate and compare to threshold method was chosen for its simplicity of implementation and it expands the gap between the amplitudes thus improving system performance. However, the accumulator amplitude can vary greatly when there are big phase transitions. For optimum performance the signals should be ran through a lowpass filter prior to the accumulation process.
Suggested Future Alterations:
o o o o
Lowpass Filter before accumulation in QPSK demodulation Lowpass Filter before accumulation in phase correlation Optimize Sin/Cos look-up-table Amplitude Scaling of I&Q channels in transmitter
By filtering the signals before accumulating, we would get a wider gap in which the threshold value would lie. This would reduce bit-errors and make the system less susceptible to the receiver input signal’s amplitude scaling. Right now the sin/cos look-up-table utilizes memory to hold both the sine wave and cosine wave. The memory allocation can be reduced by half if it only contained the cosine wave, and the sine wave could be obtained by shifting the phase input by 90 degrees. The table could even be reduced further if only a ½ or ¼ cosine wave is stored in the RAM. For more user flexibility, an amplitude modulator can be used to control the level of the I & Q channel signals. The levels could be set anywhere from zero to full scale. For example, a channel may be transmitted at half power. The cosine output from the look-up-table would be multiplied by the output of a cosine amplitude block RAM and the sine output from the look-uptable would be multiplied by the output of the sine amplitude block RAM.
39
ELEC 492 Fall 2004
MATT
Fullinwider Church
Personnel:
Erin Fullinwider, 4th year EE major, Math Minor Relevant courses Erin has taken include C/C++ Programming, Signals and Systems, Communication Transmission Principles, Digital Logic Design, Control Signals and Electronics. In MATT, Erin was responsible for minimal VHDL code, C/C++ graphical user interface, PCI to local bus interface and external hardware (DAC and ADC). Joseph Church, 4th year EE major, Math Minor Relevant courses Joey has taken include Signals and Systems, Communication Transmission Principles, Digital Logic Design, Control Signals and Electronics. In the spring of 2004 Joey was the teacher’s assistant for the Digital Logic Design Lab where he further strengthened his VHDL skills. In MATT, Joey was responsible for the majority of VHDL code, Matlab Simulations, and external hardware (DAC and ADC) Don Reed, SAIC Director of Navigation & Communications Research SAIC contact Provided specifications
40
ELEC 492 Fall 2004
MATT
Fullinwider Church
References:
Proakis, John G. Contemporary Communication Systems using Matlab. Second Edition. Brooks/Cole-Thomson Learning. Belmont, CA. ©2004. Tsui, James Bao-Yen. Fundamentals of Global Positioning System Receivers, A Software Approach. John Wiley & Sons, INC. United States ©2000. http://tycho.usno.navy.mil www.uspto.gov Hormozon, Sally. SAIC. Electrical Engineer in Navigation & Communications Research. Reed, Donald. SAIC. Director of Navigation & Communications Research.
41
ELEC 492 Fall 2004
MATT
Fullinwider Church
Appendix A: Glossary of Acronyms
ADC – Analog-to-Digital Converter BPSK – Binary Phase-Shift Keying C/A code - Coarse Aquisition Code CDMA – Code Division Multiple Access CW - Continuous Wave DAC – Digital-to-Analog Converter DDS – Direct Digital Synthesis DSSS - Direct-Sequence Spread Spectrum FPGA – Field Programmable Gate Array GPS - Global Positioning System GUI – Graphical User Interface IF – Intermediate Frequency I&Q – In-Phase and Quadrature Phase PCI – Peripheral Component Interconnect PCM - PCI Mezzanine Card QPSK – Quadrature Phase-Shift Keying VHDL – Very High-Speed Hardware Description Language
42
ELEC 492 Fall 2004
MATT
Fullinwider Church
Appendix B – PCI User Interface System Set-Up Equations
Transmitter Equations: f ∆CarrierPhase = carrier ⋅ 2 AccumulatorWidth ( bits ) f clk f ∆CodeClockPhase = code ⋅ 2 AccumulatorWidth ( bits ) f clk ∆Doppler = 2
AccumulatorWidth ( bits )
⎛1+ v ⎞ ⎜ c0 ⎟ ⎜ ⎟ ⎜1− u c ⎟ 0 ⎠ ⎝
Where v = transmitter speed u = receiver speed c0 = speed of light = 3 x 10⁸ m/s2
Receiver Equations: f ∆CarrierPhase = carrier ⋅ 2 AccumulatorWidth ( bits ) f clk f ∆CodeClockPhase = code ⋅ 2 AccumulatorWidth ( bits ) f clk ∆Doppler = 2
AccumulatorWidth ( bits )
⎛1+ v ⎞ ⎜ c0 ⎟ ⎜ ⎟ ⎜1− u c ⎟ 0 ⎠ ⎝
Where v = transmitter speed u = receiver speed c0 = speed of light = 3 x 10⁸ m/s2
DataClkDivide =
1 T Accumulator ⋅ f data
f clk −1 2 f code f TCodeCorrelator = 10 ⋅ clk f code 1 − CodeShift = ⋅ ∆CodeClockPhase 2 3 + CodeShift = ⋅ ∆CodeClockPhase 2 2 AccumulatorWidth ( bits ) − 3∆CodeClockPhase + CodeChipShift = 2 CodeCorr _ Threshold = CodeCorrelationPeriod − AccumulatorPeriod CodeCorrelationPeriod OffChipCodeCorr _ Threshold = −1 2 T Accumulator =
43
ELEC 492 Fall 2004
MATT
Fullinwider Church
Appendix C – MATT.m Matlab File % ----------------------------------------------------------------% MATT.m - created 12/01/2004 by Joey Church % % This matlab m.file simulates the mathmatical theory of the MATT % transmitter and receiver. It serves as a foundation to determine % and explore threshold values and explore system performance. % %------------------------------------------------------------------echo off; clear; close all; %---------------------------------------------------------------------%-- Initial Setup %---------------------------------------------------------------------% %-- Initial values and Constants ---------------------------------clk = 100; % FPGA clock frequency (100 MHz clock) carrier = 5.115; % Carrier frequency (5.115 MHz carrier ) code = 1.023; % Code Chip frequency (1.023 MHz ) phseWidth = 8; % number of bits of modulated signal output Ithresh = 3018; % I-threshold value Qthresh = 2884; % Q-threshold value Pthresh = 3573; % Phase Correlation threshold value %-- Values to test system performance ----------------------------AmpAtn = 1; % Amplitude attenuation of Transmitted/Received signal shift = 0*.5*pi; % Phase offset of received signal SigLevel = 1; NoiseLevel = 0; % Signal to Noise Ratio %-- Initial time calculations -----------------------------------------code_cycle = round(clk/code); % Number of clock cycles per code chip AccumCnt = round(code_cycle/2); % Accumulator period t = 0:1:code_cycle-1; % time (number of clk cycles) for 1 code chip ft = 2*pi*carrier.*t./clk; % time vector normalized to carrier frequency for 1 chip t2 = 0:1:8*code_cycle-1; % time (number of clk cycles) for 8 code chips ft2 = 2*pi/clk*carrier.*t2; % time vector normalized to carrier frequency for 8 chips xbit = [0 1 2 3 4 5 6 7 8]; % time vector of code chips xscale = xbit*code_cycle; % time vector of code chips in respect to clk cycles %--- End Initial Setup -----------------------------------------------------------%---------------------------------------------------------------------------------% Transmitter %---------------------------------------------------------------------------------% Amp = 2^(phseWidth-1); % converts amplitude in respect to binary value zero = zeros(1,length(t-1)); one = ones(1,length(t-1)); Icode = [zero,zero,one,one,zero,one,zero,one]; % transmitted I sequence Qcode = [zero,one,zero,one,one,zero,zero,one]; % transmitted Q sequence Iseq = zeros(1,length(t2)); Qseq = zeros(1,length(t2)); for k=1:length(t2) % QPSK Modulation. Phase shifts depend on IQ value if Icode(k) == 0 Iseq(k) = Amp*cos(ft2(k) + shift)+Amp; % I=0, cos(t) else Iseq(k) = Amp*cos(ft2(k) + pi + shift)+Amp; % I=1, -cos(t) end if Qcode(k) == 0 Qseq(k) = Amp*cos(ft2(k) + 3*pi/2 + shift)+Amp; % Q=0, sin(t) else Qseq(k) = Amp*cos(ft2(k) + pi/2 + shift)+Amp; % Q=1, -sin(t) end end InSeq = (Iseq + Qseq)/2 ; % Transmitted sequence generated: % The sequence will overflow into a carry bit. % The division by 2 simulates taking the most % significant bits to keep the phaseWidth the same. % The signal floats in the range, and can be scaled
44
ELEC 492 Fall 2004
MATT
Fullinwider Church
% and DC offset to simulate the actual receiver input. % after the DAC and ADC conversions. % gaussian noise creation for k=1:length(t2) u = rand; z = (sqrt(2*log(1/(1-u)))); u = rand; gs(k) = z*cos(2*pi*u); end scaledNoise = 2^(phseWidth-1) + 2^(phseWidth-1)*(gs./max(abs(gs))); % noise scaled between 0 and 2^N inSeq = (SigLevel*InSeq + NoiseLevel*scaledNoise)./(SigLevel+NoiseLevel); % Transmitted signal plots. subplot(311); plot(t2,Iseq,t2,Icode*256); title('I sequence'); subplot(312); plot(t2,Qseq,t2,Qcode*256); title('Q sequence'); subplot(313); plot(t2,inSeq); title('QPSK modulated signal = I+Q sequence'); axis([0 800 0 300]); xlabel('clock cycle'); %--- End Transmitter ---------------------------------------------------------------%------------------------------------------------------------------------------------%-Receiver %------------------------------------------------------------------------------------% %-- QPSK Signal Demodulation [Multiply by Pure Waves] -------------------------------pureCos = Amp*(cos(ft2)+1); % cosine wave without phase offset pureSin = Amp*(sin(ft2)+1); % sine wave without phase offset % By multiplying the input sequence by a cosine wave % matched in relative phase results in a amplitude % modulated signal of the Icode. Likewise multiplication % of the input and a sine waves yields the Qcode. % Division by 2^PhseWidth takes the upper MSB's Idemod = (pureCos .* inSeq)/(2^phseWidth); Qdemod = (pureSin .* inSeq)/(2^phseWidth); figure % plots of the amplitude modulated code sequences subplot(211); plot(t2,Idemod,t2,Icode*256); title('I-channel Pthresh PhseShift(n) = 0; direction(n) = 0; else PhseShift(n) = 1; if Caccum(k) > CaccumS(k) direction(n) = -1; else direction(n) = +1; end end Caccum(k+1) = 0; CaccumS(k+1) = 0; n = n+1; cnt = 0; end end Pthreshp = round(Caccum(98)-10); % suggested Pthreshold value Vp = Pthresh*ones(1,length(t2)); % The threshold level could be more accurate if % the multiplication of the two signals was ran
48
ELEC 492 Fall 2004
MATT
Fullinwider Church
% through a low-pass filter first to eliminate % the cusps at the phase shifts. figure; % plots of the Phase Correlation plot(t2,Caccum,t2,CaccumS,t2,Vp); axis([0 800 0 5000]); title('Phase Correlation Number'); grid; set(gca,'XTickMode','manual','XTick',xscale); set(gca,'XTickLabelMode','manual','XTickLabels',xbit); set(gca,'Ygrid','off'); xlabel('Code Chips'); text(5,Pthresh+150,'Phase Correlation Threshold'); legend('Cosine','Sine'); %--- End Phase Correlator --------------------------------------------------------------% %--- End Receiver ----------------------------------------------------------------------%---------------------------------------------------------------------------------------%-- Text Output of calculated values ---------------------------------------------------clc; fprintf('\n \n \n'); fprintf('If the system phases are matched then the suggested thresholds are:\n'); fprintf(' I-threshold: %d => "%s" Hex \n',Ithreshp,dec2hex(Ithreshp)); fprintf(' Q-threshold: %d => "%s" Hex \n',Qthreshp,dec2hex(Qthreshp)); fprintf('\n'); fprintf('\nThe Code Correlation Numbers are:\n'); fprintf('Early Code : %d = %d percent \n',EcNum,round(100*EcNum/length(t2))); fprintf('Prompt Code : %d = %d percent \n',PcNum,round(100*PcNum/length(t2))); fprintf('Late Code : %d = %d percent \n',LcNum,round(100*LcNum/length(t2))); fprintf('\n%s \n',CodeShift); fprintf('\nIf the system phases and codes are matched then the suggested Phase Correlation threshold is:\n'); fprintf(' P-threshold: %d => "%s" Hex \n \n',Pthreshp,dec2hex(Pthreshp)); fprintf('\nPhase will be shifted if "1" in positive or negative direction'); PhseShift direction %-- End Matt.m -------------------------------------------------------------------------------
49
ELEC 492 Fall 2004
MATT
Fullinwider Church
Appendix D – Personnel Resumes Joey Church 665 Camino de Orchidia Encinitas, CA 92024 (619) 379-2221
[email protected]
EDUCATION University of San Diego, San Diego, CA [GPA: 3.54] B.S. & BA. Electrical Engineering [Upper Division GPA: 3.92] Minor in Mathematics [GPA: 3.71]
Expected December 2004 Completed Fall 2002
Relevant Coursework Electronics, Digital Design, Signals & Systems, Communication Systems, Microprocessors, Power, Electromagnetics, Differential Equations, Circuits Computer Aided Engineering, Optics, Complex Number Theory PROJECT EXPERIENCE Digital Project Spring 2003 Simulated a Microprocessor’s Functions using an FPGA and its RAM capabilities. Electronics Project Spring 2003 Designed and implemented a transistor amplifier for specified gain, frequency response, and input and output impedances. Microprocessor Project Fall 2002 Theoretical designed a car alarm/monitoring system, by interfacing I/O ports, memory IC’s, sensors, keypad, and a display with a microprocessor. NIFTY Project Spring 2001 Improved upon a previous design of an anti-theft alarm system, which was modeled using Fischertechnik components (structural, motors, lights, sensors, and switches) and simulated by using a computer controlled program. Walk on Water Fall 2000 Designed a pair of shoes that allowed the user to pilot across an Olympic size pool. WORK EXPERIENCE Websense Inc. Summer 2004 QA Test Engineer – Tested the install of the Websense software product on various Network configurations. Digital Logic Design Lab Teacher’s Assistant Aided students in learning digital logic gates, VHDL, and Xilinx.
Spring 2003
California Water Sports, Carlsbad, CA Summers 2003, 2002 Beach Person - Assisted customers with rental equipment and ensured safety. Legoland California, Carlsbad, CA Summer 2001 Education Associate - Taught robotics classes and weeklong camps using Lego Mindstorms equipment. The robots were programmed to turn on/off certain motors or lights corresponding to given inputs from light or touch sensors and timers. Blue Man Group, Las Vegas, NV Spring-Summer 2000 Paper Performer - Assisted the Blue Man with the audience participation. DKK Physical Therapy, Las Vegas, NV Fall 1999 Volunteer – 200 hours volunteer work for physical therapist of athletes such as Tiger Woods and Mike Tyson. SKILLS PSpice, MATLAB, MathCad, Maple, Xilinx, ADS, Word, Excel, PowerPoint, Project, Photoshop, Premiere, Bryce, Sound Forge, Java programming ACTIVITIES Eta Kappa Nu (HKN) – Vice President Skateboard Club – President Guam Club – Program Director
Spring 2003-Present Fall 2001-Present Fall 2003-Present
50
ELEC 492 Fall 2004
MATT
Fullinwider Church
Erin Fullinwider 2082 Kaia Lane, Sierra Madre, CA 91024 (858) 353-1469
[email protected]
EDUCATION University of San Diego, San Diego, CA B.S. and B.A. in Electrical Engineering Minor in mathematics Relevant Courses C++ Programming Electronics Probability and Statistics System Logic Design Biomedical Engineering
Expected graduation date: December 2004
Principles of Electric Power Signals and Systems Communication Transmission Principles Control Systems
EXPERIENCE Los Angeles County, Department of Public Works, Building and Safety Division Title: Electrical Engineer Student Worker Checked and corrected electrical building plans. Knowledge in electric distribution equipment, power quality analysis, load curtailment, and the National Electrical Code. Interacted with the public daily. Tutor in Mathematics, Self Employed Privately tutored high school students in pre-calculus, advanced algebra, and calculus. Engineering Design Projects Improved a simulated bottling plant using LLWin and Fischertechnik components. Walk on Water-designed and constructed buoyancy shoes that allowed one to walk on water. Direct Digital Synthesizer-designed a program that would output sine and cosine waves using Spartan 2 Xilinx board and digital-to-analog converter. Analog Band Pass Filter-designed, simulated, and built an amplifier to meet various requirements. Senior Design Project: currently working in conjunction with Science Applications International Corporation (SAIC) to update their two-way satellite time transfer system.
Alhambra, CA Summer/Winter 2001-present
San Diego, CA 2002-present
Fall 2000 Spring 2001 Spring 2003
Spring 2003 Spring 2004
SKILLS Assembly language programming of a basic microprocessor. Computer-aided design using SPICE. C++ Programming. VHDL Programming Matlab Mathcad LabView Member of IEEE since April 2004
51