WEEKLY MARKET VIEW 20 July 2012 Contents Waiting for policy stimulus
Pg 1
Waiting for policy stimulus
Bernanke signals willingness, Wen warns
Pg 2
Economic surprises may be bottoming, but more policy stimulus is
Conclusion
Pg 3
likely needed in Europe and likely forthcoming in China. Bernanke’s
Technical analysis
Pg 4
testimony suggests QE3 cannot be ruled out, but we expect data to
Economic & Market Calendar
Pg 6
3-12 month Market Outlook
Pg 7
improve in Q3, meaning such easing may wait until the fiscal cliff looms in 2013. Equities (particularly the high-yielding variety), high yield corporate
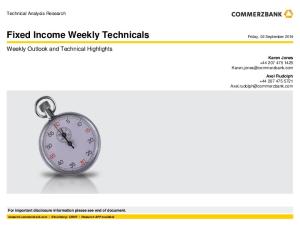
Asian monetary policy beginning to soften China, Korea policy rates
bonds and Asian local currency bonds are our preferred asset classes. With Europe once again appearing to be at a critical point in its
8
evolution, short term weakness cannot be ruled out, but we would
7
expect this to be temporary and an opportunity for investors.
%
6 5
MACRO OVERVIEW
4
•
3
Bernanke signals a willingness to act if the economy worsens. US
2
retail sales data disappoints, but housing data improves. Q3
1
rebound expected
0 Mar-08
Oct-08
May-09
Dec-09 China
Jul-10
Feb-11
Sep-11
Apr-12
•
Source: Bloomberg, Standard Chartered
Progress towards finalising Spanish bank bailouts a positive, though peripheral sovereign debt markets remain stressed
Korea
•
Asian data weakening, opening the room to further policy rate cuts, most so in China
FIXED INCOME
Key events this week:
Data / Event
Date
Germany IFO
25 July 25 July 26 July 26 July
Thai policy rates New Zealand policy rates Philippines policy rates Source: Standard Chartered
•
US high yield default rates remain well below average. Continue to average in on weakness
•
Regionally we prefer US and Asian corporate credit, though the US offers a better risk-reward trade-off in our view
EQUITIES •
Q2 earnings, the search for yield and sensitivity to interest rates are key themes in equity markets
•
We maintain our focus on staples, technology and oil sectors
COMMODITIES Manpreet Gill
Senior Investment Strategist
Steve Brice
Chief Investment Strategist
Rob Aspin, CFA
Senior Investment Strategist
Suren Chelliah
Investment Strategist
•
Oil may face short-term technical resistance, but we remain positive long-term due to geopolitical risks and demand strength
•
We would not chase the weather-driven rally in soft commodities
CURRENCIES •
FX market positioning still remarkably neutral, excluding the EUR
•
We continue to prefer to sell into Euro strength short-term, while
•
South Africa surprises with 50bps rate cut, but still-high yields
preferring Asian currencies long-term likely to continue supporting the Rand This commentary reflects the views of the Wealth Management Group of Standard Chartered Bank
Weekly Market View
Bernanke signals willingness, Wen warns Benchmark (USD) performance w/w* JP Morgan Cash Index
Data and events this week were about as ‘muddle-through’ as you can get. Fed Chairman Bernanke signalled a willingness to act if the
0.01
MSCI AC World Index
economy worsened, but suggested further easing was not imminent.
1.79
Citigroup World BIG Index
Further easing in Europe and Asia is clearly more likely in the near
0.54
DJ UBS Commodities Index
term with the Spanish 10yr bond yield once again around 7% and
3.92
Chinese Premier Wen highlighting concerns on the labour market front.
DXY Index-0.56 ADXY Index
•
0.21 -1
1
3
Bernanke signals willingness to act, but easing not imminent: Fed Chairman Bernanke’s comments this week suggest that while economic
5
%
data has been “generally disappointing” in recent times, it is too early for
*week of July 13 to July 19 Source: Bloomberg, Standard Chartered
further quantitative easing to be pushed through. His comments noting borrowing conditions remain tight for some businesses suggest measures to encourage lenders to lend are possible. We doubt further monetary easing will be announced as soon as the August 1 FOMC meeting and given we expect growth to rebound in Q3, further easing may have to wait until it is required to offset a further tightening in fiscal policy expected in early 2013. •
China economic surprises may have bottomed while US not far away Economic Surprise Indices
US economic surprises may be bottoming: While retail sales were weaker than expected, housing data continued to print higher than consensus expectations. Housing starts continued to drift higher while
250
the NAHB home builder confidence moved sharply higher. In our view, it
200
is likely US economic surprises are bottoming while the housing market
150
is gradually turning.
100 Index
50
•
0 -50
German and Finnish support for Spain bank bailouts a positive, but markets still stressed: Finland agreed to support bailouts for Spanish
-100
banks after achieving a deal on obtaining collateral in return, while
-150 -200
Germany’s Bundestag voted in favour of the bailout terms. Together,
-250 Jan-07 Jul-07 Jan-08 Jul-08 Jan-09 Jul-09 Jan-10 Jul-10 Jan-11 Jul-11 Jan-12 Jul-12 US
China
these represent significant progress on bank bailouts in Europe.
Europe
Peripheral sovereign debt markets, however, remain stressed with
Source: Bloomberg, Standard Chartered
Spanish 10yr yields approaching 7% again. We maintain our view that ECB action will likely be ultimately required, though a market riot may be required to push policymakers to act. •
Chinese Premier Wen’s comments suggest room for further policy easing: Wen commented that China’s employment situation will become “more complex and more severe” while separately noting that the government will “appropriately” fine-tune policy in the second half to
US homebuilder confidence has rebounded strongly US NAHB home builder confidence index
support growth. This suggests more room for policymakers to ease policy to deal with economic growth concerns. We expect further policy
80
rate and required reserve ratio cuts in the second half, but remain
70 60
mindful that a 2009-style stimulus package remains unlikely as
50
policymakers attempt to avoid a sharp rebound in house prices. •
40
Asian data consistent with a tilt towards policy easing: Indian WPI
30
inflation fell to 7.25%, though the risk of higher fuel prices (due to an
20
increased in regulated prices) and food prices (due to the mixed
10 0 Jun-00
monsoon thus far) mean we remain concerned about inflation risks. Apr-02
Feb-04
Dec-05
Oct-07
Source: Bloomberg, Standard Chartered
Aug-09
Jun-11
Singapore’s weaker Q2 GDP growth (-1.1% QoQ) highlighted the risk to Asian exporters from weaker global growth, underscoring the Bank of Korea’s shift towards policy easing, for example.
2
Weekly Market View What does this mean for investors? Q2 earnings remain a near-term focus for equity markets. US earnings High dividend yield strategy has outperformed year to date MSCI Asia ex Japan Index vs. MSCI Asia ex Japan High Dividend Yield Index
data thus far shows that earnings on aggregate are surprising slightly on the upside, though earnings growth has been negative. Earnings reports are likely to dominate the market’s attention in the short term.
120
The search for yield is likely to remain a key theme in an extended 115
muddle-through economy. In the equity market, this is positive for high 110 Index
dividend yielding stocks. They have outperformed year-to-date, but in our view they are likely to remain attractive in what looks to be an extended
105
period of low growth and low policy rates.
100
95 Jan-12
We also like equity market sectors that are likely to benefit from lower Feb-12
Mar-12
MSCI Asia ex Japan
Apr-12
May-12
Jun-12
Jul-12
interest rates. Monetary easing is already underway in China, while
MSCI Asia ex Japan yield (RHS)
increasing growth concerns suggest a rising tilt towards softer policy stances
Source: Bloomberg, Standard Chartered
elsewhere in the region as well. This is positive for the property sector in China, for example, especially when combined with easing restrictions for first-time home buyers. It does, however, reinforce our underweight view on the banks as lower interest rates put downward pressure on net interest margins and thus profits. US high yield spreads back at long-term median levels BarCap US High Yield spread
We remain Overweight Staples, Technology (IT) and Oil sectors in equities. Staples can do well in difficult market environments. Both
15 13 11
Median
technology and oil sectors offer attractive valuations, with oil in particular
+1 std dev (10y)
offering exposure to the risk of higher oil prices.
-1 std dev (10y)
9
Our preference for corporate credit remains given the low interest rate
7
environment. We note US high yield spreads are again approaching long-
5
term median levels, but believe these levels offer value due to the positive
3
credit risk backdrop. Fitch Ratings reported that the US high yield default
1 -1 Jul-09
rate remained unchanged at 2.2% in June, well below the long-term average, Jan-10
Jul-10
Jan-11
Jul-11
Jan-12
Jul-12
while recovery rates remained well above historical norms. The US and Asia remain our preferred regions, with the US offering the most attractive risk-
Source: Bloomberg, Standard Chartered
reward trade-off in our view. We recognise the risk of some spread-widening especially in the event of a Europe-related rise in risk aversion, but remain comfortable using any spread widening to continue averaging in. FX market positioning remains remarkably neutral: Currency markets were largely lightly positioned ahead of Bernanke’s testimony, with the
No of contracts 000
Market positioning in AUD has rebounded back into usual range AUD net non-commercial positions
exception of the Euro where net positioning remains very short. Short-term, we would focus on pairs like the Euro where both the fundamental and technical picture remains more convincing (we retain our bias to sell into
100
strength). Long-term, we continue to like Asian currencies, with local
80
currency bonds being our preferred implementation route. South Africa’s
60
surprise 50bp rate cut is marginally negative for the Rand, but still-high
40
absolute yields will likely continue supporting the currency.
20 0
Key events next week: US: New home sales, durable goods, Univ. of
-20
Michigan consumer confidence; Eurozone: German Ifo survey; Asia: New
-40
Zealand, Philippines and Thailand policy rates, Korea GDP, China flash PMI.
-60 Jan-05
Jan-06
Jan-07
Jan-08
Jan-09
Source: Bloomberg, Standard Chartered
Jan-10
Jan-11
Jan-12
Conclusion: Economic data and policy signals remain consistent with an extended period of muddle-through growth. Equities, high yield credit and Asia local currency bonds remain our favoured asset classes given the value and yields available. 3
Weekly Market View
Technical Analysis S&P 500 – Looking tired, with diminishing momentum. However, it continues to trade in an upward channel with positive bias as long as the lower band of the channel holds. Key supports are placed at 1340 and 1300. Key resistance is placed at 1385 and 1410. 1450
1385
1400 1350 1300
1340
Index
1250 1200 1150 1100 1050 1000 May-11
Jul-11
Sep-11
Nov-11 S&P 500
50 dma
Jan-12 100 dma
Mar-12
May-12
Jul-12
200 dma
Source: Bloomberg, Standard Chartered
Hang Seng China Enterprises Index – The rebound may be justified due to extreme oversold levels reached earlier. The index continues to trade in a downward channel with a positive bias. Resistance is seen at 9750 and then 9900 while support is at 9100. The index needs to break below 9000 or above 9900 for a trend to be established. 14000
13000
12000
Index
11000
10000
9900 9000
9100
8000
7000 May-11
Jul-11
Sep-11 HSCEi Index
Nov-11 50 dma
Jan-12 100 dma
Mar-12
May-12
Jul-12
200 dma
Source: Bloomberg, Standard Chartered
Stoxx Euro 600 – The Euro Stoxx Index has recovered significantly from lows. It continues to trade in an upward channel with a positive bias as long as the lower band of the channel holds. Immediate resistance is placed at 260 and 265. Key support is placed at 251. 300 290 280
260
270
Index
260
251
250 240 230 220 210 200 May-11
Jul-11
Sep-11 Stoxx Euro 600
Nov-11 50 dma
Jan-12 100 dma
Mar-12
May-12
200 dma
Source: Bloomberg, Standard Chartered
4
Weekly Market View Brent Crude – The current rally is likely to face resistance at the upper band of the downward channel. Expect profit booking around this level. Key support is placed at 101. Key resistance is placed at 108. 130 125 120 115
108
USD
110 105 100
101
95 90 85 May-11
Jul-11
Sep-11 Brent oil
Nov-11 50 dma
Mar-12
Jan-12 100 dma
May-12
200 dma
Source: Bloomberg, Standard Chartered
Gold – Gold has been trading in a contracting triangle pattern since the end of last year. The focus now remains on 1550. We observe the range narrowing and a breakout of the pattern is nearing as the range narrows. Support on the downside below 1550 is 1480 (last year July lows). Key resistance is placed at 1640 and then 1680. 1950
1850
USD/Oz
1750
1640
1650
1550
1550 1450
1350 Jun-11
Aug-11
Oct-11
Dec-11 Golds
50 dma
Feb-12 100 dma
Apr-12
Jun-12
200 dma
Source: Bloomberg, Standard Chartered
AUD-USD – The currency pair continues to trade in an upward channel with a positive bias as long as the lower band of the channel holds. Key support is placed at 1.02 and key resistances are placed at 1.048 and 1.065 1.15 1.13 1.11
AUD - USD
1.09 1.07
1.048
1.05 1.03 1.01
1.02
0.99 0.97 0.95 Jun-11
Aug-11
Oct-11 AUD - USD
Dec-11 50 dma
Feb-12 100 dma
Apr-12
Jun-12
200 dma
Source: Bloomberg, Standard Chartered
5
Weekly Market View
Economic & Market Calendar 20 July 2012 Next Week: July 23 - July 27 Event
This Week: July 16 - July 20 Period Expected
US
Chicago Fed Nat Activity Index
Jun
--
Prior
Event
-0.45
US
Advance Retail Sales
Period
Actual
Prior
Jun
0.20%
-0.20%
EC
Euro-Zone Consumer Confidence
Jul A
--
-19.8
US
Retail Sales Ex Auto & Gas
Jun
0.10%
-0.10%
HK
CPI - Composite Index (YoY)
Jun
--
0.043
US
Business Inventories
May
0.30%
0.40%
TA
Industrial Production (YoY)
Jun
0.91%
-0.21%
EC
Euro-Zone CPI - Core (YoY)
Jun
1.60%
1.60%
SI
CPI (YoY)
Jun
5.20%
5.00%
EC
Euro-Zone CPI (YoY)
Jun
2.40%
2.40%
EC
Euro-Zone Trade Balance sa
May
6.3B
4.5B
EC
Euro-Zone Trade Balance
May
6.9B
3.7B
GE
PMI Manufacturing
Jul A
--
45
US
Consumer Price Index (YoY)
Jun
1.60%
1.70%
GE
PMI Services
Jul A
--
49.9
US
CPI Ex Food & Energy (YoY)
Jun
2.20%
2.30%
EC
PMI Manufacturing
Jul A
--
45.1
US
CPI Core Index SA
Jun
229.916
229.446
EC
PMI Services
Jul A
--
47.1
US
Industrial Production
Jun
0.40%
-0.10%
JN
Jul
--
46.2
US
Capacity Utilization
Jun
79.20%
79.00%
CH
Small Business Confidence g Economic Index
US
NAHB Housing Market Index
Jul
30
29
HK
Exports YoY%
Jun
--
5.20%
UK
CPI (YoY)
Jun
2.40%
2.80%
TH
Customs Exports (YoY)
Jun
4.50%
7.68%
UK
RPI (YoY)
Jun
2.80%
3.10%
CH
HSBC Flash Manufacturing PMI
Jul
--
48.2
GE
Zew Survey (Current Situation)
Jul
21.1
33.2
EC
ZEW Survey (Econ. Sentiment)
Jul
-22.3
-20.1
GE
ZEW Survey (Econ. Sentiment)
Jul
-19.6
-16.9
SI
Electronic Exports (YoY)
Jun
1.60%
3.90%
SI
Non-oil Domestic Exports (YoY)
Jun
6.80%
3.20%
Jun
4.90%
-4.80%
US
New Home Sales MoM
Jun
-0.40%
7.60%
US
Housing Starts MOM%
AU
Consumer Prices (YoY)
2Q
--
1.60%
UK
Bank of England Minutes
AU
Conference Board Leading Index
May
-1.40%
UK
Jobless Claims Change
Jun
6.1K
6.9K
GE
IFO - Business Climate
Jul
--
105.3
JN
Machine Tool Orders (YoY)
Jun F
-15.50%
-15.50%
GE
IFO - Current Assessment
Jul
--
113.9
CH
China June Property Prices
GE
IFO - Expectations
Jul
--
97.3
UK
GDP (YoY)
2Q A
--
-0.20%
MA
CPI YoY
Jun
1.60%
1.70%
SK
SK Consumer Confidence
Jul
--
101
US
Fed's Beige Book
TH
Benchmark Interest Rate
Jul 25
--
3.00%
US
Durable Goods Orders
Jun
0.50%
1.10%
US
Initial Jobless Claims
41104
386K
352K
US
Initial Jobless Claims
Jul 21
--
--
US
Continuing Claims
41097
3314K
3313K
US
Kansas City Fed Manf. Activity
Jul
--
3
US
Philadelphia Fed.
Jul
-7
-16.6
GE
GfK Consumer Confidence Survey
Aug
--
5.8
UK
Retail Sales Ex Auto Fuel(YoY)
Jun
2.20%
2.70%
US
Durables Ex Transportation
Jun
--
0.40%
UK
Retail Sales w /Auto Fuel (YoY)
Jun
1.60%
2.10%
US
Cap Goods Orders Nondef Ex Air
Jun
--
1.60%
EC
Euro-Zone Current Account nsa
May
-2.5B
1.3B
US
Cap Goods Ship Nondef Ex Air
Jun
--
0.40%
EC
ECB Euro-Zone Current Account SA
May
10.9B
5.5B
SK
GDP (YoY)
2Q P
2.40%
2.80%
HK
Composite Interest Rate
Jun
0.42%
0.39%
6.60%
GE
Producer Prices (MoM)
Jun
--
-0.30%
Jun
--
-3.04%
SI
Industrial Production YoY
Jun
3.00%
NZ
RBNZ Official Cash Rate
Jul 26
--
2.50%
PH
Overnight Borrow ingRate
Jul 26
--
4.00%
US
GDP QoQ (Annualized)
2Q A
1.50%
1.90%
US
Personal Consumption
2Q A
--
2.50%
CH
MNI July Flash Business Sentiment Survey
US
Core PCE QoQ
2Q A
--
2.30%
TA
Export Orders (YoY)
US
U. of Michigan Confidence
Jul F
73
72
GE
Consumer Price Index (YoY)
Jul P
--
1.70%
TA
Leading Index (MoM)
Jun
--
0.50%
TH
Total Capacity Utilization ISIC
Jun
--
75.9
TH
Mfg. Production Index ISIC NSA (YoY)
Jun
--
5.53
JN
Natl CPI YoY
Jun
--
0.20%
Previous data are for the preceding period unless otherw ise indicated
Previous data are for the preceding period unless otherw ise indicated
Data are % change on preivous period unless otherw ise indicated
Data are % change on preivous period unless otherw ise indicated
p- preliminary data, f- final data, sa - seasonally adjusted
p- preliminary data, f- final data, sa - seasonally adjusted
YoY - year on year, MoM - month-on-month
YoY - year on year, MoM - month-on-month
Source: Bloomberg, Standard Chartered
6
Weekly Market View
3 - 12 Month Market Outlook Central bank policy rates Spot
Q3 2012
Q4 2012
Q1 2013
Q2 2013
Q3 2013
Q4 2013
US
0.25
0-0.25
0-0.25
0-0.25
0-0.25
0-0.25
0-0.25
Europe
0.75
0.75
0.75
0.75
0.75
0.75
0.75
UK
0.50
0.50
0.50
0.50
0.50
0.50
0.50
Japan
0.10
0.10
0.10
0.10
0.10
0.10
0.10
Australia
3.50
3.00
3.00
3.00
3.00
3.25
3.75
China
6.00
5.75
5.75
5.75
5.75
6.00
6.50
Taiwan
1.88
1.88
2.00
2.00
2.13
2.25
2.38
Malaysia
3.00
3.00
3.00
3.00
3.25
3.25
3.50
Indonesia
5.75
5.75
5.75
5.75
5.75
6.00
6.25
South Korea
3.00
2.75
2.75
2.75
2.75
2.75
2.75
India
8.00
8.00
8.00
7.75
7.50
7.25
7.00
Philippines
4.00
4.00
4.00
4.00
4.00
4.25
4.50
Thailand
3.00
3.00
3.00
3.00
3.00
3.25
3.75
Forex EUR/USD
Spot
Q3 2012
Q4 2012
Q1 2013
Q2 2013
Q3 2013
Q4 2013
1.23
1.18
1.22
1.25
1.25
1.28
1.30
GBP/USD
1.57
1.52
1.55
1.58
1.62
1.64
1.63
USD/JPY
78.79
79.00
82.00
83.00
84.00
85.00
85.00
USD/CAD
1.01
1.05
1.02
1.03
1.00
0.98
0.98
USD/CHF
0.98
1.02
0.98
0.96
0.97
0.98
1.00
AUD/USD
1.04
0.99
1.03
1.03
1.04
1.05
1.07
NZD/USD
0.80
0.76
0.77
0.78
0.82
0.84
0.86
USD/CNY
6.37
6.360
6.295
6.275
6.255
6.215
6.175
USD/SGD
1.25
1.27
1.24
1.22
1.23
1.21
1.18
USD/MYR
3.15
3.20
3.10
3.05
3.15
3.10
3.00
USD/IDR
9460
9,500
9,300
9,100
9,300
9,200
9,000
USD/KRW
1141
1,120
1,100
1,070
1,070
1,060
1,040
USD/TWD
29.97
29.60
29.00
28.70
28.50
28.30
28.50
USD/INR
55.14
56.00
55.50
55.00
57.50
56.00
55.00
USD/THB
31.67
31.50
31.10
30.60
31.40
31.00
30.60
USD/PHP
41.75
41.75
40.50
40.00
41.00
40.50
39.50
Q3 2012
Q4 2012
Q1 2013
Q2 2013
Q3 2013
Q4 2013
1,750
1,900
-
-
-
Commodities Spot Gold
1582.45
1,700
Silver
27.26
32
33
35
-
-
-
WTI Crude Oil
92.00
94
101
103
-
-
-
Copper
7730.00
7,800
8,500
9,000
-
-
-
Aluminium
1944.00
2,000
2,100
2,200
-
-
-
Corn
785.50
700
750
700
-
-
-
Soybeans
1656.50
1,500
1,575
1,400
-
-
-
Wheat
933.00
755
735
700
-
-
-
Source: Bloomberg, Standard Chartered Global Research (20 July2012 Economics Weekly publication) * Period averages for each quarter.
7
Weekly Market View Disclosure Appendix This document is not research material and it has not been prepared in accordance with legal requirements designed to promote the independence of investment research and is not subject to any prohibition on dealing ahead of the dissemination of investment research. This document does not represent the views of Standard Chartered Bank, particularly those of the Global Research function. Standard Chartered Bank is incorporated in England and Wales with limited liability by Royal Charter 1853, Reference number ZC 18. The Principal Office of the Company is situated in England at 1 Aldermanbury Square London EC2V 7SB. Standard Chartered Bank is authorised and regulated by the Financial Services Authority under FSA register number 114276. In Dubai International Financial Centre (“DIFC”), the attached material is circulated by Standard Chartered Bank DIFC on behalf of the product and/or Issuer. Standard Chartered Bank DIFC is regulated by the Dubai Financial Services Authority (DFSA) and is authorised to provide financial products and services to persons who meet the qualifying criteria of a Professional Client under the DFSA rules. The protection and compensation rights that may generally be available to retail customers in the DIFC or other jurisdictions will not be afforded to Professional Clients in the DIFC. Banking activities may be carried out internationally by different Standard Chartered Bank branches, subsidiaries and affiliates (collectively “SCB”) according to local regulatory requirements. With respect to any jurisdiction in which there is a SCB entity, this document is distributed in such jurisdiction by, and is attributable to, such local SCB entity. Recipients in any jurisdiction should contact the local SCB entity in relation to any matters arising from, or in connection with, this document. Not all products and services are provided by all SCB entities. This document is being distributed for general information only and it does not constitute an offer, recommendation, solicitation to enter into any transaction or adopt any hedging, trading or investment strategy, in relation to any securities or other financial instruments. This document is for general evaluation only, it does not take into account the specific investment objectives, financial situation, particular needs of any particular person or class of persons and it has not been prepared for any particular person or class of persons. Opinions, projections and estimates are solely those of SCB at the date of this document and subject to change without notice. Past performance is not indicative of future results and no representation or warranty is made regarding future performance. Any forecast contained herein as to likely future movements in rates or prices or likely future events or occurrences constitutes an opinion only and is not indicative of actual future movements in rates or prices or actual future events or occurrences (as the case may be). This document has not and will not be registered as a prospectus in any jurisdiction and it is not authorised by any regulatory authority under any regulations. SCB makes no representation or warranty of any kind, express, implied or statutory regarding, but not limited to, the accuracy of this document or the completeness of any information contained or referred to in this document. This document is distributed on the express understanding that, whilst the information in it is believed to be reliable, it has not been independently verified by us. SCB accepts no liability and will not be liable for any loss or damage arising directly or indirectly (including special, incidental or consequential loss or damage) from your use of this document, howsoever arising, and including any loss, damage or expense arising from, but not limited to, any defect, error, imperfection, fault, mistake or inaccuracy with this document, its contents or associated services, or due to any unavailability of the document or any part thereof or any contents. SCB, and/or a connected company, may at any time, to the extent permitted by applicable law and/or regulation, be long or short any securities, currencies or financial instruments referred to on this document or have a material interest in any such securities or related investment, or may be the only market maker in relation to such investments, or provide, or have provided advice, investment banking or other services, to issuers of such investments. Accordingly, SCB, its affiliates and/or subsidiaries may have a conflict of interest that could affect the objectivity of this document. This document must not be forwarded or otherwise made available to any other person without the express written consent of SCB. Copyright: Standard Chartered Bank 2012. Copyright in all materials, text, articles and information contained herein is the property of, and may only be reproduced with permission of an authorised signatory of, Standard Chartered Bank. Copyright in materials created by third parties and the rights under copyright of such parties are hereby acknowledged. Copyright in all other materials not belonging to third parties and copyright in these materials as a compilation vests and shall remain at all times copyright of Standard Chartered Bank and should not be reproduced or used except for business purposes on behalf of Standard Chartered Bank or save with the express prior written consent of an authorised signatory of Standard Chartered Bank. All rights reserved. © Standard Chartered Bank 2012.
THIS IS NOT A RESEARCH REPORT AND HAS NOT BEEN PRODUCED BY A RESEARCH UNIT.
8