Literature Review of HOV Lane Schemes by C Dixon and K Alexander Issue 2 Unpublished Project Report UPR/T/002/05 3/326 Task 45
TRL Limited
UNPUBLISHED PROJECT REPORT UPR/T/002/05
LITERATURE REVIEW OF HOV LANE SCHEMES ISSUE 2
by C Dixon and K Alexander (TRL Limited)
Prepared for: Project Record: Client:
3/326 Task 45: Development of Monitoring Requirements for M1 HOV Pilot SSR Division, Highways Agency (Mr R Stewart)
Crown Copyright March 2005. This report, prepared for SSR Division, Highways Agency, must not be referred to in any publication without the permission of the Highways Agency. The views expressed are those of the author and not necessarily those of the Highways Agency.
Approvals Project Manager Quality Reviewed This document has been quality reviewed. Signed copies are available on request.
This report has been produced by TRL Limited as part of a Contract placed by the Highways Agency. Any views expressed are not necessarily those of the Highways Agency.
TRL is committed to optimising energy efficiency, reducing waste and promoting recycling and re-use. In support of these environmental goals, this report has been printed on recycled paper, comprising 100% postconsumer waste, manufactured using a TCF (totally chlorine free) process.
CONTENTS
EXECUTIVE SUMMARY
1
1.
INTRODUCTION
3
2.
USA
5
2.1
2.2 2.3 2.4 2.5 2.6 2.7
3.
UK 3.1 3.2
6.
THE REST OF EUROPE
21
4.1 4.2 4.3
SPAIN NORWAY AUSTRIA
21 21 23
OTHER SCHEMES
24
5.1 5.2
CANADA AUSTRALIA
24 25
CONCLUSIONS
28
6.1
28 28 29 29 30 31 32
6.2 6.3 6.4 6.5 6.6
7.
16 16 17 18 18 18 19 19 20
3.4
5.
5 5 5 5 6 6 7 7 9 12 13 15 15
A647, LEEDS A4174, BRISTOL 3.2.1 Evaluation 3.2.2 Marketing M4 BUS LANE 3.3.1 Signing 3.3.2 Evaluation PROPOSED SCHEMES
3.3
4.
DESIGN OF SCHEMES 2.1.1 Separated flow HOV lanes 2.1.2 Contra-flow HOV lanes 2.1.3 Concurrent flow HOV lanes 2.1.4 Signing 2.1.5 Vehicles allowed 2.1.6 Managed HOV lanes SAFETY EVALUATION ENFORCEMENT MARKETING AND PUBLIC PERCEPTION ENVIRONMENTAL ISSUES INTEGRATION
SCHEME DESIGN 6.1.1 Signing SAFETY ENFORCEMENT EVALUATION PUBLICITY AND MARKETING SUMMARY
REFERENCES
TRL Limited
33
UPR/T/002/05 (Issue 2)
LITERATURE REVIEW OF HOV LANE SCHEMES EXECUTIVE SUMMARY To date, High Occupancy Vehicle (HOV) lanes have only been implemented in the UK on short sections of dual carriageway (in Leeds and South Gloucestershire). The Highways Agency is looking to pilot an HOV lane on the strategic road network. HOV lanes have been used successfully in other countries (primarily in the USA, but also in Spain and Australia). A number of potential UK sites were identified including the southbound section of the M1 between Junctions 10 and 7. It has subsequently been decided that an HOV lane should be implemented on both carriageways of the M1 between Junctions 7 and 10 because of the favourable business case. The HOV lane will be implemented as part of the planned widening of this section of motorway, which is scheduled to commence in November 2005. This report reviews existing schemes, both within the UK and overseas. The objective of the review is to identify areas where previous experience could be relevant to the design, operation and monitoring of the M1 HOV scheme. Examples of these areas are: • The position of the lane on the road, lane markings and signing. • The types of vehicles allowed in the lane and the times of operation. • Enforcement policies and techniques. • Details of any monitoring carried out, including the types and quantity of data collected and the methodology for analysing the data. • Publicity for and marketing of the schemes. DESIGN OF SCHEMES It was found that there is no standard design for the layout of HOV lanes or their operation. The type of layout, either concurrent, contra-flow or separated, and whether the HOV lane is an additional lane or uses an existing lane, depends on the amount of road space available. The times of operation depend on the traffic patterns including the direction of peak flows. The types of vehicles allowed in the lane depend on the vehicle composition, and the minimum occupancy of a vehicle depends on the amount of peak traffic. However, for all schemes identified, buses are always allowed to use the HOV lane, and HGVs are consistently banned from the HOV lane. Integration with the surrounding network through the implementation of public transport systems is considered key for the success of HOV schemes. SAFETY The safety of American concurrent HOV lanes has been studied. Results showed that an eight foot buffer1 raised by six inches was the safest layout of those evaluated. Narrower buffers (not raised) typically cause in increase in accident rates as did wider buffer lanes. Wide 1
Separated flow HOV lanes are separated from the general purpose (GP) lanes by either a physical barrier or a wide, painted strip of road, known as a buffer.
TRL Limited
1
UPR/T/002/05 (Issue 2)
buffers can substantially separate traffic flows but may be mistaken for running lanes. Therefore, the USA research does not recommend wide (non-raised) buffers. EVALUATION If the purposes of the scheme are not clearly defined at the outset, there is a risk that inadequate data will be collected. Therefore meaningful conclusions cannot be made, and it will not be possible to prove whether the goals have been met. It is also important to consider the surrounding network and general purpose (GP) lanes when assessing the impact of an HOV lane. There were no standard methods for evaluating HOV schemes. However, ongoing monitoring and assessment is vital for continuing successful operation of HOV lanes as congestion increases. Knowing the effectiveness of a HOV lane will help with future policies, e.g. increasing the minimum number of passengers, imposing time restrictions or implementing HOV schemes on other roads. Public opinion surveys after the opening of a scheme may highlight ways in which the number of users can be increased. No information on cost benefit analysis has been found for the schemes reviewed. ENFORCEMENT HOV lanes must be enforced for them to be successful. Enforcement techniques include automated and manual video surveillance, automatic vehicle identification, infrared technology and patrols as well as self-enforcement. Many areas have set up the HERO programme where motorists are encouraged to report misuse of the HOV lanes. The penalties should be high enough to discourage violation. In Georgia, USA, fines increase from $75, for the first offence, to $150 plus one point on the driver’s licence, for the fourth offence. Fines for HOV lane violations in Austria are €21. MARKETING AND PUBLIC PERCEPTION Public awareness and understanding of HOV lanes and their purposes is key for their acceptance and continued legal use. It is vital that proposed HOV schemes be extensively marketed and the public are aware of how to use the lanes and also what changes in traffic behaviour are expected. It is important that the public be given a complete picture of any benefits or disbenefits. Ideally marketing should begin well in advance of a scheme’s opening. Aims of marketing campaigns have been to gain support from stakeholders and to encourage potential HOV users. Marketing campaigns for those schemes reviewed in the literature have included poster, newspaper, radio and television advertising campaigns. Information was also sent to local residents.
TRL Limited
2
UPR/T/002/05 (Issue 2)
LITERATURE REVIEW OF HOV LANE SCHEMES 1.
INTRODUCTION
To date, High Occupancy Vehicle (HOV) lanes have only been implemented in the UK on short sections of dual carriageway (in Leeds and South Gloucestershire). The Highways Agency is looking to pilot an HOV lane on the strategic road network. HOV lanes have been used successfully in other countries (primarily in the USA, but also in Spain and Australia). A preliminary study into suitable locations for HOV lanes in the UK identified a number of potential sites including the southbound section of the M1 between Junctions 10 and 7. It has subsequently been decided that an HOV lane should be implemented on both carriageways of the M1 between Junctions 7 and 10 because of the favourable business case. The HOV lane will be implemented as part of the planned widening of this section of motorway, which is scheduled to commence in November 2005. A work package has been established to review the objectives of installing the HOV lane, to determine a potential assessment strategy for the HOV Pilot scheme, to produce a draft specification describing the recommended monitoring requirements, and to carry out a systematic review of existing HOV schemes. This report presents the findings of the review of existing schemes, both within the UK and overseas. During the feasibility study for the HOV Pilot scheme, information was obtained on several existing HOV schemes (Kellogg, Brown and Root (KBR), 2004). Additional information on these schemes has been obtained and further schemes, not identified during the feasibility study, have been discovered. An international literature review has been carried out into previous work that has been undertaken on the implementation and evaluation of HOV lanes. The objective of the review is to identify areas where previous experience could be relevant to the design, operation and monitoring of the M1 HOV scheme. Examples of these areas are: • The position of the lane on the road, lane markings and signing. • The types of vehicles allowed in the lane and the times of operation. • Enforcement policies and techniques. • Details of any monitoring carried out, including the types and quantity of data collected and the methodology for analysing the data. • Publicity for and marketing of the schemes. The literature for this study has been collected via the TRL Information Centre, which contains bibliographic references and abstracts of English and foreign language articles from journals, books and research reports. It is the English language version of the world-wide International Transport Research Documentation (ITRD) database and therefore regularly receives material from the USA, Australia, Scandinavia, the Netherlands, Canada and other countries in addition to the UK input. The internet has also been used to find articles containing key phrases relating to the field. The amount of literature found on issues relating to HOV lanes has been huge, and much of the research is American based. Much of the information found is general HOV information from local transportation authority websites and online magazine articles. However, a large proportion of research has been done by the
TRL Limited
3
UPR/T/002/05 (Issue 2)
Federal Highway Administration (FHWA) and various universities and these are the reports this literature review has largely focused on. The majority of the information found is research of American HOV schemes. Section 2 focuses on the design, safety, evaluation, enforcement, marketing, public perception and environmental affects of various American schemes. This section also considers recommendations for the integration of American HOV schemes. The UK schemes, including the M4 bus lane, are discussed in Section 3. Other schemes in the rest of Europe and worldwide are discussed in Sections 4 and 5. The conclusions and summary of the literature review are given in Section 6.
TRL Limited
4
UPR/T/002/05 (Issue 2)
2.
USA
The first HOV lanes were opened in Washington, D.C., and Virginia in 1969 (Jasek, 2002). The FHWA website (FHWA, 2005a) shows that there are 136 HOV schemes in the USA, in 19 different states, covering 1139 miles (1256 lane miles), and a further 105 proposed sites covering 966 miles (1970 lane miles). 2.1
DESIGN OF SCHEMES
There are three designs of HOV lanes used in the USA (Jasek, 2002). These are separated flow, contra-flow and concurrent flow lanes. 2.1.1
Separated flow HOV lanes
Separated flow HOV lanes are separated from the general purpose (GP) lanes by either a physical barrier or a very wide, painted strip of road, known as a buffer. These HOV lanes are most commonly reversible flow lanes to help ease the morning traffic into, and the evening traffic out of an area. They are also used for two-way traffic, and often have their own merge/ diverge ramps. 2.1.2
Contra-flow HOV lanes
Contra-flow HOV lanes use an existing lane on the off-peak carriageway for traffic in the peak direction. This is usually the offside lane. A moveable barrier is used to separate the contra-flow and GP lanes during peak hours. This type of lane is generally a bus only lane, however, HOV versions exist in several locations including Honolulu, New Jersey and Boston. Contra-flow lanes generally operate in peak hours only. Often overhead signals on gantries are used to indicate that the lane is in operation. Signs carrying information on the operating times are located at merge points to the road and also reminders are placed along the carriageway. 2.1.3
Concurrent flow HOV lanes
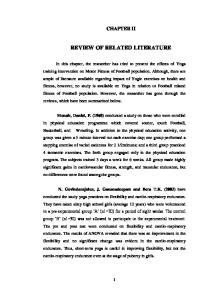
The most common design of HOV lane is a concurrent flow lane. This is a lane in the same direction of travel as the GP lanes on the same carriageway. Like the contra-flow lanes, it is usually the offside lane. It is not physically separated from the GP lanes, but rather there is a narrow buffer, or markings on the road. Concurrent flow lanes are often referred to as diamond lanes because of the markings on the road (see Figure 1).
TRL Limited
5
UPR/T/002/05 (Issue 2)
Figure 1. A concurrent flow HOV lane in the offside lane (METRO, 2002a). This lane has no buffer.
Of the existing HOV lanes in the USA approximately 15% are separated flow, 5% contraflow and 80% concurrent flow lanes. Approximately 30% operate 24 hours a day (these are mainly concurrent lanes) and 70% are operational in either the morning peak or the evening peak period, or both. These details are summarised in Table 1. Full details of all the USA and Canadian sites can be found on the FHWA website (FHWA, 2005a).
Table 1. Types of HOV lanes in the USA
Type of HOV lane
Percentage of USA schemes (approximate)
Type of HOV lane
Percentage of USA schemes (approximate)
Separated flow
15%
24 hours a day
30%
Contra-flow
5%
Peak hours only
70%
Concurrent flow
80%
2.1.4
Signing
The signing of HOV lanes should be made as consistent as possible to avoid confusion. Sign legibility is important; they should be recognisable and easy to understand. The Georgia Department of Transportaion (GDOT) recommend that HOV signs are placed overhead where possible (GDOT, 2003a). 2.1.5
Vehicles allowed
Depending on the level of congestion experienced on the road, HOV lanes have different minimum occupancy requirements. Approximately 86% of HOV lanes are 2+ occupants per TRL Limited
6
UPR/T/002/05 (Issue 2)
vehicle lanes and the rest are for 3+ occupants only. Also, the type of vehicles allowed in the HOV lane varies. All the schemes allow buses and approximately 20% of the USA’s HOV lanes are bus only lanes. Most HOV lanes do not allow HGVs regardless of occupancy. Other HOV lanes allow under-occupied, ecologically friendly cars, such as electric vehicles, whilst other schemes insist that a vehicle must always meet the minimum occupancy requirement regardless of the vehicle type. In 1986, the FHWA carried out a survey of HOV lanes (Jasek, 2002). The main reasons for implementing restrictions on types of vehicle and minimum occupancy included: •
To improve highway operations;
•
To reduce accidents.
2.1.6
Managed HOV lanes
Managed HOV lanes are those with, for example, restrictions on minimum vehicle occupancy dependent on time of day. The I-10W Katy Transitway in Houston is restricted to 3+ vehicles during peak hours and 2+ at all other times. When the number of occupants required for an HOV vehicle is increased from 2+ to 3+ this causes 80% of original HOVs to return to the GP lanes (Martin et al., 2004). Some HOV lanes include tolls (known as Higher Occupancy Toll or HOT lanes) for vehicles under the minimum occupancy that wish to use the lane. Some bridges in San Francisco waive tolls for HOVs in peak hours. The idea of a HOT lane is to improve lane utilization by selling any unused capacity. To be successful they should be implemented along with an existing HOV lane as a HOT lane is not self-supporting. Dynamic tolls ensure that the extra traffic paying to use the HOV lane will not exceed the excess capacity. As the traffic flow on the HOV lane increases, the toll will also increase thus reducing the number of drivers willing to pay. Dynamic tolls can vary as often as every five minutes. Concerns of legality (legislation is needed to criminalise non-payment), equity and public acceptance (users may feel they are being taxed twice to use a road) are associated with HOT lanes (Jasek, 2002). It is not recommended that HGVs be allowed to use the excess capacity on the HOV lanes (Jasek, 2002). 2.2
SAFETY
The safety of several concurrent HOV lanes was investigated on behalf of the FHWA (Case, 1995). The purpose of the study was to determine the safety effects of HOV implementations and to recommend the safest measures to be used to separate HOV lanes from general purpose traffic. The different layouts considered were: • 0-2 foot buffer (Figure 2). • 3-8 foot buffer (Figure 3). • 8 foot buffer. The buffer is raised by 6 inches from the adjacent lanes. • 13 foot (full) buffer.
TRL Limited
7
UPR/T/002/05 (Issue 2)
Figure 2. HOV lane with 0-2 foot buffer (Case, 1995).
Figure 3. HOV lane with 4 foot buffer (Case, 1995).
It should be noted that the results for the last three layout designs (not including the 0-2 foot buffer) are based on only one freeway each. It was concluded that only the 8 foot buffer, with a buffer height of 6 inches, (Alameda 580, San Francisco) resulted in a drop in accident rates similar in magnitude to that associated with the addition of a GP lane. (The construction of an extra GP lane, by narrowing the shoulder or existing lanes, is reported in the USA to cause the accident rate to drop by 29% on average.) The traditional 0 to 2 foot buffer did not result in a drop in accident rates. Moreover, this type of HOV layout typically caused an increase in accident rates. This was TRL Limited
8
UPR/T/002/05 (Issue 2)
also evident in the evening peak period for the 13 foot buffer (I-10, San Bernardino Freeway, LA). The 3 to 8 foot buffer (I-405, LA area, Orange County) results were inconclusive due to problems inherent in the use of the control sections. The Texas Transport Institute (TTI) (Jasek, 2002) suggested that an HOV lane should not increase the accident rate and, furthermore, the accident rate should be lower on such lanes. However, if the HOV lane is constructed from an existing lane it may not be realistic to assume that the accidents rate will drop. Wide buffers can substantially separate traffic flows and provided refuge areas for breakdowns. However, buffers greater than four feet are not recommended as enforcement may prove a problem; motorists may mistake it for a running lane (Fuhs, 1990). A 25mph difference between the traffic speeds in consecutive lanes may pose problems for vehicles entering the HOV lane (Stokes et al., 1984). “When undue deceleration or acceleration by leaving or entering traffic takes place directly on the highway… it disrupts the flow of through traffic, and often is hazardous” (American Association of State and Transportation Officials, 1990). Also the ability to continuously merge and diverge to and from an HOV lane can increase the accident rate and may create enforcement problems (Fuhs, 1990 and Stokes et al., 1984). It is often noted that HOV traffic does not operate at the high speeds expected relative to the volume of traffic. Free flowing HOV traffic next to a congested GP lane is usually travelling at less than the speed limit. This is known as a “sympathy speed” (Martin et al., 2004). The HOV driver is unwilling to driver faster because of the uncomfortable difference in speeds. On concurrent HOV lanes with a narrow buffer, a car from the GP lane may enter the HOV lane at any time. The drivers in the HOV lane may drive at a reduced speed in order to account for any sudden merging from the GP lane. The greater the separation between the GP and HOV lanes, the less likely HOV vehicles are to reduce their speed ‘sympathetically’. 2.3
EVALUATION
The methodology used to assess and evaluate HOV lanes in the USA is often not reported in the literature. In particular, the quantities of data collected are not specified, nor is the method of analysing the data. However, traffic volume, vehicle occupancy, speeds, travel times and their reliability, throughput of HOV lanes versus GP lanes, violations and public attitudes towards the scheme are typically assessed. Several schemes were analysed by Martin et al. (2004). These are outlined below. In May 2001, 16 miles of 24-hour HOV lane were opened on the I-15 in the Salt Lake City Valley, Utah. Both northbound and southbound carriageways included a single-lane HOV lane separated from four GP lanes by striping. HOVs (with 2+ occupants) are allowed continuous entrance and exit from the GP lanes, with one HOV-only merge/ diverge ramp on the southbound carriageway. Martin et al. (2004) undertook a two year study evaluating the HOV lane performance. Their findings indicated that the number of people using the HOV lane during the afternoon peak period was equal to that of a GP lane, but the HOV lanes carried 66% less vehicles. However, for the rest of the day, the GP lanes carried more people than the HOV lanes. During the first year of the scheme the average vehicle occupancy on the surrounding network (the I-215), and on non-HOV sections of the I-15, remained the same as before the opening of the HOV lane. In the HOV lane sections of the I-15, the overall vehicle occupancy increased by 17%, TRL Limited
9
UPR/T/002/05 (Issue 2)
from 1.1 to 1.3 people per vehicle. This indicated that the HOV lane had encouraged people to car share. The HOV lanes showed a 13% travel time saving in the morning peak period and a 30% saving during the afternoon peak period. Moreover, the HOV lane travel times were more consistent and reliable than those associated with GP lane travel. National HOV violation rates are between 5% and 10%. After an initial reduction in violation rates the HOV lanes on the I-15 stabilised at 5% to 13%, with 20% violation rates at the HOV-only merge/ diverge ramp. There are over 1060 miles of HOV lane in California carrying an average of 2500 people per hour in peak hours. However, in terms of number of vehicles, this is only two thirds of the capacity of the HOV lanes. State wide car sharing information is unavailable but regional data shows that HOV lanes do encourage car sharing. The I-10W Katy Transitway in Houston originally opened a HOV 2+ lane, which, after monitoring, was increased to 3+ during peak hours. Conversely the HOV lane on the I-66 in North Virginia was originally opened as a 3+ lane but was later relaxed to 2+ after very few motorists took advantage of the lane. This increased the vehicles in the HOV lane by 60% (1,700 veh/lane/hr). In Oregon, the I-5 was evaluated before and after the introduction of an HOV lane. This concluded that HOV users saved eight to ten minutes along the entire length of the scheme. The HOV lane carried 2,600 people per hour compared to 1,700 carried by a GP lane. Violation rates were 8%, which is within the national average. Seattle’s Puget Sound area has more than 200 miles of HOV lanes. Over 800 miles are planned by 2030. Congestion in this area occurs for 14 hours a day. Around midday the HOV lanes carry the same number of people as the GP lanes in, on average, 700 to 900 vehicles per hour. In November 1998, two HOV schemes in New Jersey were decommissioned due to opposition. The I-287 HOV lane was under-used (400 vehicles per hour) and thus did not solve the congestion problem in the area. Although the I-80 HOV lane was heavily used (more than 1000 vehicles per hour), it was also closed due to the heightened political opposition. The percentage of traffic that these figures represent are not given. There are several other reasons why an HOV lane fails to produce time savings. For example, the HOV lane demand may be too high, thus the lane becomes congested (in this case the minimum vehicle occupancy might be raised), or the merge/diverge area becomes congested causing tailbacks along the HOV lane (METRO, 2002). The above schemes are summarised in Table 2.
TRL Limited
10
UPR/T/002/05 (Issue 2)
Table 2. Summary of the USA HOV Schemes.
Scheme
Design •
In PM HOV lane carried same number of people as GP lane by 66% less vehicles;
•
Vehicle occupancy on I-15 increased by 17% and remained constant on surrounding network during 1st year;
•
13% travel time saving in AM and 30% in PM;
•
Resulting travel times were more reliable.
•
45% of people using the Transitway are bus users.
2+ occupants
•
The change from 3+ to 2+ increased usage of the HOV lane by 60% (1,700 veh/lane/hr).
(no details given)
•
Drivers save 8-10 minutes along the length of the scheme;
•
HOV lane carries 65% more people than a GP lane;
•
Low violation rates.
No longer in use
•
Decommissioned as lane use by only 400veh/hour.
No longer in use
•
Lane used by 1000veh/hr but decommissioned due to public disillusionment after I-287 failure.
I-15
Separated HOV lane
Salt Lake City
2+ occupants 24 hours operation
I-10W Katy Transitway
Results of Scheme
2+ outside peak hours 3+ during peak hours
I-66 North Virginia I-5 Oregon
I-287 New Jersey I-80 New Jersey
The Texas Transport Institute (TTI) conducted a survey of HOV lane projects. Turnbull et al. (1991) reviewed the current before and after evaluation methods in order to provide an overview of commonly used measures and techniques. However, no standard methods were apparent. HOV lane evaluation methods were extremely varied with adequate before and after data not always being collected. Initial evaluations may have been carried out shortly after a scheme had opened, yet ongoing monitoring may not have been done. On many HOV schemes formal evaluations have never been done, nor are they likely to be in the future. If the purposes of the scheme are not clearly defined at the outset there is a risk that inadequate data will be collected, the goals will be unachievable and meaningful conclusions cannot be made. It is also important to consider the surrounding network and GP lanes when assessing the impact of an HOV lane. Turnbull et al. (1991) suggest that a comparison between what the effect of adding an extra lane would have been, rather than the HOV lane, may be useful. Many factors such as which vehicles are allowed to use the HOV lane, the vehicle occupancy required, hours of operation, enforcement techniques, incident management and ingress/ egress points all need to be considered. In addition to flows, times, speeds etc (see above)
TRL Limited
11
UPR/T/002/05 (Issue 2)
measured, the schemes reviewed by Turnbull et al. (1991) used the following methods to evaluate HOV lanes: • Monitoring of bus schedule adherence; • Monthly bus data (including passenger levels, operating statistics, revenues and costs); • Park and ride counts; • Changes in commuter behaviour and reasons; • Changes in public perceptions; • Vehicle occupancy counts; • Accidents; • Classification of types of vehicles; • Licence plate surveys; • Violation rates (whether these are repeat offences); • Safety; • User and non user surveys. Turnbull et al., suggest the following approach to evaluating HOV lanes: • Clear articulation of project goals and objectives; • Identification of measures of effectiveness; • Identification of information needed; • Development of the study design; • Conduct “before” data collection; • Conduct “after” data collection and evaluation; • Ongoing monitoring and evaluation. More details can be found in Suggested Procedures for Evaluating the Effectiveness of Freeway HOV Facilities (Turnbull et al., 1991). Ongoing monitoring and assessment is vital for continuing successful operation of HOV lanes as congestion increases. Knowing the effectiveness of a HOV lane will help with future policies, e.g. increasing the minimum number of passengers, imposing time restrictions or implementing HOV schemes on other roads (Turnbull et al., 1991). 2.4
ENFORCEMENT
Violation rates increase where GP and HOV lanes merge and at HOV-only diverge/merge areas. Getting into the desired lane a little too early is not perceived by drivers to be a true violation. Concurrent flow HOV lanes generally have the highest violation rates and therefore need greater levels of enforcement (Jasek, 2002). Low violation rates are a good reflection of the public’s acceptance of a scheme. Also a high rate of violations may discourage legal users, if they feel the benefits of an HOV lane have TRL Limited
12
UPR/T/002/05 (Issue 2)
been reduced. However, proper use of HOV lanes, particularly concurrent lanes with continuous ingress and egress for HOVs, is difficult to enforce. A visible enforcement presence must be maintained. Where practical (i.e. for separated flow lanes), enforcement officers should be located at terminal points. The TTI (Jasek, 2002) lists the elements critical for enforcement to be successful: • The agency responsible for enforcement must have legal authority to do so. • The penalties associated with violation must be appropriate. • Any penalties should be high enough to discourage violation. If the penalties are not high enough, repeat violations might not be deterred, and in effect drivers could use a low fine as a toll. The Department of Motor Vehicle Safety (DMVS) is one agency responsible for enforcing the HOV lane restrictions in Georgia (Department of Motor Vehicle Safety, 2004). Fines and penalties for HOV violations are: •
First Offence: $75 maximum (plus court fees);
•
Second Offence: $100 maximum (plus court fees);
•
Third Offence: $150 maximum (plus court fees);
•
Fourth Offence: $150 maximum (plus court fees), and one point on driver’s licence.
Enforcement techniques include automated and manual video surveillance, automatic vehicle identification, infrared technology and patrols as well as self-enforcement. Often local police have other duties to perform and so HOV violation may not be a high priority. Video surveillance can have added advantages when it comes to the prosecution of violators. Also video evidence can be sent to first time violators in order to deter repeat offences. Many areas (including Washington, D.C., Houston and Seattle) have set up the HERO programme where motorists are encouraged to report misuse of the HOV lanes. First time offenders are usually sent educational information on how to use the lanes properly. Further offences result in personalised letters recording the location and time of the violation. The aim of the HERO programme is not to prosecute the violators, but rather to educate them in the proper use of HOV lanes and to reduce the likelihood of repeat offences. During 2000, there was a 49% increase in violations citations on the HOV lanes in Puget Sound, Seattle. The HERO programme also saw an increase in the amount of reported violations. The decrease in repeat offenders is attributed to this programme. Exact figures are not reported. 2.5
MARKETING AND PUBLIC PERCEPTION
Public awareness and understanding of HOV lanes and their purposes is key for their acceptance and continued legal use. Many schemes in the USA have come under criticism from the public. This may be due to confusion caused by lack of education on HOV use, or limited knowledge of the scheme’s purpose. Therefore it is vital that proposed HOV schemes be extensively marketed and the public are aware of how to use the lanes and also what changes in traffic behaviour are expected.
TRL Limited
13
UPR/T/002/05 (Issue 2)
It is important that the public be given a complete picture of any benefits or disbenefits as, in the past, incorrect conclusions have been drawn from published articles where incomplete data has been given. This lack of data has been interpreted as a cover-up by the local authorities who may be thought of as trying to hide disbenefits of a scheme. Szoboszlay (1998 and 2000) criticised local transportation authorities for not publishing single occupancy vehicle (SOV) statistics. Szoboszlay reported that, on the Montague Highway, the number of SOVs per day increased by 4562 whereas the HOVs increased by 1207. The number of SOVs was not included in the Santa Clara County Transportation Agency (SCCTA) general plan for transportation (report T2010), thus giving the impression that the HOV increase was greater. Szoboszlay acknowledged that an increase in all types of vehicles would be expected after the adding of the extra (HOV) lane, but criticised the SCCTA for not giving all the information. In such cases, public opinion of a scheme may fall if it is felt that statistics are being manipulated. Several HOV lanes have been criticised for “empty-lane syndrome”, or perceived underutilisation where local road users saw the lanes as wasted road space (Martin et al., 2004). In November 1998, two HOV schemes in New Jersey were decommissioned. The I-287 closure was attributed to the lack of congestion in other lanes, thus there was no incentive to use the HOV lane. Although the I-80 HOV lane was heavily used, it was also closed due to the heightened political opposition. The public was not sufficiently prepared for the opening of these lanes, therefore an adequate market did not exist. After the failure of these HOV lanes, New Jersey started a large marketing campaign, through the media, to promote a new HOV lane. The idea was to increase public awareness and confidence in the HOV lane purpose, to publicise accurate expectations and to encourage car sharing. Television, radio, press conferences, mailings, fliers left on windscreens and information accompanying licence renewal forms were used in the campaign. Marketing for the Long Island Expressway HOV lane started far before the 1994 opening. The two aims of the marketing campaign were to gain support from stakeholders and to encourage potential HOV users. Both private and public interests were taken into account during the early planning stages in order to maximise support for the scheme. The opening of an HOV lane in Tennessee in 1993 was preceded by a successful poster, newspaper, radio and television advertising campaign. Information was also sent to the local residents. A public survey of the HOV lanes in Puget Sound, Seattle showed that 95% of HOV users thought the scheme was “a good idea” and 72% agreed with the introduction of the scheme. The survey identified key areas where the public wanted to see improvements. These included better enforcement and increased bus services (Martin et al., 2004). The marketing of HOV lanes is best presented to the public in terms of time saved, reliability of journey times and safety. Violation rates are a good reflection of the public’s acceptance of a scheme. However, these are often overestimated and as such the public feel that acceptance of the scheme is low. Commuters must be made aware of the purpose and expectations of the scheme in order to dismiss any misconceptions. They must also understand that violators will be prosecuted. Public surveys after the opening of a scheme will draw attention to why people are not using the HOV lanes, and may highlight ways in which the number of users can be increased. Ongoing monitoring and assessment of the HOV lanes is essential as it will aid continuous public acceptance of the scheme. TRL Limited
14
UPR/T/002/05 (Issue 2)
2.6
ENVIRONMENTAL ISSUES
HOV lanes are thought to show benefits for the environment because car sharing reduces fuel consumption and emissions. However, there may also be opposition against land use for the construction of extra lanes. In the mid 1990s several groups opposed the construction of an HOV lane in New York arguing that the widening of the road would encourage a greater dependence on vehicles and not be an efficient use of land. A media campaign against the HOV lane saw the Department of Transport being ordered to stop the project (Jasek, 2002). This opposition may have been avoided if a stronger, more sophisticated, marketing campaign had been in place. 2.7
INTEGRATION
The intention of HOV facilities is not to force individuals into making changes against their will. Rather, the objective is to provide a cost-effective travel alternative that a significant volume of commuters will find attractive enough to change from SOVs to HOVs (Turnbull, 1992). Successful HOV lanes must not simply divert existing HOVs from GP lanes to the HOV lanes, but must also encourage people to switch from SOVs to HOVs, resulting in a higher occupancy. Integration of alternative transport system, such as comprehensive bus services, may encourage people into the HOV lanes. “HOV lanes are most successful when complementary services… are incorporated into the network” (GDOT, 2003b). Park and ride facilities are convenient meeting points for car sharers. In America it has become quite common for people to ‘slug’ (Slug-Lines, 2004). This describes a form of casual car sharing much like hitch-hiking. People queue at designated spots (often known through word of mouth) to wait for a driver, wishing to use the HOV lane, also travelling in the same direction. This service is free to the passengers as the driver benefits from the use of the HOV lane.
TRL Limited
15
UPR/T/002/05 (Issue 2)
3.
UK
In the UK there are only two HOV lane schemes currently in use, both of which are on Aclass roads. Although not specifically an HOV lane, there is also a bus lane on the eastbound M4 between Heathrow and London. 3.1
A647, LEEDS
In Leeds, a GP lane in the nearside lane of the A647 (see Figure 4) has been redesignated an HOV 2+ lane (including buses, coaches, motorcycles, pedal cycles and 2+ vehicles, but not HGVs over 7.5Tonnes) and is in operation at peak periods only (between 07:00 to 10:00 and 16:00 to 19:00) (Department for Transport (DfT), 2005). The initiative was from Leeds City Council. This scheme is 1.5km long (in two lengths of inbound lane) on a 2km length dual carriageway. The scheme was opened in 1998.
Figure 4. The start of the Leeds HOV lane (Leeds City Council (LCC), 2002).
Advance signing is provided at the approach to the HOV lanes (see Figure 5). Traffic signal control is provided at the end of the HOV lane to manage merging traffic from both lanes.
TRL Limited
16
UPR/T/002/05 (Issue 2)
Figure 5. Leeds’ HOV lane signing (LCC, 2002).
The objectives of the scheme were to increase car occupancy by encouraging car sharing and to demonstrate the feasibility of such a scheme. Police enforcement lay-bys and speed cameras are in operation. Extensive monitoring has taken place in the form of flow measurements, vehicle occupancy, journey times, accident rates, enforcement, public attitudes and air quality. The results of monitoring have shown a reduction in inbound journey times for buses and other high occupancy vehicles of 4 minutes in the morning peak. A reduction in the inbound journey times for the GP lane of 1.5 minutes is reported. Increases have occurred, in bus patronage and average car occupancy, from 1.35 in May 1997, to 1.43 in June 1999 and to 1.51 in 2002 (DfT, 2005). There has also been a reduction in the number of accident casualties and a reported low level of violation (less than 6%). In the light of these results, the scheme has been deemed a success. 3.2
A4174, BRISTOL
Another scheme exists in the nearside lane of the A4174 Avon Ring Road at Hambrook, on the northern fringe of Bristol (see Figure 6). This 2+ HOV lane is approximately 1.75km in length (MRC, 2005). Opened in 1998, and later expanded in 2000, it reassigned a lane to HOVs from an existing dual carriageway road and operates during morning peak hours. This scheme allows buses and coaches, motorcycles and cycles in addition to high occupancy cars and vans, but not HGVs over 7.5 Tonnes.
TRL Limited
17
UPR/T/002/05 (Issue 2)
Figure 6. Signing on the A4172 (2carshare, 2005)
3.2.1
Evaluation
The peak hour average vehicle occupancy (AVO) has increased since the scheme was introduced, as shown in Table 3. Table 3. Average vehicle occupancy increase.
3+ occupants
2 occupants
SOV
Before
3%
17%
80%
After
2%
28%
70%
Traffic flows have increased by 40% since the scheme’s opening. Time saving benefits were approximately 30% in 1999 and 50% in 2000 and violations were approximately 7% in 2000 (MRC, 2005). Times and flows are not given; only percentages. 3.2.2
Marketing
A three-year marketing plan to increase car sharing has included roadside and media advertising, road-shows and employer incentives. South Gloucestershire Council have actively promoted their on-line car sharing scheme, www.2Carshare.com, along with the HOV marketing exercise. This has reportedly led to a marked increase of use of the web site. Enforcement is carried out by the police, and compliance is reported as good. 3.3
M4 BUS LANE
In June 1999, 6km of bus lane on the M4 began operation in the offside lane (see Figure 7). The scheme’s main objectives were to encourage the use of public transport, to reduce journey times of buses and increase safety on the M4 section. The scheme operates between junctions 3 and 2 on the M4 eastbound carriageway (into London) with speed restrictions of 50mph (40mph where the bus lane merges with the general purpose lanes). The bus lane is reserved for buses, coaches and taxis only. In July 2002, the speed restriction was raised from 50mph to 60mph (the 40mph limit at the merge area was retained). In addition, motorcycles were permitted to use the bus lane.
TRL Limited
18
UPR/T/002/05 (Issue 2)
Figure 7. The M4 bus lane (Rees et al., 2000)
3.3.1
Signing
The bus lane is distinguished by a red road surface, with the words “BUS LANE” at regular intervals (see Figure 7). There are also signs showing a picture of a bus, together with the word “Taxi” (in 2002, a picture of a motorcycle was added). For the first few weeks after the bus lane was first opened, EMS messages were displayed informing drivers that the bus lane was operational. 3.3.2
Evaluation
The first year of the scheme was monitored by Rees et al. (2000) using before and after data from the M4 and adjoining network. For each vehicle type the occupancy, flow and journey times were analysed. The main results were: • Average journey times during peak periods have decreased by 3 minutes for buses and 1 minute for cars. • Journey times in off-peak periods have increased because of the speed restrictions. • Journey times are more reliable. • There is an overall benefit of 200 person-hours per weekday. • There is a disbenefit of 350 person-hours per weekend day because of the speed restrictions. • The new road layout has eased the bottleneck where three lanes of traffic merged to two. Instead of queuing, traffic is now stop-start. TRL Limited
19
UPR/T/002/05 (Issue 2)
• The surrounding network has not been adversely affected. • On average, 3700 vehicles a day use the bus lane. Of these, 3100 are taxis, 500 are buses or coaches and 100 are minibuses. • On average, 7% of vehicles in the bus lane contain 21% of the people. • The general public perceives that too few vehicles are using the bus lane. Any benefits were expressed in person hours and no cost benefit analysis was done. “Lane friction” was observed during times of congestion. Traffic is the bus lane would travel slower than necessary, at a sympathy speed (see Section 2.2), while traffic in the GP lanes was stationary. The performance of the scheme was reassessed after four years of operation (Rees, 2003). The bus lane scheme continued to meet most of the objectives set out before the scheme was installed. The saving in journey times during peak periods was still present, although it varied considerably from year to year. The increase in the speed limit from 50mph to 60mph had only a small impact during offpeak periods, as traffic speeds between Junctions 4 and 2 were already close to 60mph. During peak periods, it was not expected that journey times would benefit from the increase in speed limits, as drivers cannot usually travel in excess of 50mph. Following the opening of the bus lane to motorcycles, 100 motorcycles per day were detected using the bus lane. The presence of the motorcycles had no impact on the operation of the bus lane. 3.4
PROPOSED SCHEMES
Other UK Authorities are considering HOV schemes, including Sandwich in Kent. An HOV lane is being introduced northbound on the A370 Long Ashton Bypass in North Somerset. This HOV lane will operate during the morning peak. Further information might be obtained on the UK schemes by visiting the sites. At the current time, site visits are not felt necessary, as the sites are both on A-class roads. Any required information should be available via phone or email from the person responsible for each site.
TRL Limited
20
UPR/T/002/05 (Issue 2)
4. 4.1
THE REST OF EUROPE SPAIN
From mid-1970 in Madrid, the number of cars on the roads has increased yet few facilities existed to deal with the extra flow. An HOV lane has been operational since 1994. The lane is divided by physical barriers and covers a distance of 40km (Institut für Landes- und Stadtentwicklungsforschung und Bauwesen (ILS), 2000). The results from this scheme have been positive. The travel times were drastically reduced for the HOV lane and as a result the percentage of 2+ vehicles increased from 30% to 40% in the first year. The average vehicle occupancy increased from 1.36 to 1.47 after implementation. Also public transport use increased by 40% in the morning peak period in the first year (ILS, 2000). These results are summarised in Table 4. No information on the percentage of SOVs is given. Table 4. Summary of Spanish improvements.
Benefits/ Disbenefits
Result
2+ vehicles
From 30% (before) to 40% (after)
AVO
From 1.36 persons (before) to 1.47 persons (after)
Public transport usage
Increase of 40%
Due to this scheme there was an increase in commercial bus speed and service regularity, a decrease in travel time, a decrease of space use, congestion, energy consumption, pollution and accidents. No information has been found on how this scheme has been monitored, or on enforcement. 4.2
NORWAY
Norway has one HOV lane scheme, located in Trondheim (see Figure 8). The nearside lane of a four-lane arterial road was used to create the carpool lane and it was opened in May 2001. The scheme applies all day (24 hours) and is available to buses, taxis and carpools with 2 or more occupants. The total distance is 0.8 km and this HOV lane has been a low cost measure, $80,000 USD set aside for signage, markings, information and marketing (Nordic Road and Transport Research (TN&TR), 2001). Selection of the scheme was determined by using the American CORSIM Model, which is a microscopic traffic simulation model (NT&TR, 2001 and FHWA, 2005b). The vehicle use, occupancy requirement and the geographical extent of the HOV lane was analysed by the model.
TRL Limited
21
UPR/T/002/05 (Issue 2)
Figure 8. The Trondheim HOV scheme
The congestion on this section was quite light, lasting for only half an hour, with delays of 5 minutes for individual vehicles (TN&TR, 2001). The primary objective was to provide more reliable and predictable travel times for carpoolers and buses. The reduction of the number of SOVs was a secondary objective. Table 5 summarises the changes due to the HOV lane’s implementation. Table 5. Summary of Norwegian scheme.
Benefits/ Disbenefits
Result
Change in average speed (in HOV lane)
From 20km/hr (before) to 30km/hr (after)
Travel time
Reduction of 5%
Total traffic (all vehicles)
Reduction of 5% (just as many persons are transported as before)
2+ vehicles
Increased by 4%
Congestion periods
Increased by 15 minutes on GP lanes (journey times remain stable in HOV lane)
Public Perception
64% in favour (74% of bus users, 59% of car users)
Violations
8-10%
Studies to date have shown that travel times for the users of the carpool lane are short and stable throughout the day (NT&TR, 2001). For the general lane, congested periods have extended from 30 minutes to 45 minutes. The share of 2+ cars has increased from 30% to 34%. The total traffic on this arterial seems unchanged, however, it is not possible to determine whether carpoolers have been attracted from other roads. On the basis of these results the carpool lane has been deemed a success. Attitudes to the scheme were measured and 64% of the respondents were in favour, however, this number varied when broken down by transportation mode. For instance bus passengers (74%) were more favourable than car drivers (59%) (NT&TR, 2001). The number of violators was quite high on the first day after the opening: 23% of the vehicles in the HOV lane did not have a passenger and drove there illegally (NT&TR, 2001). By mid June the number of violators was reduced to 16% of the vehicles in the HOV-lane and one month later it was only 8%. Pavement markings introduced in July (BUS, TAXI and 2+) have TRL Limited
22
UPR/T/002/05 (Issue 2)
significantly contributed to the last reduction. The share of violators has stabilized on 8%10% in the carpool lane (this is similar to the USA national average). This was achieved with no police control issuing fines for illegal driving. A political decision was made to increase the 2+ requirement to 3+ for the scheme in November 2001. No information has been found on the effects of this change. 4.3
AUSTRIA
Austria opened an HOV 3+ lane in Linz in October 1998. This scheme was a conversion from a bus lane. The scheme is in operation 24 hours a day. Typical usage of this 2.9km section was 25 buses in the AM peak, 70 vehicles with 4+ occupants, 225 vehicles with 3 occupants and 96 violators (i.e. vehicles with less than 3 occupants). No information is given as to what percentage of the total flow these figures represent. 26% of the HOV lane users were new carpools due to the lane (MRC, 2004). This scheme uses a continuous solid white line to segregate this ‘right inbound’ HOV lane. There is no official sign to designate an HOV lane in Austria, therefore a bus sign is used with additional text for qualifying vehicles. The cost of this scheme was minimal as it was a bus lane conversion. This is the only HOV scheme in Austria. Compliance was poor (MRC, 2004). Enforcement was limited due to the inability of being able to stop the vehicles as no stopping areas or hard shoulders are available. The penalty for violation is €21 (about £15). The HOV vehicles travel the section in less than 7 minutes, whereas vehicles in the GP lane take 25-30 minutes (MRC, 2004). Buses have not experienced a reduction in travel time as a result of conversion of the bus lane to a HOV lane. The MRC report (2004) does not indicate if bus travel times have increased. HOV users save 60,000 person-hours per year and reduce CO2 emissions by 125lt/yr. Table 6 summarises the affects of Austrian HOV scheme. Table 6. Summary of Austrian scheme.
Benefits/ Disbenefits
Result
Average daily violations
96
Increase in carpoolers
26%
Time saved by HOV users
60,000 person hours per year
CO2 emissions
Reduced by 125 litres per year
No specifics on the method of monitoring have been found on this scheme. However, a strong and effective media campaign was launched on the opening of the scheme.
TRL Limited
23
UPR/T/002/05 (Issue 2)
5. 5.1
OTHER SCHEMES CANADA
Canada has a total of 23 HOV sites, in four different provinces. The Canadian sites are listed in Table 7. These sites vary in length from 0.4 km to 18 km and typically are 3+ HOV lanes, in operation during peak periods. The first HOV lane was opened in May 1991. Table 7. Canadian HOV schemes (Schijns, 2003)
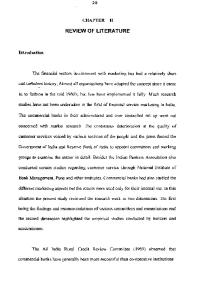
The Calgary site experiences tidal flow. The carriageway is four lanes wide, with an HOV lane in the nearside lane (see Figure 9). The average vehicle occupancy has increased from 1.32 to 1.39. Bus ridership has increased by 56%, and total car volume is down 32% (McCormick Rankin Corporation (MRC), 2002). This site is specified, by signing, for buses, cars with 2+ occupants and bicycles. Prior to enforcement there was a 20% to 35% violation rate. The enforcement used is conventional policing with 267 tickets issued between January and April 2001 (MRC, 2002). The design features include a pavement diamond, plus dashed lane lines with overhead reversible signs. The scheme operates between 07:00-08:30 southbound and 15:30-18:00 northbound. TRL Limited
24
UPR/T/002/05 (Issue 2)
Figure 9. Calgary’s HOV lane operation layout (MRC, 2002)
Publicity prior to the scheme was carried out by means of open house displays, posters on buses and shelters and adverts in newspapers. Every household received an “Escape the Rush – use the HOV lane” bumper sticker. A survey showed that the scheme was supported by 79% of the area’s residents (MRC, 2002). No specifics have been found on monitoring of the Canadian schemes. 5.2
AUSTRALIA
Australia has 11 HOV lane schemes located in Brisbane, Melbourne and Sydney (see Table 8). The distance covered by the HOV lanes varies between inbound and outbound and, in some cases, the schemes operate inbound only into the cities. All schemes are for peak hours only with some being just for the AM peak period. The majority of schemes are for 3+ occupancy vehicles. The earliest of the schemes was implemented in 1992. The South East Busway in Brisbane, progressively opened between September 2000 and June 2001, was the result of five years planning, design, construction and community liaison. In 1996 a market survey showed that 25% of the respondents already used the bus and another 61% would consider using the South East Busway assuming there would be improvements to convenience, frequency, reliability and safety. The decision to build the Busway system was found to cost less than the do-nothing alternative and, by the year 2011, the Busway is estimated to save taxpayers about $62 million (Australian dollars). This scheme has also increased property values by 20% within the vicinity (Transport Research Board (TRB), 2002). TRL Limited
25
UPR/T/002/05 (Issue 2)
Table 8. Australian HOV schemes (Schijns, 2004)
The Busway is located along one side of a 6-lane freeway and the two travel lanes are separated by a 1.6 foot barrier plus a fence. Bays are provided at the stations to allow express buses to pass buses making stops. No monitoring information has been found on this scheme, however, it does not fall in to a category where violations of the scheme can occur. Statistics have been obtained by measuring the ridership of the scheme in this case. A paper for HOV and Bus Priority Facilities for the Perth region of Australia discusses the concept of HOV lanes (Department for Planning and Infrastructure (DPI), 1997). Perth has a very low Average Vehicle Occupancy and as a result the paper states that any HOV lane would be generally set at 2+ persons, including the driver. Experience from elsewhere suggests this is necessary to prevent ‘empty lane syndrome’, promote a recognition of HOV project success by the general community and facilitate the formation of ride-share arrangements. It was considered possible that a threshold of 3+ may be acceptable in the future when the HOV lane reached capacity. This paper also concludes that to offset the disadvantages of ride-sharing, loss of privacy, time taken to pick up ride sharers etc, the user benefits must be greater (or at least be perceived to be greater) than those that exist for users of single occupancy cars. Without exception, HOV and bus priority facility success in other cities has been linked to a ‘package’ approach to the identification and implementation of priority measures. Mutually-supporting TRL Limited
26
UPR/T/002/05 (Issue 2)
HOV and bus priority measures will significantly enhance the opportunity of success. These measures may include Road Infrastructure, Parking Facilities, Ride-Share Schemes, Information and Awareness, Marketing, Enforcement and Research and Evaluation. According to the DPI, improved parking facilities can include reserved parking spaces, premium location or undercover parking, discounted parking fees, direct access to HOV facilities, and integration of HOV parking facilities with park and ride schemes. Information and awareness is essential for a successful scheme, it is important that key stakeholders support the need for and general principles of HOV and bus priorities prior to the introduction of specific projects. Marketing and promotion is important before, during and after the scheme’s implementation to develop expectations, advertise the opening, educate and inform drivers and to promote immediate use of HOV lanes. Although voluntary compliance should be encouraged, effective enforcement is essential. Appropriate mechanisms should be in place for enforcement of HOV lanes prior to introduction of the scheme and infringement penalties should be sufficient for effective enforcement. Ongoing research into HOV lanes is essential and up-to-date knowledge of experience elsewhere should be obtained. Ongoing evaluation of HOV lanes against scheme objectives is necessary to determine the operational success of the scheme. In addition, the results can be used in fine tuning the scheme and in marketing campaigns. Early USA schemes on freeways typically involved expensive and extensive lane additions and physical barriers, whereas Australian HOV and bus priorities along arterials relied more on traffic management with less reliance on infrastructure and a stronger focus on shorter length schemes.
TRL Limited
27
UPR/T/002/05 (Issue 2)
6.
CONCLUSIONS
A comprehensive review of existing HOV schemes has been carried out. The review has obtained detailed information on schemes already identified during the M1 HOV Lane feasibility study, and has also discovered several additional schemes. Most of the HOV schemes are in the USA, but HOV schemes are operating in Canada, Spain, Australia, Norway and Austria, as well as two existing schemes in the UK. The review has identified several areas where previous experience could be relevant to the design, operation and monitoring of the M1 HOV scheme. The previous experience is summarised in the following sections. The intention of HOV facilities is not to force individuals into making changes against their will. Successful HOV lanes must not simply divert existing HOVs from GP lanes to the HOV lanes, but also provide a cost-effective travel alternative that a significant volume of commuters will find attractive enough to change from SOVs to HOVs, thus resulting in a higher occupancy and lower vehicle flows (Turnbull, 1992). 6.1
SCHEME DESIGN
There are three types of HOV lane designs: •
separated flow;
•
concurrent flow and
•
contra-flow lanes.
Most of the USA’s HOV lanes are concurrent flow lanes separated from the GP lanes by a narrow, painted buffer. This design is similar to that planned for the M1. Over 80% of the USA’s HOV lanes are 2+ lanes. All allow buses, but not HGVs. Most HOV lanes operate during peak flows only. Those operating for 24 hours are day are largely concurrent lane designs. 6.1.1
Signing
Concurrent HOV lanes are commonly marked with a diamond (see Figure 10) with overhead and adjacent signing indicating minimum occupancy, authorised vehicles and hours of operation.
TRL Limited
28
UPR/T/002/05 (Issue 2)
Figure 10. A concurrent flow HOV lane, marked by diamonds, in the offside lane (METRO, 2002)
6.2
SAFETY
The safest buffer design is the 8 foot buffer with a buffer height of 6 inches. Research shows that this design results in a drop in accident rates. Narrower buffers can lead to increased accident rates as can wider buffers which may also be mistaken for a running lane. 6.3
ENFORCEMENT
Low violation rates are a good reflection of the public’s acceptance of a scheme. However, enforcement on concurrent HOV lanes is difficult. For enforcement to be successful (Turnbull et al., 1991): • The agency responsible for enforcement must have legal authority to do so. • The penalties associated with violation must be appropriate. • Any penalties should be high enough to discourage violation. Penalties should be high enough to deter violations and discourage the HOV lane being thought of as a toll lane by those willing to pay the fines. In Georgia, USA, fines increase from $75, for the first offence, to $150 plus one point on the driver’s licence, for the fourth offence. Fines for HOV lane violations in Austria are €21. Enforcement techniques include video surveillance, automatic vehicle identification, infrared technology and patrols as well as self-enforcement. Video surveillance can have added advantages when it comes to the prosecution of violators. Evidence can be sent to first time violators which may help to deter repeat offences. HOV violation should be a high priority with visible means of enforcement. The aim of the HERO programme, where motorists are encouraged to report misuse of the HOV lanes, is not to prosecute the violators, but rather to educate them in the proper use of HOV lanes and to reduce the likelihood of repeat offences. This programme is credited with reducing violation rate in some areas.
TRL Limited
29
UPR/T/002/05 (Issue 2)
6.4
EVALUATION
There is little information available about the methodology used to assess and evaluate the operation of HOV lanes. In particular, the quantities of data collected are not specified, nor is the method of analysing the data. No cost benefit analysis was identified for any of the schemes. All schemes were monitored to some extent (as would be expected for schemes reported on the internet). Data was collected before and after the schemes were installed (although for how long is not usually specified). Typical items that were measured are: • Vehicle occupancy. This was measured for almost all schemes. Occupancies were sometimes measured in the HOV lane and GP lane separately, and sometimes across the carriageway. In a few cases, occupancies were also measured away from the HOV site (to be used as a control site). • Traffic volume. Flows in the HOV lanes were measured for almost all schemes. Often, the total flows across the carriageway were not mentioned. This is likely to yield to misleading results as the true value of HOV traffic may not be known. • Travel times and their reliability. Journey times in the HOV lane and the GP lanes were compared. For a few schemes, there was a statement that journey time reliability for HOVs had improved, but this was not quantified. • Violations. For most schemes, some figures were given on violations, i.e. rogue vehicles using the lane. It is not usually made clear whether the figures are from independent observations or from enforcement statistics. The results are normally quoted as overall figures. They are not broken down by time of day or day of week, nor are seasonal variations mentioned. The Texas Transport Institute (TTI) conducted a survey of HOV lane projects (Turnbull et al., 1991). It reviewed the current before and after evaluation methods in order to provide an overview of commonly used measures and techniques. However, no standard methods were apparent. HOV lane evaluation methods were extremely varied with adequate before and after data not always being collected. Initial evaluations may have been carried out shortly after a scheme has opened yet ongoing monitoring may not have been done. On many HOV schemes formal evaluations have never been done, nor are they likely to be in the future. If the purposes of the scheme are not clearly defined at the outset is a risk that inadequate data will be collected. Therefore meaningful conclusions cannot be made, and it will not be possible to prove whether the goals have been met. It is also important to consider the surrounding network and GP lanes when assessing the impact of an HOV lane. Turnbull et al. suggest that a comparison between what the effect of adding an extra lane would have been, rather than the HOV lane, may be useful. The schemes reviewed by Turnbull et al. used the following methods to evaluate HOV lanes: • Monitoring of bus schedule adherence and monthly bus data including park and ride counts; • Changes in commuter behaviour and reasons; • Changes in public perceptions through surveys of both users and non users; • Occupancy counts;
TRL Limited
30
UPR/T/002/05 (Issue 2)
• Accidents; • Classification of types of vehicles; • Licence plate surveys; • Violation rates (whether these are repeat offences); • Safety. Turnbull et al. suggest the following approach to evaluating HOV lanes: • Clear articulation of project goals and objectives; • Identification of measures of effectiveness; • Identification of information needed; • Development of the study design; • Conduct “before” data collection; • Conduct “after” data collection and evaluation; • Ongoing monitoring and evaluation. Ongoing monitoring and assessment is vital for continuing successful operation of HOV lanes as congestion increases. Knowing the effectiveness of a HOV lane will help with future policies or the implementation of HOV schemes on other roads. 6.5
PUBLICITY AND MARKETING
Public awareness and understanding of HOV lanes and their purposes is key for their acceptance and continued legal use. Many schemes in the USA have come under criticism from the public. As such it is vital that proposed HOV schemes be extensively marketed and the public are aware of how to use the lanes and also what changes in traffic behaviour are expected. It is important that the public be given a complete picture of any benefits or disbenefits as, in the past, incorrect conclusions have been drawn from published articles where incomplete data has been given. This lack of data has been interpreted as a cover-up by the local authorities who may be thought of as trying to hide disbenefits of a scheme. A number of HOV lanes have been criticised for “empty-lane syndrome”, or perceived under-utilisation where local road users saw the lanes as wasted road space. Such HOV lanes are often decommissioned and the public lose faith in other schemes which may or may not be showing a benefit. If the public are not sufficiently prepared for the opening of HOV lanes, an adequate market will not exist. Marketing campaigns, through the media increase public awareness and confidence in the HOV purpose, publicise accurate expectations and encourage car sharing. Television, radio, press conferences, mailings, fliers left on windscreens and information accompanying licence renewal forms are some of the marketing methods used. The marketing of HOV lanes is best presented to the public in terms of time saved, reliability of journey times and safety. Commuters must be made aware of the purpose and expectations of the scheme in order to dismiss any misconceptions. They must also understand that violators will be prosecuted. TRL Limited
31
UPR/T/002/05 (Issue 2)
Public surveys after the opening of a scheme will draw attention to why people are not using the HOV lanes, and may highlight ways in which this number of users can be increased. Ongoing monitoring and assessment of the HOV lanes is essential as it will aid continuous public acceptance of the scheme. Integration with the surrounding network through the implementation of public transport systems is considered key for the success of HOV schemes. 6.6
SUMMARY
The literature review has shown that: •
There is no standard design for the layout of HOV lanes or their operation.
•
Signing for a HOV lane is usually placed at the start of the lane and at regular intervals along the scheme. However, is no standard spacing for these signs. Overhead signing is preferable where possible.
•
Signing gives details of minimum occupancy requirements and restrictions on times and vehicle types.
•
Buses are always allowed to use the HOV lane, and HGVs are consistently banned from the HOV lane in the schemes reviewed.
•
Integration with the surrounding network through the implementation of public transport systems is considered key for the success of HOV schemes.
•
Public awareness and understanding of HOV lanes and their purposes is key for their acceptance and continued legal use.
•
Advanced marketing of a scheme may help promote public acceptance and understanding.
•
HOV lanes must be enforced for them to be successful. The penalties should be high enough to discourage violation.
•
There were no standard methods for evaluating HOV schemes.
•
No cost benefit analysis has been found for the schemes reviewed.
•
Ongoing monitoring and assessment (including public opinion surveys) is vital for continuing successful operation of HOV lanes.
TRL Limited
32
UPR/T/002/05 (Issue 2)
7.
REFERENCES
2Carshare (2005). http://www.2carshare.com/Default.asp American Association of State and Transportation Officials (1990). A policy on geometric design of highways and streets. American Association of State and Transportation Officials: Washington. Case RB (1995). Concurrent-lane HOV safety. Federal Highway Administration, Washington, D.C. Department of Planning and Infrastructure (1997). High occupancy vehicle and bus priority facilities for the Perth metropolitan region. http://www.dpi.wa.gov.au/publications/metropdfs/hov.pdf. Department of Planning and Infrastructure (DPI), Government of Western Australia. Department of Motor Vehicle Safety (2004). High Occupancy Vehicle Lanes. http://www.dmvs.ga.gov/enforce/hov.asp. Georgia Department of Motor Vehicle Safety (DMVS). Department for Transport (2005). Case study: high occupancy vehicle lanes – A647 Stanningley Road, Leeds. http://www.buspriority.org/hovlanes.htm. Page viewed 04/01/2005. Department for Transport (DfT). Federal Highways Administration (2005a). http://hovpfs.ops.fhwa.dot.gov/inventory/findfacility.cfm. Page viewed 13/01/2005. Federal Highways Administration (FHWA). Federal Highways Administration (2005b). http://www.fhwa-tsis.com/corsim_page.htm. Page viewed 04/02/2005. Transport Software Integrated System, Federal Highways Administration (FHWA). Fuhs C (1990). High-occupancy vehicle facilities. Parsons Brinckerhoff, New York. Georgia Department of Transportation (2003a). HOV implementation plan for the Atlanta region. Enforcement Report. Georgia Department of Transportaion (GDOT). Georgia Department of Transportation (2003b). HOV implementation plan for the Atlanta region. Final Report. Georgia Department of Transportaion (GDOT). Institut für Landes- und Stadtentwicklungsforschung und Bauwesen (2000). LEDA measure: bus/HOV (high occupancy vehicle) lane in an urban corridor. http://www.ils.nrw.de/netz/leda/database/measures/meas0216.htm, Institut für Landes- und Stadtentwicklungsforschung und Bauwesen (ILS). Jasek D (2002). Current state-of-the-practice for managed lanes. Report number TTI TM 4160-4F. Texas Transport Institute (TTI), Texas A&M University.
TRL Limited
33
UPR/T/002/05 (Issue 2)
Kellogg Brown and Root (2004). High occupancy vehicle lanes feasibility study. Kellogg Brown and Root Limited (KBR), UK. Leeds City Council (2002). HOV lane info sheet. http://www.carclubs.org.uk/carsharing/docs-images/LCC-info-sheet.pdf. Leeds City Council (LCC). Martin PT, Perrin J, Wu P and Lambert R (2004). Evaluation of the effectiveness of high occupancy vehicle lanes. University of Utah. McCormick Rankin Corporation (2002). HOV facilities on arterials – Project overview (Calgary, Canada). McCormick Rankin Corporation (MRC). HOV Systems Committee, Transport Research Board. McCormick Rankin Corporation (2004). HOV facilities on arterials – Project overview (Linz, Austria). McCormick Rankin Corporation (MRC). HOV Systems Committee, Transport Research Board. McCormick Rankin Corporation (2005). HOV facilities on arterials – Project overview (Bristol, UK). http://www.mrc.ca/pdf/Europe/E4.pdf. McCormick Rankin Corporation (MRC). HOV Systems Committee, Transport Research Board. METRO (2002). Eleven things you should know about the carpool lanes in Los Angeles county. HOV Performance Program, Executive Summary. Los Angeles County Metropolitan Transportation Authority. Nordic Road and Transport Research (2001). The first Norwegian carpool lane opened in Trondheim. No.3. Norwegian Public Road Administration, Nordic Road and Transport Research (NR&TR). Rees TR, White JK and Quick JI (2000). Monitoring of the M4 bus lane: the first year. TRL report PR/T/125/2000, Issue 1. (Unpublished). Rees TR (2003). Monitoring of the M4 bus lane: 2000 to 2002. TRL report PR/T/006/03, Issue 1. (Unpublished). Schijns S (2003). Signalized arterial road HOV lane database. Part 2 – Canada. High Occupancy Vehicle Systems Committee, Transportation Research Board. Schijns S (2004). Signalized arterial road HOV lane database. Part III – Australia. High Occupancy Vehicle Systems Committee, Transportation Research Board. Slug-Lines (2004). About slugging. www.slug-lines.com/Slugging/About_slugging.asp. Stokes RW, Christiansen DL, Levine SZ (1984). Freeway concurrent flow high occupancy vehicle lanes: basic considerations. Compendium of Technical papers, ITE 54th Annual Meeting, San Francisco. Washington: Institute of Transportation Engineers.
TRL Limited
34
UPR/T/002/05 (Issue 2)
Szoboszlay A (1998). HOV lanes cause huge solo driver increase on Montague Expressway. Model Railroad News. www.trainweb.org. Szoboszlay A (2000) HOV lanes exposed. Carpool facts for the San Francisco Bay area. Model Railroad News. www.trainweb.org. Transport Research Board (2002). Brisbane, Australia. Brief: South East Busway. http://gulliver.trb.org/publications/tcrp/tcrp90v1_cs/Brisbane.pdf, Transport Research Board (TRB). Turnbull KF, Henk RH, Christiansen DL (1991). Suggested procedures for evaluating the effectiveness of freeway HOV facilities. Report UMTA/TX-91/925. Texas Transportation Institute (TTI), Texas A&M University. Turnbull KF (1992). An assessment of high occupancy vehicle (HOV) facilities in North America. Final Report DOT-T-94-17. Federal Transit Administration, U.S. Department of Transportation, Washington D.C.
TRL Limited
35
UPR/T/002/05 (Issue 2)