Literacy and the Industrial Revolution Economic History Review, Vol XXXI, No. 3, August 1978 Edwin G. West
Sharp differences of judgement appear to persist on the precise extent and timing of literacy changes in eighteenth- and nineteenth-century Britain and their relationship to economic growth. This article will explore the exact nature of the differences and will attempt to resolve some of the main issues. Recent research among British historians seems to have been sensitive to the seminal work of the American economists M. J. Bowman and C. A. Anderson in 1963.1 From statistics of cross-sectional comparisons of literacy rates in the 1950ʹs they generalized that a literacy rate of 30-40 per cent was a necessary condition for a country to make a significant breakthrough in per capita income. Several British historians seem to have been uneasy about Bowman and Andersonʹs inclusion of eighteenth and nineteenth-century Britain as one of the many ʺindustrial and literacy successʺ examples. Their critical response to the American authors has included the following three arguments: first, that literacy deteriorated in the Industrial Revolution; second, that growth produced literacy, not vice versa; and third, that private educational activities were inadequate. This response has probably been conditioned by the long-established tradition in British history that the Industrial Revolution, especially in its early stages, was generally inimical to reasonable material comforts, let alone educational improvements, among the working class. Typical of the originators of this tradition, for instance, were the Hammonds. Their conclusion was that in the new manufacturing towns of the Industrial Revolution:
1
M. J. Bowman and C. A. Anderson, 'Concerning the Role of Education in Development', in C. Geertz, ed. Old Societies and New States (New York, 1963), pp. 247-79.
…all diversions were regarded as wrong, because it was believed that successful production demanded long hours, a bare life, a mind without temptation to think or remember, to look before or behind.2 The ruling class argued … that with the new method of specialization, industry could not spare a single hour for the needs of the man who served it. In such a system education had no place.3 …politicians were prepared to leave the nation to a hopelessly inadequate provision made by voluntary societies, and it was not until 1833 that education received any help from the public funds.4 Richard Altick, a more recent upholder of this tradition, summed it up in one sentence: The occupational and geographical relocation of the people-the total disruption of their old way of life, their conversion into machine-slaves, living a hand to mouth existence at the mercy of their employers and of uncertain economic circumstances; their concentration in cities totally unprepared to accommodate them, not least in respect to education; the resultant moral and physical degradation - these, as we shall see, had, significant consequences in the history of the reading public.5 The supporters of this traditional view, nevertheless, have had to face the challenge not only of Anderson and Bowman but also of the new empirical work of writers (including the present author) who claim that education did not decline.6 The response to this challenge has been interesting. Some historians, whether traditionalists or not, have reacted by 2
J.L. and B. Hammond, The Rise of Modern Industry (5th edn. 1937), p.229. Ibid. p. 231. 4 Ibid. 5 R. D. Altick, The English Common Reader (Chicago, 957), P. 207. 6 R. K. Webb, The British Working-Class Reader, 1790-1848 (1955); V. E. Neuberg, Popular Education in Eighteenth-Century England (1971), who argues (p. 139) that there was a "mass reading public" by 1800; D. Robson, Some Aspects of Education in Cheshire in the Eighteenth Century (Manchester, 1966) ; T. W. Laqueur, Religion and Respectability: Sunday Schools and Working-Class Culture, 1780-1850 (New Haven, 1976); Lawrence Stone, 'Literacy and Education in England, 1640-1900', Past and Present, XL,11 (1969); E. G.West, Education and the State (1965); idem, Education and the Industrial Revolution (1975); M. Hartwell, The Industrial Revolution (1971). 3
2
concentrating on intensive surveys of particular localities that suggest apparent exceptions to the rule of progress. Sometimes, too, the ʺnew scepticsʺ have challenged the reliability of the statistical sources used in recent work, but then they have proceeded, regardless of the inconsistency, to rely themselves on the same sources, but with their own particular interpretation.7 More important, the sceptics have concluded that the verdict that the Industrial Revolution period (which most participants in the debate seem to take to be 17601840) was favourable to educational growth is, at best, appropriate only for the last few years of the period.8 They base their main argument on large-scale sample data on eighteenth-century marriage-register signatures, first published in 1973. Previously scholars had been limited to national figures from 1839 in the Registrarʹs annual reports, and to one or two small local samples. This article takes the opportunity to examine the new data. I shall argue that, on correct interpretation, they do not support the sceptics.9 The article will also consider the claim of the sceptics that wide regional variations in nineteenth-century literacy throw doubt on any generalized conclusion on the relationship between industrialization and educational growth. The main focus will be on the regional example that is so often cited, the case of Lancashire. It will be
argued that here some important variables have been missing from
the discussion. Finally, it will be shown that, in reaching their conclusion, the sceptics have gone from figures of literacy to figures of schooling, and that, in this latter field, their argument is equally unconvincing. The discussion begins in section II with a re-examination of the Lancashire case. Section III analyses the new data on eighteenth-century literacy and discusses the current interpretation of it. Section IV links the evidence of changing literacy with that of changing educational institutions, and especially the innovations of ʺfreeʺ, ʺcompulsoryʺ, and publicly 7
This was a central point in my reply to J. S. Hurt, 'Professor West on Early Nineteenth-Century Education', Economic History Review, 2nd ser. xxiv (1971). 8 See, for instance, Michael Sanderson's review of my 1975 book in Econ. Hist. Rev. 2nd ser. XXIX (1976).
3
provided schools, in a way that tests hypotheses about such linkage that are commonly employed by the sceptics but not efficiently tested by them. II It is generally agreed by all participants that people were more literate at the end of the Industrial Revolution period, 1760-1840, than they were at the beginning. Michael Sandersonʹs survey of Lancashire, however, has suggested to him initial decline or stagnation that only reversed itself after over one-half of the period was over.10 Sanderson based his survey on a selection of what he believed to be fairly representative instances of the industrializing centres in the country. After adding further data, Thomas Laqueur, using the same measure as Sanderson marriage-register signatures - also pointed to an early decline in literacy in Lancashire. The low point was 48 per cent of men and 17 per cent of women able to sign their names in 1814-16.11 Laqueur, however, rejected Sandersonʹs suggestion that the low point might have been caused by the introduction of large-scale factories using steam-power in the 1790ʹs which, according to Sanderson, was the beginning of real social dislocation. This is unproven, Laqueur insisted, because the downward literacy trend had by then already been in progress for forty years. Sandersonʹs argument, moreover, could not explain the beginning of a long-term rise in the literacy rate which Laqueur placed at around 1800, when the full influence of the factory system was beginning to be felt. In fact, it appears that the Industrial Revolution reversed a downward spiral of working-class literacy which began in the mid-eighteenth century. By the time
9
These were not available at the time of writing my 1975 book. On the same reasoning the opinion of' Sanderson, ibid. that "the recent debates on literacy" render some of the conclusions of my book "seriously outdated", will be rebutted. 10 Michael Sanderson, 'Literacy and Social Mobility in the Industrial Revolution in England', Past and Present, LW (1972), 75-104. 11 Thomas W. Laqueur, 'Literacy and Social Mobility in the Industrial Revolution in England,' Past and Present, LXIV (1974), 96-107.
4
the full effects of the factory system came to be felt, literacy was once again on the, rise.12 Laqueur emphasized that the marriage literacy test reflected an education that ended about twelve to fifteen years before, as, for instance, with a marriage age of 25 and a school-leaving age of ten. It was for this reason that the correct date for the improvement in literacy was around 1800. Laqueurʹs article also stressed that the adult literacy rates in the same Lancashire towns were below the national averages just before the Industrial Revolution. In his reply in 1974, Sanderson did not satisfactorily meet Laqueurʹs point that the downward trend in literacy had been in progress for forty years before the introduction in the 1790ʹs of steam-powered factories, and that the latter were not therefore the obvious cause of the low point in literacy in 1800. Instead, Sanderson shifted the debate to the latter end of the period. He argued that his own figures of literacy in Lancashire at the time of marriage did not show a “consistentʺ upturn before 1820.13 The graph of his data,14 however, shows that there was a distinct upturn before 1820, as Laqueur argued. First, Sandersonʹs nine-point moving average curve rises steadily from its first point in the year 1817. Second, and much more importantly, his graph needs an adjustment lag to account for the interval between school and marriage. Sanderson (1974) accepted Laqueurʹs argument that literacy records in marriage registers reflected a schooling of twelve to fifteen years earlier. On the assumption that schooling creates literacy (which all participants accept), his nine-point average curve of literacy should, on his own concession, start twelve to fifteen years before 1817, that is in 1802-5. Third, neither Laqueur nor Sanderson gives the source for his belief that the lag was twelve to fifteen years. My own research (1965, p. 133) suggests that on the average it was about seventeen years. On this estimate, Sandersonʹs graph reveals the rise in 12
Ibid. 100 Michael Sanderson, 'Literary and Social Mobility in the Industrial Revolution in England: A Rejoinder', Past and Present, LXIV (1974), 108-12.
13
5
literacy starting in 1800, as Laqueur argued on the basis of his own data. Notice that the argument that the full effects of the large-scale factories in 1800 caused a social dislocation that was inimical to education requires evidence that literacy declined at this time. Sandersonʹs evidence shows instead that the period around 1800 was the beginning of an increase. The question whether industrial change in the past hindered or helped literacy is much more complex when other substantial changes were occurring. The most dramatic change in the late eighteenth and early nineteenth centuries, apart from the Napoleonic War, was the unprecedented expansion of population. The true test of the question is whether literacy rates would have fared better if the same late eighteenth-century population explosion had occurred in the pre-factory environment. Even if we ignored the previous criticisms, this consideration would make Sandersonʹs argument much more hypothetical. Laqueur mentions a 60 per cent increase in the Lancashire population between 1781 and 1800. Not only was the natural increase well above the national average but so was the rate of immigration. The combined (natural plus migration) increase in population was four times the national average. According to rough estimates, just under half of the increase between 1781 and 1800 was by immigration (126,319 increase by immigration and 146,852 by natural increase).15 This means that if the typical immigrant family consisted of two adults and two children, then for every two ʺlocal-bornʺ children there was about one immigrant child needing education over this period. The more that immigrants consisted of young single adults, the more the early marriage signatures would be represented by them. Also relevant is that between 1801 and 1831 population increase reached its peak in absolute numbers, 637,543, as did the natural increase, 474,009, and immigration, 183,543.16 The ratio of immigrants to natural increase, however, was evidently falling by this time. Because a considerable proportion of the immigrants were 14 15
Sanderson, loc. cit. (1972), 87. Phyllis Deane and W. A. Cole, British Economic Growth, 1688-1959 (Cambridge, 1962), p. 109
6
low-income Irish, and since by all accounts they had the poorest of educations,17 the growth of Irish arrivals relative to the local-born Lancashire population must have had a significantly depressing effect on the local literacy records, especially between 1781 and 1800. According to Arthur Redford, Lancashire contained a greater number of Irish settlers during the period than any other county, and the majority of them settled in the Industrial Revolution towns.18 In 1835, Dr. P. Kay estimated that the Irish and their immediate descendants in Manchester had grown to about 60,000. This was between one-quarter and one-third of the townʹs total population.19 It is surprising that, in the works cited above, neither Sanderson nor Laqueur connects the Irish immigration with the relatively low literacy rates in the Lancashire of the Industrial Revolution. Indeed, Laqueur argues the possibility that the immigrants were typically the more accomplished and literate. Clearly, the data produced by Sanderson and Laqueur would benefit by a re-examination and search for a correlation between Irish settlement and literacy rates in the various parishes so far studied. Their investigations are surely significantly incomplete without it. If the explanation of a depressant effect by immigrants holds up, the view that literacy had no major connexion with economic growth in the period would be even weaker.20 The quickening of economic activity in the Industrial Revolution stimulated the demand for new construction of houses, port facilities, canals, and roads. This in turn increased the demand for general labourers, the literacy among whom, it is generally agreed, is not of the strongest relevance to their particular productivity. As Redford observes: Much of the work done by the Irish in Great Britain was of the same general manual nature as their harvesting and agricultural labour An immense number of Irish were employed as hodmen in Lancashire. By 1833 there were at least seven
16
Ibid West, Education and the State, pp. 113- 14. 18 Arthur Redford, Labour Migration in England (New York, x968), p. 154. 19 B. R. Mitchell and P. Deane, Abstract of British Historical Statistics (Cambridge, 1962), P. 24. 20 See the view of R. S. Schofield, in section III below. 17
7
hundred Irish hod-carriers working in Liverpool, and two years later it was said that four-fifths of the bricklayersʹ labourers in Stockport were Irish.21 Such a picture is quite consistent with a situation of significant ʺthresholdʺ literacy among the indigenous population enabling them better to concentrate in ʺkeyʺ growth areas, like manufacturing, where literacy was of more consequence. But even if this were not the case, insofar as the literacy of the immigrant Irish improved, compared with its normal attainment at their place of origin, we can still speak of this as a growth in education; and one that was associated with industrialization. The positive association could still prevail despite the stagnation or even decline shown in Lancashire marriage signatures in particular localities. This kind of explanation too could give its own kind of support to a ʺthresholdʺ - type argument similar to Bowman and Andersonʹs. And it is note worthy that, at the end of his recent debate, even Sanderson comes to reconcile his position with theirs: ʺYet I find credible the notion that pre-industrial Britain had already crossed a threshold of literacy sufficient for industrialization and that, however much it fell during early industrialization, it did not regress beyond that threshold.”22 III One other modern specialist, R. S. Schofield, still rejects the ʺthresholdʺ theory. After referring to Bowman and Andersonʹs association of literacy with growth he observes: ʺInferences sometimes drawn from this association are that an illiteracy rate of about 60 per cent is a threshold above which economic growth is unlikely. . .ʺ Schofield then objects: Although it is true that the national male illiteracy rate had crossed the 60 per cent threshold before 1750, the female rate only crossed it definitely around 1795,
21 22
Redford, op. cit. p. 154. Sanderson, loc. cit. (1972), 111.
8
and female illiteracy was very high in areas of high female industrial employment; for example, it was still 84 per cent in Oldham in 1846.23 These objections do not stand up. First, the threshold described by Bowman and Anderson is not 60 per cent, but between 60 and 70 per cent;24 and it is relevant that these authors also suggested from their data that within the range from 30 to 70 per cent literacy there was ʺremarkably littleʺ increase in income with rising literacy rates.25 Schofieldʹs figures show that the national rate for women was about 37 per cent in 1755, rising steadily to 40 per cent around 1795, and still rising thereafter. Clearly, this was well within Bowman and Andersonʹs relevant threshold. Second, Bowman and Andersonʹs figures refer in any case to the adult literacy rate (men and women combined). In England according to Schofieldʹs figures this rate started well above the limit at about 50 per cent (in 1755), and rose to about 60 per cent in 1840. Finally, Schofield is misleading when he supports his argument that female industrial illiteracy was very high in areas of high female industrial employment by taking ʺfor exampleʺ the case of Oldham with a 16 per cent female literacy rate in 1846. This was an extreme instance. The figure for industrial Lancashire as a whole, which is the more relevant one, was about 31.1 per cent.26 Schofieldʹs article has the distinction of offering the strongest defence hitherto of the marriage-signature measure of literacy. His main point is that it is the most standard, direct, and inclusive. One can agree with this up to a point;27 and one can accept, as reasonably representative, the national estimates from his random sample of 274 parishes (out of a total of 10,000) relating to the pre-1839 years, the period before the
23
R. S. Schofield, 'Dimensions of Illiteracy, 1750-1850', Explorations in Economic History, X (1973) above, 437-51. 24 Bowman and Anderson, 1oc.cit. p.252 25 More precisely this was the case in 27 out of the 32 countries studied. 26 Laqueur, loc. cit. 99. 27 I gave almost as strong support for the marriage-signature test of literacy, but from different arguments, in Education and the State, p. 134
9
Registrar-General recorded aggregate literacy. What is debatable is his interpretation of these figures. Schofield argues that the ʺlong period of stabilityʺ in literacy in the eighteenth century suggests that ʺfor England, at least, the usual causal relationship between literacy and economic growth might profitably be reversed.ʺ But taking the conventional dates of the first Industrial Revolution to be between 1760 and 1840, and assuming, as Schofield does, that entry into the labour force may be taken to be fifteen years prior to marriage (i.e. at school leaving), then 1790 is the date when the long-term stability in male literacy changed to one of definite improvement.28 It follows that, despite the unprecedented population growth after 1760, England was not only able to maintain the male literacy rate that had been constant for twenty years preceding the industrial revolution, but well before half the ʺrevolutionʺ period was over, and at a time when the population explosion was in full force, it managed to begin an upward trend. It is interesting again to notice that the date of upturn, 1790, coincided with the beginning of the large-scale factory system and the widespread commercial use of steam power. The influence of the British tradition on educational history29 might be one factor inhibiting Schofield from drawing the central attention to the 1790 ʺtake off ʺ point, and from making reference to the enormous handicap of the sudden growth of population. For such an early year suggests a growth in the means of literacy improvement such as private schools for all classes, while the tradition argues the impossibility of any progress (or avoidance of decline) until public action was taken.30 Interestingly enough, Schofield eventually moves from his major data, on literacy, and into the evidence on schooling. Since the evidence he uses refers to the post - 1830 years, we must, for the moment, shift our focus from the early (eighteenth-century) Industrial Revolution period, and from literacy, to schooling.
28
Schofield agrees with this timing, loc. cit. 446. See above, pp. 1-2 30 The government did not intervene until 1833, and even then only with very modest subsidies to private schools - West, Education and the Industrial Revolution, p. 75. 29
10
Schofield starts by rejecting the “rash of educational surveysʺ in the 1830ʹs as being too restricted in date span to be useful for a study of trends over a long period. Yet, inconsistently, he himself eventually leans heavily on one of them; and he does this to demonstrate that schooling (over a long period) was seriously deficient. More significantly still, he here makes serious errors in interpretation and reporting. Referring to the period 1750-1850, he argues, ʺAll schools had great difficulty in securing attendance.ʹ31 He supports the statement about this ʺlong periodʺ from one example of the ʺin-periodʺ survey of the 1830ʹs, the survey of education in Westminster in 1837-8. According to Schofield, this reported ʺthat school attendance in winter was down to between a quarter and a half of the number enrolledʺ.32 But, to be precise, the Committee of the Westminster Statistical Society was reporting, in 1838, on a total of eight different types of school. Its comments on decreased attendance in the winter months related to only two of them; and these contained 29 per cent of the total scholars in the area. With respect to this sub-set the Committee reported: ʺIn some instances the decrease thus caused was stated to amount to one-fourth, to one third and even to one half.ʺ33 If we take a quarter to be the proportion of scholars absent in the whole of this sub-group of schools this would amount to an absence rate of 7 per cent of the total school population of the area-although to be realistic we should add some small rate of absence in the other schools outside the sub-group. Even this absence rate referred to part of the year (the winter) only. The annual rate of absence would have been smaller. Next, the winter of 1837-8 was not typical. There were three causes of absence reported by the Committee. One was ʺthe sickness of the childrenʺ, the second, ʺthe unwillingness of the parents to expose their children to the inclemency of the weatherʺ. The Committee added: ʺThis was particularly the case during last winter, which was remarkable for its 31
Schofield, loc. cit. 439 (my emphasis) Ibid. 439. 33 'Second Report of a Committee of the Statistical Society of London, Appointed to Enquire into the State of Education in Westminster', Journal of the Statistical Society of London, 1 (1838), 193-215 (my emphasis). 32
11
great and long-continued severity.ʺ The third cause of school absence in the sub-group was unemployment. This factor, which could have been related to the severity of the winter, obviously prevented some parents paying the fees. Schofield mentions neither the sickness nor the severe winter. He simply deduces the general statement that the fees in most schools were an important barrier; and he does this in a way that gives the impression that they prevented the average family from buying education in the typical school. But whatever the balance of causes, the real absence rate reported by the Westminster Committee for 1837-8 would not look unusual in the English state schools of the 1970ʹs, especially in the winter months, and more especially when sickness epidemics (like influenza) occur. Schofield switches from his literacy figures into schooling statistics in order to support his hypothesis that education was more the effect than the cause of economic growth. His argument is that if schooling was of economic value the parents would have invested in it widely and voluntarily. Because the education that really promoted productivity was related to more practical skills, the schools, which provided literary skills only, were not well patronized. This argument is difficult to accept for three reasons. First, parents did invest in education widely and voluntarily. Second, Schofieldʹs argument does not explain satisfactorily how the literacy rates did manage to improve so strikingly. Third, he makes errors in his numerical estimates of schooling. The latter he gathers from the same single example from the independent surveys of the 1830ʹs (apparently having forgotten that he warned readers that this route is ʺfraught with dangerʺ). Referring once more, and exclusively, to the survey of education in Westminster to show that the parents wanted a practical not a literary education, Schofield concludes: ʺConsequently, few
12
children were regular in attendance, and few remained at school for more than 1.5 years.ʺ34 The incorrectness of his estimates of attendance has already been explained. The next issue is school duration. Nowhere in the Committeeʹs report is there any statement about the typical child receiving in his lifetime a schooling of not more than one and a half years. What is included is an investigation of each of the eight prevailing types of school and a reference to the fact that, in three types of school, the entrances within the course of the year exceeded the number of children upon the books. This suggested, at most, a high turnover in these particular schools. But in those days of high mobility and competition between schools, the children typically accumulated several years of schooling from several schools, having relatively short stays at each.35 Schofieldʹs estimate of one and a half years neglects this fact and is therefore far too low. The Newcastle report for 1858 found that on the average for the whole country the children of the working class alone were receiving an education of 5.7 years. Horace Mann, the compiler of the special educational extension to the national census of 1851 stated that for that year working-class children over the whole country were receiving a schooling that was ʺmore than four years, and more than four and a half years”.36 For these reasons it is difficult to accept Schofieldʹs judgement that ʺthe prospect of upward mobility for their children did not lead many working-class parents to invest heavily in education.”37 The four and above years of schooling on the average for working-class children in 1851, reported by Horace Mann, were paid for substantially by the parents.
34
Schofield, loc. cit. 452 West, Education and the Industrial Revolution, p. 83 36 Commissioners on Popular Education, Minutes of Evidence (Parl. Papers, 1861, xxi, pt vi), H. Mann, Q.833 37 Schofield, loc cit. 415 35
13
Both Schofield and Sanderson venture the arguments that fee paying was a significant barrier to the working class and that accordingly they had to wait for public action to provide nearly free schooling. Neither of these arguments can be accepted. According to the Manchester Statistical Society, 80 per cent of the school-childrenʹs education in Manchester in 1834 was paid for entirely by parental fees. The remaining 20 per cent was paid for partly by fees.38 The same study suggests that at least four out of five Manchester children were being schooled. Neighbouring Pendleton (Salford) schooled 97 per cent of its children in 1838 and, according to the particularly intensive survey of this township by the Manchester Statistical Society, one-third of the school-goers remained for three to five years, one-third above five years, and one-third less than three years (figures that are fairly consistent with the national estimate of Horace Mann).39 E. J. Hobsbawm has recently given the opinion that the quantitative study of education that has made so much progress since 1963 is largely due to the study of parochial records of marriage signatures. School statistics (attendance and availability), Hobsbawm adds, have also been scrutinized for ʺoptimisticʺ purposes, ʺbut their value remains in serious doubtʺ.40 If their value is in such doubt then this would reduce confidence in much of the reasoning of Schofield and Sanderson who themselves ultimately rely on them. In the context of the precise facts reported in the Westminster statistical report, Hobsbawm presumably might describe Schofield as selectively scrutinizing the school statistics for ʺpessimisticʺ purposes. The truth is that there are dangers in using all sources, including the parochial returns, as the earlier discussion has shown. Consider Hobsbawmʹs own conclusions. He argues that the marriage-signature studies suggest a halt or even a reversal in the long-term progress of literacy during the early industrial period, at least in industrial
38
West, Education and the Industrial Revolution, p. 86. Ibid. p.18. 40 E. J. Hobsbawrn, 'The Standard of Living Debate', in A. J. Taylor, ed. The Standard of Living in the Industrial Revolution (1975), p. 83. 39
14
Lancashire up to the late 1820ʹs. Schofieldʹs figures, however, show that average literacy rates (males plus females) measured at the school leaving stage were slowly rising throughout. Second, the same figures point to 1790s as a significant improvement point for men (1800 in Lancashire). Third, in all cases the trend of the early industrial period was about the same as the two decades that preceded it. The new industrialism therefore cannot be argued to have had a depressing effect. It is too hasty, however, immediately to dismiss any data, whether of literacy or of schooling, the moment a difficulty or complexity arises. Usually, after some sensible expressed qualification, the information from most sources can be employed, tentatively at least; and confidence will be increased if a consistent pattern from the various sources seems to emerge. Now, a general pattern does emerge from the various sources on schooling.
Such is the case, for instance, concerning national statistics of school
population, attendance, and years duration. It is not persuasive to argue against them that, in contrast, the literacy figures are preferable because they derive from an official government source, and one therefore that provides the most standard and disinterested test of education. The 1851 figures of Horace Mann on schooling also came from a central government official source and indeed from the same office - the Registrar-Generalʹs. Moreover, this was an all-inclusive universal census.
The
marriage-signature test of literacy, in contrast, was not all-inclusive, but related only to the 90 per cent or so of the population who were ever married. And for the years before 1839 we have to rely on samples of parishes. The 1851 census figures reported 2.14 million scholars with an average of over four yearsʹ schooling. Further confidence in these figures is encouraged when we look at their consistency with those of the Newcastle Commission for the year 1859 (with its larger population) which reported 2.54 million scholars. Horace Mann, who completed the 1851 figures for the Registrar-General, encourages the same view with his statement that
15
ʺthe estimate
of 1859 (Newcastle Commission) is supported by the results of the
previous and more extensive (1851 census) inquiry.ʺ41 And the Newcastle Commission reported that over 90 per cent of children were receiving a schooling; and this long before schooling was ʺfreeʺ and compulsory. When we consider the 1760-1840 period we certainly have to ʺreach backʹ from the 1851 census and rely on a great variety of education surveys and circumstantial evidence. But if the marriage-signature specialists do the same, they cannot simultaneously object that these sources are completely ʺunreliableʺ. All sources should be carefully sifted for what threads they have to offer, despite initial difficulties. Even the marriage-signature evidence is often ambiguous, at least in the first instance. This is clear, for example, when we remember the questions or assumptions one has to make about migration before one can use the parochial returns. Obviously, the evidence on literacy and schooling is interdependent. Those who set out to be ʺpureʺ specialists in the one invariably succumb to the temptation to merge their findings with information they obtain about the other. Literacy specialists usually describe figures of schooling as ʺindirect evidenceʺ of literacy. Schooling specialists, meanwhile, regard literacy as ʺindirect evidenceʺ of schooling. Surely the two specialisms or approaches can converge. And this should be welcomed, for total knowledge will progress better with competition and cross-checking from both sides. IV The remaining part of this article will attempt to illustrate this by showing how the data on literacy can be used to check speculations or hypotheses about schooling. Schofield offered the hypothesis that a substantial number of parents did not school their children when ʺvery few genuinely free places were availableʺ.42 Similarly, Sanderson argued
41
Horace Mann, 'National Education', Transactions of the British Association for the Promotion of Social Science, Bristol Meeting, 1869 (1869). 42 Schofield, loc. Cit. 439.
16
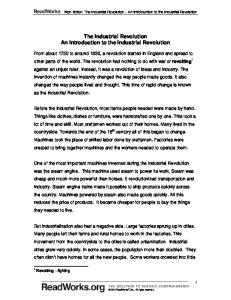
that fees were a strong barrier to the lower orders.43 Schofieldʹs second hypothesis stated that compulsion of the law was even more important in obtaining universal investment in education and therefore literacy. A third hypothesis, which is more explicit in Sanderson, but is at least hinted at in Schofield, is that the supply of education was largely an ʺexogenousʺ event to industrialism and to individual (family) self-help; that is, it came largely from the initiative of ʺpublic agenciesʺ whose task it was eventually ʺto combat those adverse effects of industrialization. . .”44 Consider now the latest data on nineteenth-century literacy. Schofield plotted national annual illiteracy rates (percentages unable to sign) on a semi-logarithmic scale showing percentage of illiteracy on the vertical ordinate and on two horizontal ordinates-marriage dates and school-leaving. His diagram is reproduced here as Fig. I. Schofield argues that ʺthe fastest rate of improvement was amongst those leaving school after about 1870.ʺ45 In Fig. I he is referring to the graph that relates to the bottom horizontal axis that refers to schooling. Schofield assumes that marriage signatures reflect on the average school-leaving fifteen years before marriage. Whether he intended it or not, 1870 will trigger off in most minds the famous Forster Education Act of the same year, the most vigorous, ambitious, and celebrated piece of Victorian educational legislation, which eventually made “public agenciesʺ supersede private in school provision. When we refer exclusively to the bottom (school) axis, both curves in Fig. I do indeed show a distinct point of inflexion (or kink) in the later part of the century. But Schofield is wrong in locating it at 1870. Rather it is in 1867, three years before the Forster Act. The first time Forsterʹs legislation could have had any significant influence on schooling must, in any case, have been some few years after 1870. The legislation did 43 44
Sanderson, loc. cit. (1972), 80. Ibid. III
17
not pass through Parliament until after the middle of the year in 1870. It then took some time to establish school boards. When they were elected their time was initially taken up electing chairmen, vice-chairmen, finance committees, school sites and building committees, school staffing committees, and education committees. The boards then had to make extensive inquiries about educational deficiencies in their areas, and this often resulted in protracted correspondence with the Registrarʹs Office. Where a deficiency was found, the private schools were given a period of grace to give them a chance to ʺfill the gapsʺ. After this period and, where ʺdeficienciesʺ remained, the school boards had next to draw up and debate various plans, negotiate loans from the Public Works Commission, and eventually appoint architects and builders. To illustrate, the first effective school board in Northampton was elected in January 1871. But the various procedures took two years to carry out, while the first (newly built) board school was not opened until October 1874.46 On the assumption that an efficient schooling lasts six years at minimum, the Actʹs effects on education and literacy in Northampton would not, therefore, begin to show until the school leavers of 1880 who, of course, were married several years later. Return to Schofieldʹs assumption that the marriage registers reflect school leaving fifteen years before marriage. (I shall not press my own preference, explained above, for a lag of seventeen years.) The point on the graph, for instance, for 1870, reading from the bottom (school) axis, represents the marriage-signature rates in 1885. This must next be qualified. If individuals were married on the average fifteen years after school, there would be a certain number on either side of the average. We must therefore make some qualification.
45
Schofield, loc. cit. 443. Northampton Mercury, 25 Nov, 876. I am grateful to Victor A. Hatley of Northampton for supplying me with this source. I am aware that some boards opened schools earlier, but these were usually existing private schools that were soon taken over by them. I am only concerned here with net improvements in school supply which would show up in entirely new buildings.
46
18
Throughout these years individuals who married under 20 years of age were under a half of 1 per cent of the total population.47 For practical purposes, therefore, I shall take the 20-year-old grooms and bridegrooms as being ʺthe first of the fewʺ to appear in the nineteenth century who could possibly have benefited from Forsterʹs Act. To give the Act the fullest chance I shall also assume that those who married youngest needed education most. But even supposing that all school-leavers were in this category (all married ten years after school), and assuming building time lags similar to Northamptonʹs, the first school-leavers to benefit from the Forster schooling (as in Northampton) would not appear until well to the right of the kink in the curve, say 1876 at the earliest. This point is indicated in Fig. 2. This figure is identical with Fig 1 except for the addition of my vertical arrows with associated explanations. If we now extrapolate the curve onwards to the late 1890ʹs from that part of the curve between the turning-point of 1867 to 1876, the latter year, to repeat, being the first possible influence of the 1870 Act, we obtain an almost linear trend result.
This
pre-Forster trend shows approximately the same ʺsuccess rateʺ as that in Fig. 1. The data in the diagram therefore do not, at least at first sight, support the third hypothesis that major literacy improvement had to wait for public (government) initiative. We should remember, however, that some intervention was operative before 1870. This was a system of subsidies to all kinds of private schools. More precisely, the diagram suggests that this mixed private and public system (dating from 1833) was just as efficient as the new apparatus of ʺnationalizedʺ school intervention introduced by Forster.48 With respect to making education ʺfreeʺ, the extrapolation of the trend established between 1867 and 1876 suggests that it made no difference. And even if it did, its maximum effect shown in the diagram is merely an improvement in the national literacy rate of 1 per cent-from 98 to 99 per cent. Similarly, the extrapolated trend suggests that 47
Mitchell and Deane, op. cit. Table 5, p.151. The average marriage age was nearly 28 years in 1881 according to the Registrar-General's Report (Vol. iv) for that year.
19
compulsion had negligible effect. And even if it did, it could have affected literacy at most by making only 31 per cent of the total population literate. V
I conclude that the recent attempts to reject Bowman and Andersonʹs ʺthreshold theoryʺ of literacy, as it applies to England and Wales, have not been successful; second, that available national estimates do not demonstrate that the Industrial Revolution depressed literacy-even if we consider the rate for males or females exclusively; third, that the date of distinct improvement in the national literacy trend coincided with the beginnings of the large-scale factory system; and fourth, that the apparent local exception of Lancashire is closer to the national trend than has been believed, and that in any case when we take Irish immigration into account, the association between education and economic growth is considerably strengthened. Finally, I have shown that, despite the attempts by historians of literacy and historians of schooling to keep their studies separate, this is not easily achieved in practice. The convergence of the two approaches never the less is necessary, although it is still important for the one specialist carefully to cross-check the use of his sources by the other. Evidence on literacy has its difficulties and problems, just as does evidence on schooling.
But, if properly
handled, both can still yield the truest, rather than the most ʺpessimisticʺ or ʺoptimisticʺ, view of eighteenth or nineteenth-century educational progress. Carleton University, Ottawa
48
This finding supports a central argument in my Education and the Industrial Revolution, an argument that Sanderson, in his review of it (1976) seems strangely to have overlooked; for he presents me as arguing simply that "state intervention was of doubtful necessity."
20