LIQUIDITY RISK AND EXPECTED STOCK RETURNS: EVIDENCE FROM THE UK
By Iryna Doroshenko
Submitted to Central European University Department of Economics
CEU eTD Collection
In partial fulfilment of the requirements for the degree of Master of Economics
Supervisor: Professor Peter Kondor
Budapest, Hungary 2011
Abstract
The paper analyses whether liquidity has an impact on asset pricing on the UK stock market, over time period 2001-2011. I use daily time-series regressions on three Fama-French factor model and four-factor model with liquidity factor. I form different portfolios according to decreasing liquidity for which holders would expect different stock returns. The liquidity measure is based on relative spread. The results show that market illiquidity has a positive
CEU eTD Collection
effect on expected stock returns.
i
The Table of Contents
CEU eTD Collection
Introduction ........................................................................................................................... 1 Chapter 1. Literature review .................................................................................................. 3 1.1. The concept of liquidity and liquidity measures ...........................................................3 1.2. Studies on Different Markets........................................................................................4 1.3. Researches on the London Stock Exchange ..................................................................6 Chapter 2. Data...................................................................................................................... 8 Chapter 3. Model ................................................................................................................. 11 3.1. Fama-French Framework ........................................................................................... 11 3.2. Constructing Liquidity Measure ................................................................................. 13 Chapter 4. Results................................................................................................................ 14 Conclusions ......................................................................................................................... 21 References ........................................................................................................................... 23
ii
Introduction Liquidity is considered to be an important factor during investment making decision. Sodenberg (2007, p. 1) defines liquidity as the ―ability to buy or sell large quantities of an asset quickly and at a low cost, which is of interest for portfolio managers and risk management practitioners‖. Although it is not a simple concept, and there is no definition that can fully explain all its properties, there is extensive number of research on the topic. According to the liquidity premium theory, the liquidity should be priced. Thus, companies that are considered to be more illiquid are supposed to have higher returns than more liquid companies. The relevant literature discusses various liquidity measures in support of liquidity premium theory. The first study on this field was made by Amihud and Mendelson(1986) where they checked consistence of increasing of returns with their bid-ask prices. After, a number of research is done on this topic, analyzing expected returns, asset pricing and systematic liquidity risk. As liquidity is not observable, different economists suggest various proxies for liquidity and models that test liquidity pricing on the market. Except based on bid-ask spread, the most measures are constructed on such variables as
CEU eTD Collection
volumes and turnover. Volume as a proxy for liquidity is taken testing whether large volumes can be traded without distorting prices. The main goal of the research is to investigate stock exchange for relation between expected return and liquidity on the UK stock exchange. For this purpose I choose FamaFrench (1993) framework with extension for liquidity factor. The liquidity measure is based on relative spread and constructed similar to Liu (2004), Dzhumurat and Lunina (2010). I observe daily data for last ten years for FTSE100, and based on it analyze it for liquidity pricing on the market. The dataset contains 2522 observations and 74 stocks from 1
the index that were traded across the whole time horizon. Out of the stocks I form seven portfolios based on decreasing liquidity in order to check whether there is an effect on expected returns through portfolios with different liquidity. Each portfolio is reformed in the end of the day and can consist of different stocks through different time. The research is organized in a following way. Chapter 1 describes literature review on the topic. Chapter 2 represents data and sample. Chapter 3 contains the methodology and liquidity measures used during the analyses. Chapter 4 reports the results, chapter 5
CEU eTD Collection
concludes.
2
Chapter 1. Literature review 1.1. The concept of liquidity and liquidity measures The term liquidity does not have a unique definition that can capture all its properties. Simply, it means ability of trading assets quickly without distorting prices. Some economists like Wyss (2004) claim the reason for non-existing of the unique definition is that liquidity is a several dimension variable and not a single one. Usually scholars give a definition to it according to one of the dimension. Thus, Chollete, Nas and Skjeltorp(2007) claim that there are four dimensions of liquidity that can be captured by different variables. The first one is width, which can be measured by spread. The second dimension is depth which can be viewed as volume or the total number of shares that were trading during the defined period of time. The next one is immediacy that is ability of quickly trading. It can be captured by turnover. The last dimension is resiliency which shows the ability of trade with minimal effect on the price. Liquidity is not an observable measure. Therefore, there is extensive research based on different proxies as a liquidity measure. The number of scholars use spread as a proxy for
CEU eTD Collection
liquidity. Thus, Amihud (1986) used bid-ask spread in his research to check the influence of it on the asset pricing. Another study is also done by Amihud and Mendelson (1989) that proves that there is negative relation between stock returns and liquidity which is measured by bidask spread. Martinez, Nieto and Rubio did a study based on relative spread as a liquidity measure. They construct a factor that shows how the stock is sensitive to variations in relative spread. Goyenko R., Holden C., Trzcinka C. (2008) construct measure based on effective spread and price impact.
3
Recently an extensive research appeared that base the liquidity measure on volume. One of them is Pastor and Stambaugh (2003) study. The main idea is to form order flow that is followed by price changes. The hypothesis is that for a given dollar volume which is a part of order flow there is a larger expected reversal for stock return, the stock is more illiquid. Another research that constructs liquidity measure based on volume proxy is done by Amihud (2002). The measure is obtained as average ratio of stock return to its volume on some day, and is inversely related to the Amivest measure which is calculated as ratio of the sum of volume of the day to the sum of the absolute return. Another proxy which might be used for liquidity measure is turnover. For example, Lam and Tam (2011) use it as a proxy for investigating liquidity and asset pricing on Hong Kong stock market. In their study they construct portfolios based on intersection of turnover ratio and size of companies.
1.2. Studies on Different Markets Primarily, most studies on the topic are done on the US stock market. Thus, Amihud and Mendelson investigated for effect of liquidity on expected returns on NYSE over 1961-
CEU eTD Collection
1980. Analyzing liquidity based on relative bid-ask spread they found a positive relation between expected return and spread. Similarly, another research on the NYSE was done by Amihud in 2002. Constructing a new factor he checked the consistence of the theory over 1964-1997 with monthly data. The hypothesis is that excess return on a stock also shows a compensation for illiquidity. Thus, with illiquidity factor Amihud founds a significant effect on expected return. Another research done on the market is one by Nguyen and Puri (2009). They test for effect of liquidity on the stock return in NYSE-AMEX and Nasdaq stock markets over 1963-
4
2004. For the research they use Fama-French factor model with Pastor and Stambaugh liquidity factor. For comparing, they use only Fama-French three factor model, arguing that if both three- and four- factor models cannot explain liquidity level, then Pastor and Stambaugh measure also can not do it. The results show that expected return has a positive correlation with illiquidity. A number of studies are done for European stock markets. Thus, the theory of liquidity premium was tested for London, Spanish, Scandinavian stock exchanges. Extensive research was done for stock markets of emerging countries. For example, Martinez, Nieto and Tapia (2005) analyzed Spanish stock market for variations of average stock returns using two different liquidity factors. First, they analyze the stock exchange with Pastor and Stambaugh liquidity factor. Its main idea is financial markets are liquid if they can quickly provide large volumes of trading with the same price. Second, the authors construct their own factor based on relative spread. The main idea of this factor is creating portfolios as difference in returns with high sensitivity on long position to ones with low sensitivity on a short position. The results show that liquidity is not priced on the Spanish stock market.
CEU eTD Collection
Another research on European stock exchange was done by Chollete, Nas, Skjeltorp(2007). The Scholars used width, depth, immediacy and resiliency as a set of variables to analyze Norwegian Stock market. They divided them into trade-based and order based measures according to proxies they use. Thus, for investigating with trade-based method the authors use such proxies: effective spread and real effective spread for width, trading volume and trading frequency for depth, seconds between trades, turnover, trades per order for immediacy, liquidity ratio for resiliency. Order-based measures are: quoted and real quoted spread for width, depth, inner quotes, price and tick slopes for depth, order book
5
symmetry and fill time for immediacy. The results show that two liquidity factors relate to cross-sectional variations in returns. Similarly, Sodenberg (2007) made another research on Norwegian stock market. For analysis they constructed a measure using Amihud (2002) illiquidity factor which is average of daily absolute return to trading volume, and Lesmond, Ogden and Trzcinka likelihood estimator. The results show that return is the important factor of illiquidity. Some studies concentrate also on non-US and European markets. One of them was done by L’Her J., Masmoudi T. and Suret J on Canadian stock market over 1960-2001 (2004). As a methodology the authors used Fama-French framework with adding momentum factor. As a momentum factor the scholars use WML (winners minus losers). The results show factor premiums of around five per cent, and larger market premium which is consistent with previous research. Lam and Tam (2011) investigated Hong Kong stock market. The authors found that liquidity plays an important role in pricing return. For methodology they constructed three sets of ratio and one of the liquidity proxies, only one of the liquidity proxies. They analyze CAPM, Fama-French and liquidity augmented three factor models. For each portfolio they
CEU eTD Collection
run OLS time-series regressions. As a result they do not find evidence for liquidity pricing on Hong Kong stock market.
1.3. Researches on the London Stock Exchange A number of research is done for London stock exchange. Galariotis and Giouvris (2009) investigated systematic liquidity and excess returns on the London Stock Exchange over 1996-2001. During the research they analyzed the UK FTSE100 and FTSE250 stocks. The authors chose spread as a proxy for liquidity, and the main idea was to search and extract
6
a common factor for two indexes. The results show that systematic liquidity is important factor in stock pricing. Another study was made by Gregory, Tharyan and Huang (2009). The main idea was to create portfolios and factors similarly to Fama -French for UK market. The authors took 350 largest companies and with monthly data created portfolios similar to those available on the Kenneth Fama’s website, and constructed UMD (Up-minus-Down) liquidity measure. The results show cross-correlation of the factors. Gregoroiou, Ioannidis and Zhu (2011) investigate commonality in liquidity on London stock exchange over 2005-2009. Their results confirm comovements in liquidity on the UK stock market through stocks of FTSE100. They analyze the period before and after financial crisis, and the findings show that commonality is significant in both time intervals. Foran, Hutchinson and Sullivan (2010) analyze UK stock market over 1986-2007. They use Fama-French model CAPM with momentum, illiquid-minus-liquid which is constructed based on Amihud (2002) measure and liquidity factor based on spread, volume or turnover. The findings show that liquidity is an important factor for stock returns. To sum up, most of the research is concentrated on US stock market. Lately a number
CEU eTD Collection
of scholars started to analyze an effect of liquidity on asset pricing on European markets. Usually results are consistent with the theory that illiquidity has a positive relation with expected returns which was confirmed by a number of studies. Most findings show that systematic liquidity is an important factor for asset pricing.
7
Chapter 2. Data For the research I take data for London stock exchange, FTSE100 index. FTSE 100 consists of 100 the largest UK blue chip companies and represents about 82% of the UK’s market capitalization. To be on the list the companies pass screening for size and liquidity. This index also gives a reason for a good proxy for UK stock market as the stocks in it are heavily traded. The largest companies that FTSE 100 contains are BHP Billiton, Royal Dutch Shell, HSBC, Vodafone Group, BP, Rio Tinto Group, GlaxoSmithKline, Unilever, British American Tobacco, BG Group. The market capitalization of these companies is over 850 billion pounds. The time horizon was taken for the estimation is 10 years from 17th of May 2001 to 13th of May 2011. The daily data was obtained from Data Stream and Reuters databases. For the research I observed such variables as bid-ask prices, return index, market capitalization and book-to market ratio of the companies. For constructing a model I excluded the companies that appeared on the list only recent years, and were there only for a couple last years. All the companies with the negative book-to-market ratio were excluded form the list. Thus, the list was shorted to the 74
CEU eTD Collection
company of the index. As a methodology I use Fama-French framework and I examine such factors as Rm
R f (market excess return), SMB (small-minus-big) and HML (high-minus-low) factors
with extension for liquidity measures . Market return was calculated as value-weighted return of the companies that were included in the list. Risk-free return is UK three months T-bill return and was obtained from the Bank’s of England website.
8
SMB and HML were constructed according to the Fama-French methodology. The factors are based on market capitalization, book-to-market value and average returns. Liquidity factors were constructed based on relative spread similarly to Liu(2004), Dzhumurat and Lunina(2010). Relative spread is defined as a ratio of spread to the average of bid-ask prices. Out of 2522 observations for 74 firms, all the individual stocks were taken to construct seven portfolios based on relative ask-bid spread as a proxy for liquidity, so there are teneleven companies in each portfolio. Each portfolio is rebalanced daily. Days without trading such as weekends or holidays were omitted from the dataset. Relative spread was taken as a liquidity measure, and companies were divided into portfolios according to it. The relative spread was calculated for each stock and then it was related to one of the portfolio depending in which percentile of its relative spread for the trading day. Thus, stocks with the smallest relative spread were designed to the first portfolio which represents the most liquid stock group. The last portfolio includes the most illiquid stocks. Portfolio’s return for each day was calculated as the average return of the companies that were included. Descriptive statistics for the portfolios’ excess returns is provided in the Table 1.
CEU eTD Collection
TABLE 1. DESCRIPTIVE STATISTICS FOR SEVEN PORTFOLIOS SORTED BY DECREASING LIQUIDITY.
Portfolio Mean
Std. Dev. Min
Max
Kurtosis Skew
1 2 3 4 5 6 7
.0130948 .0138212 .0134523 .0136424 .0152242 .0150824 .0164074
.105153 .0940475 .0904336 .0840905 .120868 .1178433 .1140098
0,673175 0,442779 0,248959 0,191038 0,721039 1,123658 1,138529
.0006137 .0004386 .0003587 .0004499 .0005554 .000492 .0008453
-.0759107 -.0935541 -.0846261 -.0836468 -.1011556 -.0850126 -.1275564
9
0,0661 0,039966 0,019529 0,021872 0,116709 0,261443 0,154125
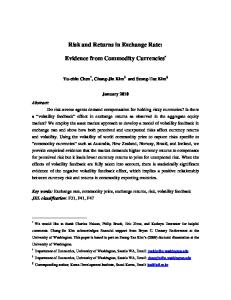
Portfolios are sorted according to decreasing liquidity. According to the theory it should lead to increasing of the mean excess returns, what is not observable in the table and figure 1. The table also reports standard deviation of the portfolio’s excess returns, minimum and maximum value within it. FIGURE 1. AVERAGE EXCESS RETURN OF PORTFOLIOS.
average excess return of portfolio
excess return of i portfolio 0,0009 0,0008 0,0007 0,0006 0,0005 0,0004 0,0003 0,0002 0,0001 0
excess return of i portfolio
1
2
3
4
5
6
7
Based on our kurtosis and skewness values we see that return series is not normally distributed, there is positively skewed leptokurtic. It means that most of the observations lie to the right from a median value and there are infrequent extreme values which cause slightly
CEU eTD Collection
fatter tails in the sample distribution.
10
Chapter 3. Model 3.1. Fama-French Framework In this chapter I test whether stock’s expected returns are sensitive to the liquidity factors. Sensitivity is defined as a slope coefficient of liquidity factors. For this purpose I estimate Fama-French model and a four-factor model that includes liquidity measure based on relative spread. As Nguyen, Puri (2006) pointed out, the reason of time series is also controlling for characteristic liquidity. First, it is done by testing different portfolios which are formed according to relative spread. Second, characteristic liquidity is checked by the significance of the intercepts of the model. If the factors absorb characteristic liquidity, there should be no increase in the intercepts. First, I estimate time-series regression of excess return of the seven portfolios on three-factor Fama-French model using ordinary least squares: ri ,t
t
t
RM M ,t
S ,t
SMBt
V ,t
HMLt
i ,t
, where
ri is a daily excess return of the i portfolio in day t.
RM is a market risk premium that was calculated as value-weighted excess return of
CEU eTD Collection
the firms that were included to the list. Risk-free return is realized return of 3-month UK Tbills.
SMB is a size-related factor and is defined as an average return on a small stock’s portfolio minus an average return on big stock’s portfolio. For constructing the measure I divided all the stocks into the big and small groups according to the market capitalization. For each day I found the median value, and the companies that were over the breakpoint were related to the big size, otherwise they were put in the group of the small companies.
11
HML is formed accordingly to book-to-market ratio and is a difference of average returns of high book-to market values’ portfolio and low-book-to market values’ portfolio. The stocks that had the highest 30 percent book-to-market ratio were taken to ―High group‖, the stocks with lower value than the breakpoint of 30 percent were put to the ―Low‖, and the middle 40 percent were related to ―Neutral‖. Thus, I formed six value-weighted groups according to the size and book-to-market value: Small Low (SL), Small Neutral (SN), Small High (SH), Big Low (BL), Big Neutral (BN) and Bid High (BH). Each group has a different number of stocks. SMB was formed in a following way: (( SL SN
SMB
SH ) ( BL BN 3
BH ))
HML equals a difference between average returns on the value stock portfolios and growth stock portfolios: (( SH
HML
BH ) ( SL BL)) 2
Second, for a comparative analysis I extent three-factor Fama-French model for liquidity factors. The construction of the factors is explained below. The method used is also CEU eTD Collection
ordinary least squares as follows: ri ,t
t
t
RM M ,t
S ,t
SMBt
V ,t
HMLt
LIQt
i ,t
, where
RM M ,t , SMBt , HMLt are three Fama-French factors , LIQt is a liquidity factor
based on relative spread.
12
3.2. Constructing Liquidity Measure During the estimation I included liquidity factor LIQ in the model that defines as illiquid minus liquid, and is constructed similar to Liu (2004), Dzhumurat and Lunina (2010). The proxy that was taken for the measure is relative spread. Relative spread is defined as ratio of the bid-ask spread to the average of bid-ask prices. Thus, all the stocks are divided into the groups according to the relative spread values. The lowest 30 percent are considered to be liquid, the middle 40 percent – neutral, and the stocks over the breakpoint of 70 percent – illiquid. The measure is designed as the difference of average returns between liquid and illiquid stocks. So, after I estimate the following regression:
ri ,t
t
t
RM M ,t
S ,t
SMBt
V ,t
HMLt
t
LIQt
t
, where
RM M ,t , SMBt , HMLt are three Fama-French factors , LIQt is a liquidity factor
based on relative spread. The second liquidity measure was constructed in order for size control and was formed in the next way: there were constructed 4 value-weighted groups accordingly to the liquidity and size: Illiquid Small (IS), Illiquid Big (IB), Liquid Small (LS), Liquid Big (LB).
CEU eTD Collection
The liquidity factor was designed as follows: ( IS IB) ( LS LB) 2
LIQ2
So, the last regression looks in the next way:
ri ,t
t
t
RM M ,t
S ,t
SMBt
V ,t
HMLt
t
LIQ 2t
t,
where
RM M ,t , SMBt , HMLt are three factors of Fama-French model , LIQ2t is a liquidity
factor based on relative spread and controlled for size.
13
Chapter 4. Results First, I present the structure of liquidity factors, which is reported in the table 2. The illiquidity premium is larger in the first factor, which is constructed only by size, and equals 0,0821%. Control for size decreases liquidity premium. Although second liquidity factor, controlled for both spread and size, leads to increasing of average return on the stocks to 0.0147% while the first liquidity factor has negative average return that equals to -0,025%. TABLE 2. THE STRUCTURE OF LIQUIDITY FACTORS.
LIQ
LIQ2 Illiquid Liquid Liquid Illiquid Small Big Small Big 0,0572% 0,0821% 0,0778% 0,0614% 0,0522% 0,0576% Notes: the data reports average return of the components of liquidity factors. LIQ is the factor constructed on the relative spread only, LIQ2 is a factor based on spread and size.
Tables 3 and 4 report correlation between the factors. As we can see, controlling by size decreases the correlation between the liquidity factor and size mimicking portfolio by 9,23% in absolute value. Correlation between liquidity factor and market factor is also declined by around 9% in absolute value in case of controlling by size. TABLE 3. CORRELATION BETWEEN THREE FAMA-FRENCH FACTORS AND LIQUIDITY
CEU eTD Collection
FACTOR BASED ON RELATIVE SPREAD (SMB, HML, RM, LIQ) .
SMB HML RM LIQ
SMB 1.0000 0.2389 -0.2004 -0.1011
HML
RM
LIQ
1.0000 -0.0439 1.0000 -0.0975 -0.0922 1.0000
Notes: RM is excess return on the market and equals Rm - R f , where Rm represents the daily return of FTSE 100, and R f stands for realized return for 3 month UK T-bill. LIQ is liquidity measure which is defined as illiquid minus liquid.
14
TABLE 4. CORRELATION BETWEEN THREE FAMA-FRENCH FACTORS AND LIQUIDITY FACTOR BASED ON RELATIVE SPREAD AND SIZE (SMB, HML, RM, LIQ2).
SMB HML RM LIQ2
SMB 1.0000 0.2389 -0.2004 -0.0088
HML
RM
LIQ2
1.0000 -0.0439 1.0000 0.0408 0.0013
1.0000
Notes: RM is excess return on the market and equals Rm - R f , where Rm represents the daily return of FTSE 100, and R f stands for realized return for 3 month UK T-bill. LIQ is liquidity measure which is defined as illiquid minus liquid, controlled for size.
Table 5 contains the results of three-factor Fama –French model. According to them the stock returns are the most sensitive to the market and size factors. These factors are significant for all portfolios. HML is significant only for three out of seven portfolios. Intercepts are not significant for every portfolio, which suggests that validity of the FamaFrench model. Also systematic increasing of intercepts is not observed what means that Fama-French factors do not subsume the impact of characteristic liquidity on stock returns.
TABLE 5. MAIN RESULTS OF THREE FAMA-FRENCH FACTOR MODEL. 1 SMB
CEU eTD Collection
HML RM Constant
2
3
4
5
6
7
0.113*** 0.236*** 0.318*** 0.328*** 0.301*** 0.354*** 0.390*** (0.0197) (0.0280) (0.0232) (0.0271) (0.0387) (0.0319) (0.0548) -0.0721*** -0.0343 -0.0594*** -0.0353** -0.0203 0.0144 -0.0243 (0.0156) (0.0215) (0.0176) (0.0179) (0.0245) (0.0249) (0.0321) 0.191*** 0.203*** 0.203*** 0.204*** 0.222*** 0.218*** 0.227*** (0.00231) (0.00323) (0.00314) (0.00288) (0.00369) (0.00366) (0.00470) 0.000402*** 0.000227* 0.000127 0.000230* 0.000330** 0.000285* 0.000606*** (9.67e-05) (0.000117) (0.000110) (0.000119) (0.000141) (0.000153) (0.000183)
Observations 2,522 R-squared 0.865
2,522 0.822
2,522 0.831
2,522 0.811
2,522 0.790
2,522 0.756
2,522 0.692
Notes: SMB, HML, RM are three factors Fama-French model. All portfolios are sorted with decreasing of liquidity. Robust standard errors in parentheses. *** p