J R C
R E F E R E N C E
R E P O R T S
Liquefied Natural Gas for Europe – Some Important Issues for Consideration B. Kavalov, H. Petric, ´ A. Georgakaki 2 0 0 9
Report EUR 23818 EN
The mission of the JRC-IE is to provide support to Community policies related to both nuclear and non-nuclear energy in order to ensure sustainable, secure and efficient energy production, distribution and use.
European Commission Joint Research Centre Institute for Energy Contact information Boyan Kavalov E-mail:
[email protected] Tel.: +31 224 56 54 78
Hrvoje Petri´c E-mail:
[email protected] Tel. : +31 224 56 50 23
http://ie.jrc.ec.europa.eu/ http://www.jrc.ec.europa.eu/ This publication is a Reference Report by the Joint Research Centre of the European Commission. Legal Notice Neither the European Commission nor any person acting on behalf of the Commission is responsible for the use which might be made of this publication. The use of trademarks in this publication does not constitute an endorsement by the European Commission. The views expressed in this publication are the sole responsibility of the author(s) and do not necessarily reflect the views of the European Commission. Europe Direct is a service to help you find answers to your questions about the European Union Freephone number (*): 00 800 6 7 8 9 10 11 (*) Certain mobile telephone operators do not allow access to 00 800 numbers or these calls may be billed.
A great deal of additional information on the European Union is available on the Internet. It can be accessed through the Europa server http://europa.eu/. JRC 47887 EUR 23818 EN ISBN 978-92-79-12392-4 ISSN 1018-5593 DOI 10.2790/1045 Luxembourg: Office for Official Publications of the European Communities © European Communities, 2009 Reproduction is authorised provided the source is acknowledged. Reproduction of the graphs from Ocean Shipping Consultants is not allowed. Main cover picture: Photo courtesy of FERC (US Federal Energy Regulatory Commission). Printed in the Netherlands
PREFACE The delivery of liquefied natural gas (LNG) from various suppliers by sea, as an alternative to pipeline shipments and supplies, is seen as a way to secure and diversify natural gas imports in the EU1. The purpose of this study is to investigate four important issues that may have a significant impact on future patterns of LNG supply and demand in the EU by 2020-2030. These four issues are: 1) Security, diversity and affordability of natural gas supply; 2) Energy efficiency and greenhouse gas emissions; 3) LNG quality and 4) Shipping of LNG. The contributions to the report are as follows: Chapter 1: B. Kavalov Chapter 2: H. Petrić, A. Georgakaki Chapter 3: H. Petrić, based on input from Advantica LTD (UK) as external consultants Chapter 4: B. Kavalov, editor of the external input of Ocean Shipping Consultants LTD (UK) Overall editor: B. Kavalov Internal reviewers: E. Tzimas, S.D. Peteves, M. Steen (JRC-IE) External review: Clingendael International Energy Programme (The Netherlands) Style editing: DG Translation, European Commission, Brussels Bibliographical references for literature or other sources where more information can be found on a given subject are given in square brackets []. For the sake of simplicity, these references are numbered, although the data and information sources themselves are listed in alphabetical order.
1
COM(2008) 781 final, p. 5
1
TABLE OF CONTENTS EXECUTIVE SUMMARY ..............................................................................3 1. THE SECURITY, DIVERSITY AND AFFORDABILITY OF NATURAL GAS SUPPLY ....................................................................................................5 2. ENERGY EFFICIENCY AND GREENHOUSE GAS PERFORMANCE OF LNG 13 3. THE QUALITY ISSUE ...........................................................................18 4. THE SHIPPING ISSUE .........................................................................23 5. LIST OF FIGURES................................................................................27 6. LIST OF USED ABBREVIATIONS..........................................................28 7. BIBLIOGRAPHY ..................................................................................29
2
EXECUTIVE SUMMARY The recent sharp increase in energy prices and the temporary cutbacks in pipeline gas imports from Russia over the past few years have heightened EU concerns about the security, diversity, reliability and affordability of natural gas supply. The delivery of liquefied natural gas (LNG) by sea from various suppliers, as an alternative to mainstream shipment through pipelines, is seen as a way to relieve these concerns. The purpose of this study is to evaluate some important issues which an accelerated penetration of LNG in the EU gas market may present by 2020-2030. Five main implications are set out below. 1. Security and diversity of gas supply: LNG already contributes to the security and diversity of natural gas supply of the EU, even though its share of overall gas imports is moderate (≈15%). The gains in terms of diversity of supply may be reduced and even become doubtful if LNG takes up a much larger proportion of the EU’s gas imports. LNG supply is heavily concentrated in the hands of a small number of countries. The members of the recently formed Gas Exporting Countries Forum (GECF), which is sometimes described as a "gasOPEC", hold the lion’s share of world LNG supply (≈85%). Their dominance over world LNG supply is not expected to ease in the foreseeable future. The creation of a cartel of LNG exporting countries (though, applying softer tools than OPEC quotas) should not be ruled out, albeit the emergence of a global gas cartel seems unlikely. It is worth noting that OPEC's share of global oil supply is approximately half the size of GECF's share of world LNG supply; notwithstanding that more than half of OPEC members are also members of GECF. The future development of GECF is important for the EU, because Europe currently sources all of its LNG from GECF members. The involvement of Russia in GECF will be critical for the overall success of the cartel. 2. Affordability of LNG: LNG projects are among the most expensive and technically complicated energy projects. Coupled with the likely predominance of supply over demand in the foreseeable future, if the EU chooses to go for a large contribution of LNG to meet its overall gas demand, EU customers will most likely face higher prices for gas. Price affordability may become a key issue when taking the political and investment decisions on LNG. 3. Energy efficiency and greenhouse gas performance of LNG: The LNG supply chain tends to be more energy and greenhouse gas (GHG) intensive than the supply chain for pipeline gas, because of the extra processing steps. The difference is narrower when LNG is compared to remote pipeline deliveries. Typically the GHG performance gap is smaller than the energy efficiency gap, because of the unavoidable methane leaks from pipelines. LNG may be a less GHG-intensive option than pipeline supplies under certain conditions, e.g. when the alternative is very remote pipeline deliveries of gas or when LNG is brought to the end-users in liquid form and then re-gasified on-site. If LNG is going to be fired in advanced power generation plants equipped with carbon capture and storage facilities (CCS), its overall GHG balance might become comparable to or even worse than that of coal and oil derivatives. 4. LNG quality: LNG has higher purity, a higher methane and overall energy content, and a more stable composition than pipeline gas. However, the superior quality of LNG, obtained at a higher cost in terms of energy and GHG emissions, is actually a problem in Europe today. This is because the vast majority of enduse facilities are tuned to the “leaner” pipeline gas quality that dominates the overall EU gas mix. With LNG's share of the EU's overall gas consumption widely expected to expand, some changes to the gas quality specifications in Europe
3
may be necessary. There might therefore be a case for optimising LNG use, i.e. evolving from a purely logistics concept to a product (fuel) concept. 5. LNG Shipping: Shipping is the most volatile cost parameter in the whole LNG chain. It may define the relative competitiveness of LNG supply options against each other and with respect to other gas and non-gas energy alternatives. Unlike LNG production, the ownership structure of the LNG fleet is rather dispersed, at least at the present time. Although significant growth in LNG trade by sea is expected by 2020-2030, its impact on the overall traffic by sea, including in the main "choke points" of the English Channel, Dardanelles, Bosphorus and Suez Canal, will be negligible. While new LNG carriers are unlikely to be built in Europe, the anticipated growth in voyages to Europe may offer more ship repair opportunities to European shipyards, especially in Southern Europe. The main challenges facing LNG shipping appear to be the growing crew shortages (with potential negative implications for the safety records of the vessels operating) and traffic delays and related congestion risks in specific zones where there are more stringent safety and security rules for handling LNG carriers.
4
1. THE SECURITY, DIVERSITY AND AFFORDABILITY OF NATURAL GAS SUPPLY The recent sharp increase in energy prices and the temporary cutbacks in supplies of natural gas from Russia over the past few years have heightened EU concerns about the security, diversity, reliability and affordability of natural gas supply. The EU is particularly vulnerable to such events and trends, as it holds less than 2% of world gas reserves [3], even though gas accounts for about one quarter of its gross domestic energy consumption [11]. To make matters worse, indigenous production is stagnating and set to decline, while consumption is on the rise and will keep growing, driven primarily by the electricity generation sector and households – Figure 1. Figure 1: Primary production and primary consumption of natural gas in EU-15 over 1975-20062 (Bm3)
Production
05
20
03
20
01
20
99
97
19
95
19
93
19
19
91
19
89
19
87
19
85
83
19
81
19
19
79
19
77
19
19
75
Bm3
450 400 350 300 250 200 150 100 50 0
Consumption
Source: Adapted from [9] The widening gap between indigenous production and consumption of gas in the EU is covered by imports from a small number of countries, the largest single supplier being Russia. Over the past decade the EU has managed to partially diversify its gas imports. Nonetheless, the EU still sources about 40% of its gas from Russia (down from approximately 50% some 10-15 years ago). From a practical point of view, the diversification of gas imports is constrained by the fact that the lion’s share of imports (≈85%) comes via pipelines, which ties up both the supply and the demand side for years in advance. In a situation of high energy prices and a seller’s market, the EU is obviously in a weaker position, regardless of how gas prices are indexed under the long-term supply contracts. Altogether, these facts and trends are exerting growing pressure on the EU – a pressure that extends well beyond the field of energy. EU policy-makers are thus considering various alleviating measures, including an EU common energy policy3, improved energy efficiency, alternative energy sources, etc. The supply of liquefied natural gas (LNG) by sea using specialised ships is one such alternative4. 2 Due to the fundamental political and economic transformations in the 12 new Member States of the EU in the 1990s, it is not appropriate and sometimes not even feasible to derive similar retrospective long-time data series for them. 3 COM(2007) 1 final 4 COM(2008) 781 final, p. 5
5
So far, LNG looks to be a promising tool in the efforts to secure and diversify EU’s gas imports, since the geopolitical distribution of LNG supplies differs from that of pipeline supplies – Figure 2 (Russia is not present in the LNG market… yet!). The contribution of LNG to European gas imports is still modest – about 47 Bm3, or 15% of all gas imports. The main LNG consumers in the EU today are Spain (with more than half of total LNG imports) and France (with more than one quarter of total LNG imports). Figure 2: Pipeline gas and LNG net imports in the EU by countries of origin in 2007, (%) 100%
Others Oman
80%
Libya Trinidad
60%
Egypt 40%
Qatar Nigeria
20%
Algeria Norway
0% Pipeline gas, 259 Bm3
LNG, 47 Bm3
Russia
Source: Adapted from [3] Any increase in LNG as a percentage of total gas imports and consumption will inevitably have major implications for the overall energy system of the EU, and for its natural gas economy in particular. The purpose of the following analysis is to highlight some of the likely implications of such a change. Natural gas was the energy source with the fastest growing consumption of all energy sources after the oil shock in the early 1970s. The key reason for this expansion was the electricity generation sector, where natural gas became a principal fuel owing to a set of technical and economic advantages. As a result, the trade in gas also intensified. LNG, in particular, became increasingly popular during the past three decades. Starting from scratch, LNG consumption grew rapidly – approximately 3.5 times faster than total gas consumption. Today, LNG accounts for nearly 8% of world gas production – Figure 3. There is a broad consensus that the growth in natural gas, and LNG in particular, will continue. By 2030, global demand for gas is projected to increase more rapidly than total energy demand – 2.1% per year versus 1.8% [29]. In both OECD and EU, gas will be the fastest growing conventional energy source [12, 29]. The share of gas that is traded between world regions is predicted to expand from 13% in 2005 to 22% in 2030; LNG will account for almost 85% of that increase. LNG exports will reach 393 Bm3 by 2015 and 758 Bm3 by 2030 [29]. Consequently, as early as 2015, LNG may account for as much as 14-16% of natural gas demand worldwide [28]. In Europe, the overall trade volumes are forecast to reach 99 Bm3 by 2010, 220 Bm3 by 2020 to 254 Bm3 by 2030. In relative terms, the European share of global LNG trade is predicted to increase from the current 25-27% to about 35% [34].
6
Figure 3: World absolute (Bm3) and relative (% of world total natural gas production) LNG production between 1975 and 2007 (%) 8%
240
7%
200
6% 160
5% 4%
120
3%
80
2% 40
1% 0%
LNG production (Bm3)
Bm3
19 75 19 77 19 79 19 81 19 83 19 85 19 87 19 89 19 91 19 93 19 95 19 97 19 99 20 01 20 03 20 05 20 07
0
Share LNG in total gas production (%)
Source: Adapted from [1, 2, 3, 9] In view of this widely expected massive growth in gas demand worldwide, it is crucial to secure the respective matching supply… at affordable prices! However, the supply prospects look both complicated and challenging. The geopolitical situation for gas is becoming increasingly complex, since the geographical distribution of natural gas reserves is coming more and more to resemble that of oil reserves. Most new discoveries of economically exploitable gas over the past two decades have been in the Middle East – Figure 4. Figure 4: Breakdown of world oil and gas reserves in 1987, 1997 and 20075 (%) 100%
Asia Pacific
80%
Africa
60%
Middle East
40%
Europe & Eurasia
20%
South & Cent. America
0% 1987
1997 Oil
2007
1987
1997 2007 Gas
North America
Source: Adapted from [3] Although gas is more geographically dispersed than oil, the concentration of gas reserves is higher. While Saudi Arabia, Iran and Iraq – the world's "top three" in oil reserves – account for 42% of global oil reserves, Russia, Iran and Qatar (the top three in gas reserves worldwide) control 55% of global gas reserves [3]. It 5
The Former Soviet Union, in particular Russia, holds the vast majority of oil and gas reserves in Europe / Eurasia.
7
should also be noted that Iran holds the second largest reserves of both oil and gas worldwide, with 11% and 16% respectively. In the light of current trends, Russia, Iran and Qatar might be the only large providers of gas worldwide by 2030. So far, the geopolitical implications of such a scenario do not seem to have been subjected to a thorough study. As regards LNG, world LNG production and exports are concentrated within a handful of countries, most of which are not members of OECD/EEA/EU. The vast majority of LNG exporters can be allocated to various groupings, depending on different criteria. The most important groupings that are relevant to the EU are the Middle East, OPEC (the oil cartel) and the Gas Exporting Countries Forum (GECF). The Middle East is seeing the fastest growth in LNG production and export worldwide. Its share of global LNG production tripled over the past 10 years, exceeding 25% - Figure 5. In 2006, Qatar took over the world leadership in LNG exports from Indonesia [1, 2]. A year later, Qatar became the third largest LNG supplier to the EU (Figure 2), overtaking Egypt [2, 3]. In view of the planned substantial expansion of liquefaction capacity (more than double [25]) and infrastructure, Qatar alone may account for about 20% of world LNG supply by 2010 [20] and 25% by 2015 [28]. Coupled with the Middle East's increasing share of world gas reserves (Figure 4), such a prospect may not be to the advantage of LNG importers. Figure 5: Shares of Middle East, OPEC and GECF in world LNG production 19752006 (%)
19 75 19 77 19 79 19 81 19 83 19 85 19 87 19 89 19 91 19 93 19 95 19 97 19 99 20 01 20 03 20 05 20 07
100% 90% 80% 70% 60% 50% 40% 30% 20% 10% 0%
Middle East
OPEC
GECF
Source: Adapted from [3, 9] Although OPEC's share of world LNG exports has been declining over the past 20 years, the cartel still provides about half of LNG supply – Figure 5. Besides that, OPEC influences gas markets in two other ways. First, in some regions of the world, particularly in Europe, the price of gas under long-term supply contracts is indexed to oil. As OPEC (still) has some control over oil prices, it exercises some control over gas prices, too. Secondly, technologically oil recovery is accompanied by some gas recovery (associated gas), so OPEC may also make a direct contribution to gas supply [26]. At present, however, a large portion of associated gas is flared. In 2006, the oil producing countries burned approximately 170 Bm3 of gas, equal to more than 5.5% of world gas production 8
[43] and 80% of global LNG production. The Middle East alone flares approximately 30 Bm3 of gas per year [22]. The Gas Exporting Countries Forum (GECF) is a relatively young organisation, created in 2001. The Forum claims to be a gathering of the world’s leading gas producers and aims to represent and promote their mutual interests. The latter include identification and promotion of measures and processes to ensure that member countries derive maximum value from their gas reserves. GECF also seeks to promote dialogue between gas producers and consumers. Its members exchange views and information on various subjects: project development, supply and demand balances, exploration, production and transportation costs, etc [23]. While the weight of the Forum in global pipeline gas trade is not that pronounced (≈38% [3]), its share of LNG production and exports is impressive, at around 85% in 2007 (Figure 5)! In contrast, OPEC's share of world oil supply is almost half of that, at ≈43% [3]. In this context, eight members of OPEC (out of a total of 136) are also GECF members (out of a total of 14)7 – Figure 6. Figure 6: LNG exporting countries, their shares in world LNG trade, share of export to the EU in their total export and membership of various groupings in 2007 LNG exporters 2007
World share, %
Qatar Malaysia Indonesia Algeria Nigeria Australia Trinidad & Tobago Egypt Oman Brunei United Arab Emirates Equatorial Guinea United States Libya Norway Source: Adapted from [3,
17.0 13.2 12.3 10.9 9.3 8.9 8.0 6.0 5.4 4.1 3.3 0.6 0.5 0.3 0.1 23, 35]
Share of export to the EU, % 19.4 0.0 0.0 65.2 68.1 0.0 14.4 42.0 1.0 0.0 0.0 0.0 0.0 100.0 100.0
Middle East
OPEC
GECF
X
X
X X X X X
X X X
X X X X
X
X X
X
X
The overlap in GECF/OPEC membership may accelerate and strengthen the cooperation within GECF, although one of the crucial players, if not the crucial player in GECF – namely Russia - has always deliberate abstained from becoming a member of OPEC. Despite the scheduled entry of new LNG suppliers, GECF – with 75-80% – is most likely to retain a dominant position in the world LNG market at least until 2015 [26], as it is sitting comfortably on ≈70% of global gas reserves [3]. While the likelihood of GECF being able to exercise control over all gas movements worldwide seems unrealistic (due to the specifics of gas handling and logistics), it should not be that difficult for the Forum to take quite a strong 6
Indonesia is still considered as an OPEC member, although the country announced in 2008 that it would leave the cartel. 7 Iran and Venezuela currently are not LNG exporters, but are members of both OPEC and GECF. Other members of GECF are Bolivia and – very importantly – Russia.
9
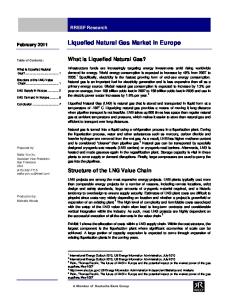
and firm grip on LNG [26]. In the event of such a scenario, GECF may choose not to go for "hard" measures such as OPEC quotas [10, 15, 17, 42]. Instead the Forum may seek to adjust supply to demand at some preferred price levels (whatever that may mean) and avoid over-supply by using "softer" tools such as optimisation of deliveries (e.g. “attaching” certain suppliers to certain receivers), setting floor (minimum) prices, (re-)introducing destination clauses, increasing flexibility in supply contracts, etc. [18, 21, 26, 40, 42]. Russia's declared willingness to consider such a cartel-like gas organisation feeds speculation about the future of GECF, especially as regards LNG [14, 16, 26, 36, 42]. In that connection, Russia has recently hinted at ambitious plans to enter the LNG market by 2009-2012 [19, 25, 26]. As regards Europe, it is worth noting that, at present, the EU receives virtually all its LNG from GECF members8. The future market for LNG will depend heavily on competition with and availability of pipeline gas [25]. At present, Russia holds a major stake in the attractive EU gas market. It is sometimes suggested that Russia is now even more dependent on the EU, as the EU is basically its only current large gas market. Thus, it is naive to believe that Russia will easily relinquish its power of supply in the EU gas market. A desire to protecting its EU positions may be another motive for Russia to aggressively enter the LNG market. At that point, a key challenge for Europe would be how to prevent LNG from becoming just another “pipe”, also depending on whether GECF can become stronger and turn into a LNG cartel. To sum up, while the modest use of LNG does contribute to the security and diversity of EU gas supply at present, these benefits may not be so pronounced if LNG becomes more widely used in 10-20 years' time. Besides the security and diversity of supply, another important issue for policymakers is the affordability of LNG. In general, LNG projects are among the most expensive energy projects [40]. This means that they will continue to be an option for a small number of energy giants, national and/or multinational [25]. Also, the proven reserves of gas to justify the investment in a liquefaction plant need to be large enough to guarantee about 30 years of production [25]. Consequently, only a small number of gas fields actually qualify for the development of liquefaction complexes. Otherwise, the additional pipeline infrastructure needed to concentrate gas supplies to the liquefaction point will incur significant incremental costs. The current cost breakdown of the average LNG chain is presented in Figure 7. It shows that liquefaction accounts for the bulk of the costs. Although liquefaction costs decreased by 35-50% between 1990 and 2005 [25, 40], they are still quite high. Furthermore, liquefaction costs have been rising since 2005, due to overall cost inflation in the energy sector – soaring metal prices, shortage of skilled labour, etc [6, 25, 44]. Coming up with accurate data on liquefaction plant costs is quite a challenge since data vary widely depending on the location and whether a project is greenfield (built in a new location) or brownfield (an expansion of an existing plant). Nevertheless, currently a conservative estimate would put the likely cost of a greenfield plant at around USD 500 million per Bm3 of annual capacity at the low end. In contrast, the cost of advanced developments in the Arctic area and Russian’s Far East reaches USD 1.5 billion per Bm3. Due to economies of scale, it is usually cheaper to extend an existing production train, as this costs between USD 200 and USD 400 million per Bm3. The lowest costs are found in the Middle East, where natural gas is concentrated in nearby large accumulations, with little need for supporting pipeline infrastructure [25, 40]. 8
Norway entered the LNG market and made its first exports to the EU in 2007, but the volumes were symbolic. It is also important to note that Norway has observer status in GECF.
10
While liquefaction is extremely costly, regasification capacity, on the other hand, is relatively cheap and easy to establish. Offshore transfer and on-board regasification have also helped to keep the cost down. It is therefore predicted that regasification capacity will experience widespread and rapid growth throughout the world. This development is projected to more than double the development of liquefaction capacity, at least in the medium term [25]. Hence, LNG will continue to be a seller’s market and competition amongst LNG buyers will most likely become increasingly strong, with a corresponding upward impact on prices. Taken altogether, these facts may call into question the affordability of LNG and hence, the security of LNG supply. Figure 7: Lower and upper share of various cost items in total LNG chain (%) 45%
Upper end
40%
Lower end
35% 30% 25% 20% 15% 10% 5% 0% Gas production
Gas liquefaction
Shipping
Regasification
Source: Adapted from [40] Shipping is the parameter for which the overall cost structure of LNG chains varies the most (Figure 7). Thus, it is shipping (together with liquefaction) that is likely to define the relative competitiveness of suppliers versus receivers worldwide. As regards the relationship between the transportation distance and the competitiveness of LNG compared to pipeline gas, the break-even point is quoted at somewhere between 3000 km [13] and 4000 km [29, 44]. The breakeven point depends very much on the individual case. For instance, it can be as low as ≈2000 km if offshore pipelines are the alternative [40]9. The distance may also be heavily dependent on logistics and political factors – LNG appears to be more flexible than pipeline gas [29]. All in all, although it is hard to put a price on a standard new LNG supply chain, a greenfield project may require approximately USD 3-5 billion for liquefaction, USD 2 billion for shipping and a further USD 0.8-1 billion per terminal for regasification [28]. On the demand side, these figures mean that LNG will continue to be an expensive energy option and its affordability may become a key political issue. LNG, therefore, may become an energy choice confined to rich (developed) countries. Rapidly developing economies, such as India and China, are most likely to remain marginal players in the LNG business for the foreseeable future [25], since such countries need cheap energy, not just energy.
9
All the calculations are based on an average cost of USD 1-2 billion per 1000 km of large diameter pipeline, depending on the terrain and the techno-economic and geopolitical conditions [28].
11
Along with the absolute growth in LNG, structural changes in LNG trading are also on the way. The share of the flexible spot trade, currently about 10% [34], is set to grow and may reach 20% [13, 40] to 25% [28] in the next 10 years, especially in view of the tight supply situation. The new long-term contracts tend to be issued for shorter periods (8-15 years in Europe instead of the previous 2025 year duration), smaller volumes and be more flexible in their terms [27]. The increase in flexibility and the share of spot cargoes, in particular, are factors which are likely to improve the chances of an eventual cartel-like organisation of LNG suppliers [42].
12
2. ENERGY EFFICIENCY AND GREENHOUSE GAS PERFORMANCE OF LNG The typical natural gas chains (from extraction to end-use) for pipeline gas and LNG deliveries are presented in Figure 8. The main differences between the LNG and pipeline pathways are in processing, transportation, storage and handling (the right side of Figure 8, highlighted in purple). As a result of these differences, the performances of LNG and pipeline pathways in terms of energy efficiency and greenhouse gas emissions (GHG) are not equal. The purpose of this Chapter is to analyse and summarise these differences, and suggest options for optimising the two chains. The analysis concentrates on the delivery part of the chains10, since end-use energy and GHG performance11 are virtually the same. The analysis is based on Eco-invent data [7]. Figure 8: LNG and natural gas pathways from extraction to end-use Natural gas exploration
Natural gas is processed, liquefied by cooling and loaded aboard a ship
[E]
Natural gas is processed
Natural gas extraction
LNG is transported by sea (LNG carriers) Remote end-users with no access to pipeline infrastructure
LNG is stored and used during peak demand
Natural gas is stored
LNG is distributed by trucks LNG is stored in tanks
LNG vehicles
Long-distance pipeline transportation
LNG is discharged at receiving terminal
CNG vehicles
Natural gas is distributed to residential consumers, industry, DH...
Large industry
Natural gas utilization process
Power generation LNG is regasified by reheating
LNG (liquefied natural gas) utilization process CNG (compressed natural gas) utilization process End-user consumption
[U]
Exploration, including drilling, well preparation and closure (often along with oil recovery)
Natural gas is regionally transported by pipelines
The estimated amount of energy needed to deliver natural gas from the point of extraction (Figure 8, step [E]) to a pipeline point that connects end-users (Figure 8, step [U]) along alternative pipeline (Figure 8, left-hand side) and LNG (Figure 8, right-hand side) delivery chains is presented in Figure 9. The point of delivery is assumed to be approximately in the middle of continental Europe. The assumed natural gas sources are in North Europe, North-West Europe, North Africa, West Africa, the Middle East and Russia. The assumed LNG import terminals are located on the Mediterranean (South Port) and Atlantic (North Port) coast of Europe. The comparison of LNG and pipeline chains from Figure 9 clearly shows that the LNG route, which also includes some pipeline transportation, is on average more energy intensive than a conventional pipeline 10 11
The Well-To-Tank (WTT) step if using the Well-To-Wheel (WTW) terminology. The Tank-To-Wheel (TTW) step in WTW terminology.
13
chain. The typical energy penalty of delivering gas via pipelines is 10-15% (translating into an efficiency of 85-90%), while for LNG it is ≈25% (efficiency of ≈75%). However, when gas is delivered via pipelines from quite remote sources (e.g. over a distance of 7000 km), the energy cost comes close to that of LNG (24% versus 28% respectively).
40% Production
Liquefaction
Shipping
Evaporation
Pipeline gas
Transport & Storage
LNG
30%
20%
M.East to S.Port
M.East to N.Port
N.Europe to S.Port
N.Europe to N.Port
W.Africa to S.Port
W.Africa to N.Port
N.Africa to S.Port
N.Africa to N.Port
Russia (7000km)
N.Europe
NW.Europeonshore
0%
Russia (3500km)
10%
NW.Europeoffshore
Primary Energy Consumption (Fossil Energy)
Figure 9: Primary energy consumption to deliver extracted gas by LNG and pipeline pathways [%, primary fossil energy12 consumed along the chains / total energy employed (energy of the extracted natural gas and energy consumed from other sources), all on Net Calorific Value /NCV/ basis]
Source: JRC-IE in-house calculations The processing efficiency of liquefaction plants currently under construction is rather better than that assumed in Figure 9 [31, 38]. The same is also valid for the energy consumption of state-of-the-art LNG carriers. All in all, the overall energy efficiency along the LNG route could, under certain conditions, be as high as 83%13, i.e. close to that of pipeline pathways. Nonetheless, closing the gap between LNG and pipelines does not appear realistic in practice. This is because – all things being equal (i.e. assuming that the gas has already been extracted from the ground), the break-even point between the logistics energy use (liquefaction, shipping, evaporation, transport and storage – Figure 9) of LNG and pipeline gas is only reached if the transportation distances are very long – Figure 10. This means that, practically speaking, LNG will always be a more energy-intensive option than pipeline deliveries of natural gas. The energy efficiency of LNG seems to improve slightly if LNG is distributed to the end-users still as a liquid, rather than being regasified (Figure 8, the alternative pink path on the right-hand side). The energy expended on obtaining the same amount of compressed natural gas is 18% lower if LNG is trucked straight to the refuelling station and then vaporised and compressed on site, than if LNG is first regasified and then transported by pipeline to the same refuelling point [31]. In this way, some energy can be recovered, for example via on-site power generation, district cooling, etc. The GHG performance of alternative pipeline and LNG pathways is presented in Figure 11. It reveals that on average the GHG balance of LNG pathways is 12 Primary energy demand from non-fossil sources is negligible, so consumed primary fossil energy is essentially equal to the total primary energy demand. 13 Based on an average distance of sea transportation of 7700 km.
14
inferior to that of comparable pipeline routes. The gap becomes particularly wide (approximately 7 times wider) when LNG is compared against indigenous (European) natural gas production and pipeline delivery. Like energy efficiency, GHG emissions become similar when LNG is put side by side with remote pipeline deliveries.
Energy Consumed, MJ ex. per
MJdeliv. gas (Fossil Energy, NCV)
Figure 10: Extrapolated energy consumption to bring a unit of extracted natural gas via LNG and pipeline pathways 0.6
Energy consumption along LNG pathway Energy consumption along pipeline pathway
0.5 0.4 0.3 0.2 0.1 0.0 0
2000
4000
6000
8000
10000
12000
14000
16000
Overall transport distance, km
Source: JRC-IE in-house calculations
Production
Liquefaction
Shipping
Evaporation
Transport & Storage
Pipeline gas
LNG
N.Africa to N.Port
40
Russia (3500km)
30
20
M.East to S.Port
M.East to N.Port
N.Europe to S.Port
N.Europe to N.Port
W.Africa to S.Port
W.Africa to N.Port
N.Europe
NW.Europeonshore
NW.Europeoffshore
0
N.Africa to S.Port
10
Russia (7000km)
GHG, kg CO2eq. per GJdeliv. gas (NCV)
Figure 11: GHG balance of LNG and pipeline natural gas supply pathways (grams of CO2 equivalent emitted to deliver 1 MJ of gas)14
Source: JRC-IE in-house calculations LNG processing is less GHG efficient than gas processing without liquefaction. However, in the logistics phase (after gas extraction) LNG performs quite well compared to pipeline transmission. This is because the GHG footprint of pipeline transmission is largely determined by the fugitive methane emissions that are in direct proportion to the transportation distance [37]. The estimated break-even point in the GHG performance of LNG and pipeline pathways is reached at much shorter and more realistic distances of transportation compared to the break14
1) The extremely high GHG emissions for LNG delivered from West Africa come from the reported high level of flaring in the region; 2) Similar values for GHG emissions for natural gas supply are quoted also by other recent studies – 19 kgCO2/GJ for EU [31] and 25 kgCO2/GJ as a global average [38].
15
even point in energy efficiency – Figure 12 and Figure 10. The likely improvements in upstream GHG performance of LNG (i.e. from extraction to the end-use delivery point) may result in the break-even point being achieved at even shorter distances. Summing up, the GHG disadvantage of LNG pathways compared to pipeline routes may be turned into a GHG advantage in the future. This trend may become a key driving force for penetration of LNG in the EU energy market. On the other hand, improvements in leakage rates and, thus, in GHG performance of pipelines are also possible, especially in the case of Russian pipelines.
GHG, kg CO 2eg. per GJ deliv. gas (NCV)
Figure 12: GHG emissions to transport a unit of energy by LNG and pipeline pathways 40
GHG emissions along LNG pathway GHG emissions along pipeline pathway
30
20
10
0 0
2000
4000
6000
8000
10000
12000
14000
16000
Overall transport distance, km
Source: JRC-IE in-house calculations Concerning the GHG performance of LNG versus other fossil fuels, Figure 13 presents the overall GHG balances for pipeline gas and LNG, and competing fossil fuel options – hard coal, and light and heavy fuel oil at comparable delivery points (equivalent to the previously defined delivery point for LNG and pipeline gas). Figure 13: Overall GHG balance of LNG versus other fossil pathways Combustion
Coal
Upstream
100 Pipeline gas
Oil
LNG
80 60 40
Light fuel oil
Heavy fuel oil
Hard coal
M.East to S.Port
M.East to N.Port
N.Europe to S.Port
N.Europe to N.Port
W.Africa to S.Port
W.Africa to N.Port
N.Africa to S.Port
N.Africa to N.Port
N.Europe
NW.Europe-onshore
NW.Europe-offshore
0
Russia (7000km)
20
Russia (3500km)
GHG, kg CO2eq. per GJ (NCV)
120
Source: [30] for combustion emissions, JRC-IE in-house calculations for upstream emissions According to Figure 13, natural gas has relatively low combustion emissions, but rather high upstream emissions for all pathways apart from indigenous production. Consequently, the upstream emissions of natural gas, in particular for 16
remote pipeline gas deliveries and LNG, have a more pronounced impact on total GHG emissions than do the upstream emissions of coal and oil. This fact may be particularly important for the power and heat generation sectors in the future, as together they account for about 30% of the EU’s final gas consumption at present. With current technologies, the overall GHG emissions for natural gas are considerably lower than those for coal (or oil), owing to higher conversion efficiencies and lower carbon content (especially compared to coal). The picture may change, however, when/if new technologies, in particular Carbon Capture and Storage, gain a large penetration. In such a case, the overall GHG emissions for electricity generation from natural gas and coal may become similar. Then, other factors such as security and diversity of supply, fuel cost, etc. will govern the fuel choice. As revealed already in this Chapter, the advantages that LNG may offer are improved efficiency along the whole supply chain and partial energy recovery at the end-use. Combined with the findings from Chapter 1, the analysis in the current Chapter indicates that the role of LNG in the future energy system of the EU should be assessed on the basis of a broad set of policy priorities and objectives.
17
3. THE QUALITY ISSUE The principal constituent of natural gas is methane (CH4). Other natural gas components are heavier hydrocarbons, hydrogen sulphide and inerts. To obtain LNG, the majority of natural gas impurities must be removed, which means that LNG generally has a high concentration of methane (90%). The remaining LNG components are ethane, propane and butanes15, all of which contribute to the overall energy content. As a result of processing, LNG tends to contain slightly more of these higher hydrocarbons than pipeline gas. On the other hand, LNG has only negligible amounts of nitrogen and no carbon dioxide. All in all, pipeline gas contains at least ten times the quantity of inerts, which make no contribution to the overall energy content. Summing up, LNG may be considered as a superior quality fuel to pipeline gas. Currently, this fact is widely underestimated - at least in Europe – and LNG is viewed mainly as a logistics concept rather than as a product (fuel) concept. In support of the above findings, Figure 14 presents the differences in the chemical composition [in terms of non-methane hydrocarbons (natural gas liquids), inerts and methane] of pipeline natural gas and LNG supplied to the EU from different sources. The "grouping" of different LNG supplies in the bottomright part of the graph is very pronounced. Conversely, pipeline natural gases are concentrated on the left-hand side, indicating lower purity in comparison to pure methane (top-right corner). Altogether, these facts underpin the distinction between LNG and the "leaner" pipeline gas. It is worth noting that Russian gas forms a separate, middle group, i.e. it can be considered to be of relatively higher quality than other pipeline deliveries and some LNG supplies. Figure 14: Composition of European pipeline gas and LNG (the relative size of 0 the bubbles indicates the methane content) Other LNG Supplies
Non-methane Hydrocarbons (C2+), mol%
Methane (CH4), mol% 100%
European Pipeline Gas
LNG Supplied to EU
60%
0
Pure Methane
Russia Poland Norway
Trinidad&Tobago, Egypt
N.Sea
1
Netherlands
10
Hungary Norway, N.Sea, Algeria
Nigeria, Egypt, UAE, Indonesia, Brunei, Australia
Algeria, Libya, Quatar, Oman, Iran
100 100.0
10.0
Source: Adapted from [4]
15
1.0
Inerts (N2+CO2), mol%
Hexane and other heavy hydrocarbons are virtually absent.
18
0.1
0.0
0.0
The key physical properties of natural gas, namely gross calorific value (GCV)16, Wobbe Index and relative density (to air) are compared in Figure 15. LNGs, with a higher Wobbe Index, form groups that are clearly separate from the typical pipeline supplies in Europe. Thus, LNG comes with an obviously higher energy content (Calorific Value) and heat delivery to a burner through a nozzle (Wobbe Index) than the gas that is typically used in Europe today. Figure 15: Physical properties of European pipeline gas and LNG (the relative size of bubbles indicates the density of gas relative to air) 55
Relative Density 0.555 0.70
Algeria, Egypt, Trinidad, Iran
52
Nigeria, Libya
Russia
3
Wobbe Index, MJ/m
Algeria, Nigeria, Qatar, Oman, UAE, Indonesia, Malaysia, Brunei, Australia
49
H-Gases (Be,Fr,Nl,De,Hu,Pl,Es,Dk,It) N.Sea, Norway, Algeria
46
43
Other LNG Supplies European Pipeline Gas LNG Supplied to EU
40
Pure methane
L-Gases (Be,Fr,Nl,De,Hu,Pl) Norway, Netherlands, Poland, Hungary
37 33
36
39
42
45
3
Gross Calorific Value, MJ/m
Source: Adapted from [4] The introduction of new supplies/suppliers and entry points will change the traditional flow and mixing patterns within the existing gas networks in the EU. Many parts of Europe may see a wider range of gas quality (and composition) in a short period of time. It is also possible for some LNG deliveries to be near or at the upper specification limits. Therefore the issue facing many countries both within Europe and around the world is how to manage and control the variations in gas quality in order to ensure security of gas supply at reasonable cost, and maintain the operational integrity of gas utilisation equipment. In terms of gas quality, Russian gas accounts for the biggest single share of overall EU gas consumption. As indicated in Figure 15, Russian gas forms a separate group, with a Wobbe Index that is somewhat closer to LNG than other European pipeline gases – this position is similar to that in Figure 14. Given that Russian gas is likely to maintain a dominant position in EU gas imports for the foreseeable future, and given the widely expected growth in LNG supplies, the baseline quality specifications of the future gas imports to the EU could be dictated jointly by the respective quality of Russian gas and LNG. In such a case, the higher calorific value and purity of LNG could represent a market opportunity and advantage.
16
The Gross Calorific Value (GCV) supposes that the water of combustion is entirely condensed and that the heat contained in the water vapour is recovered. The Net Calorific Value (NCV) supposes that the products of combustion contain the water vapour. The heat contained in the water vapour is not recovered. The difference between GCV and NCV for natural gas is 9.8%.
19
The Wobbe Index and the Methane Number as indicators of engine performance are compared in Figure 16. The majority of LNG varieties clearly form a fairly compact group, whereas pipeline gases are quite dispersed apart from gas from Russia and the Netherlands. This means that LNG can maintain a relatively constant quality, but – in any event – a more constant quality than average pipeline gas. Stable and well-defined fuel quality is a paramount condition for the proper running (i.e. with low fuel consumption and emissions) of modern internal combustion engines. Consequently, LNG might be a promising alternative fuel for transport. LNG offers another advantage over pipeline gas if used as an automotive fuel – LNG can be delivered by road trucks directly to a large network of refuelling stations. Figure 16: Physical properties of pipeline gas and LNG relevant to engine performance (the size of the bubbles expresses the variations in Gross Calorific Value /GCV/; right-hand axis indicates Motor Octane Number equivalent to Methane Number) 100
Other LNG Supplies
Trinidad&Tobago, Egypt
LNG Supplied to EU
Methane Number
Russia
Pure methane
90
130
Netherlands
80
LNGs 120
Motor Octane Number (MON)
European Pipeline Gas
70
60
110
43
47
3
Wobbe Index, MJ/m
51
55
Source: Adapted from [4] A number of studies have been carried out on the impact of gases with different quality specifications on various domestic and industrial end-use applications [24, 32, 33, 39, 41]. These studies concluded that appliances were usually optimised in terms of efficiency and emissions to the gas quality that was typically supplied. Wider or variable gas qualities have generally had an adverse impact on gas-fired facilities. Combustion of regasified LNG in all types of equipment is possible and can be as efficient and low polluting as standard pipeline gas, if the combustor is “tuned” to the LNG quality. Maintaining optimum combustion across a wide range of gas qualities is a challenge. The potential drawbacks of regasified LNG when used in facilities that are adjusted to pipeline gas are summarised in Figure 17. Nonetheless, the manufacturers of industrial and domestic appliances have responded to the entry of LNG and are continuously working on extending the safe and efficient operating range of appliances. The established LNG markets in Europe (France, Spain, Italy, Belgium) are capable of receiving various LNG qualities owing to the 20
broad Wobbe Index acceptability. Supplies with extreme or excessive quality parameters can be either blended or (as in Italy) further processed to fit the required specification. In countries where pipeline supplies are prevalent (USA, UK) and where the gas quality is defined by the quality of the historically supplied pipeline gas, LNG will invariably need treating (which appears to involve reducing the purity of the gas) before the regasified LNG is fed into the facilities that were already tuned to use leaner natural gas. Figure 17: Drawbacks of using regasified LNG in facilities tuned to pipeline gas Application
Concern
Possible Impact
Domestic appliances (boilers, water heaters, cookers, fires, etc) Industrial burners
• Millions of unadjusted units
• Higher NOx emissions • Higher CO emissions • Greater soot production potential (especially in decorative fires)
• Wide range of uses • Efficiency • Emissions
Turbines/ Microturbines
• Efficiency, • Emissions, • Turbine life
Internal combustion reciprocating engines
• • • •
• Possible reduction of product quality (e.g. greater reject rates for certain temperature sensitive processes), • Possible increased number of unplanned outages (reliability) • Decreased overall efficiency • Increased emissions of NOx, CO and soot • Decreased efficiency • Higher NOx emission • Higher CO emission • Poorer operability • Increased maintenance due to poorer reliability and possible reduction of turbine life • Knock potential increase • Efficiency reduction • Emissions of NOx and exhaust hydrocarbons may increase
Fuel cells (FC) Non-energy uses (chemical feedstock)
Knock Efficiency Emissions Combustion stability • Solid Oxide FC operation • Added process cost • Plant modification
• Increase in carbon deposition • Unscheduled shutdowns (impact on the reforming catalyst) • Implications for plant operating conditions, shift reaction, catalyst life and product purification duty
Source: Adapted from [4] So far, the LNG quality specification has not been seen as a strategic reference for the development of the LNG market, since the designs of both liquefaction and re-gasification plants were based on long-term contracts. Flexibility in plant design and operation has therefore been modest. However, the situation is gradually changing as LNG trade increases worldwide, with the result that gas interchangeability is becoming a crucial issue for both LNG suppliers and receivers. It is not likely that the different markets will reach agreement on a global gas quality standard [5]. At EU level, however, this issue should be resolved by 2010, 21
as the European Commission has recently given a mandate to CEN to produce a harmonised standard on gas quality, following the EASEE-gas specifications [8]. If such standardisation is implemented, it will remove the barriers imposed on free trade by the current quality standards for gas. This should also help to increase EU market "flexibility" for importing LNG. However, the anticipated interchangeability in the EU is unlikely to have any bearing on the "flexibility" in the Atlantic Basin market, where the USA is expected to take the lead in the near-tomedium future. Overcoming the technical difficulties of extending the operating range by means of a 10% swing in Wobbe Index, as proposed by EASEE-gas, is unlikely to be feasible. Such a move would affect the countries that receive gas of variable quality, such as the UK, where treatment of imported LNG will have to continue. Although additional processing does add to the cost of delivered LNG, the number of LNG import terminals currently under construction or expansion in the UK confirms that this type of processing is commercially attractive, because it enables virtually any LNG quality to be accepted. Other countries (France and Poland) are planning to convert their low calorific value networks to high calorific value networks, in order to remove the barriers to using LNG [4]. Finally, the permissible variation in LNG quality could determine the amount of "flexible" imports (from anywhere) to the EU. With the increasing use of LNG, the countries that cannot vaporise it directly into their networks will have to process the LNG in order to meet the required quality. The forthcoming gas specifications are most likely to accommodate LNG quality, unless they are restricted by the quality of local gas supplies. Large industrial consumers may then incorporate the option of direct LNG use so as to secure alternative supply. Such a strategy has been already successfully implemented by POSCO, the world's fifth largest steel manufacturer. Besides the operation of LNG import terminals, POSCO generates electricity in its own LNG–fuelled facility. At present, the chemical and petrochemical industries are unable to benefit, or at least do not actually benefit, from direct LNG application. Nevertheless, Natural Gas Liquids (NGL) could be extracted from LNG and supplied to the petrochemical industry, as in Dahej (India). However, the smaller direct LNG consumers - unlike large users - would most likely be obliged to secure back-up pipeline deliveries. Delivering LNG by road tanks could be an option for areas with poor or fluctuating gas quality, or where pipeline gas is simply not available. However, this market does not appear to be large in Europe, although it might prove to be a promising niche market. Whatever the case, any dedicated LNG application will most likely be confined to the coastal areas near to the LNG receiving terminals.
22
4. THE SHIPPING ISSUE17 As illustrated in Figure 7, shipping is the most volatile cost parameter in the LNG chain. Thus, shipping may define the relative competitiveness of one LNG supply option over another. Shipping is also very important when considering alternative fuel options. The purpose of this chapter is to present a brief overview of the most important aspects of LNG shipping, as well as to point out some potential bottlenecks that may appear in the future. The growth in the world LNG fleet, both in terms of cargo capacity and number of vessels (Figure 18), has been closely shadowing the upward trend in global LNG production (Figure 3). Figure 18: World LNG fleet development 1965-2007, (thousand m3 and number of vessels)
Source: Adapted from Ocean Shipping Consultants Ltd., Copyright protected The close correlation between LNG trading volumes and the capacity and number of vessels is expected to continue. The LNG cargo carrying capacity is forecast to expand from the current 31 million m3 to almost 110 million m3 by 2030, while the fleet is projected to reach 730 units (based on an average vessel size of 150,000 m3), thus almost three times the current level of ≈250 vessels – Figure 19. The number of vessels may be lower if the average size of LNG carriers increases. In any case, over the years there has been a clear trend of gradual expansion in the size of vessels and, hence, slower growth in the number of vessels relative to the tonnage. Owing to the recent boom in LNG trade and shipping, nearly 60% of the fleet is less than 10 years old, while only one quarter of all LNG vessels are over 20 years old. The projected growth in the fleet will come from newly built vessels, in view of the excellent life expectancy of LNG carriers with an average of 35-40 years commercial service [6]. For the same reason, scrapping activity will also be low. The currently most widely used carriers of 100,000-150,000 m3 (Figure 20) will probably continue to enjoy popularity. It is likely that there will be a significant demand for slightly larger vessels of 160,000-170,000 m3 that have access to the majority of LNG terminals and, thus, have better overall trading potential. Bigger vessels, such as the new generation of Q18-Flex (about 200,000-250,000 m3), which entered service in 2007, and the larger Q-max (250,000+ m3) that are expected to enter service in 2008, are projected to be used more widely. 17
This chapter is largely based on the consultant’s report of Ocean Shipping Consultants Ltd (UK), produced for the JRC Institute for Energy, February 2008. Explicit references in the text are given only where complementary or other information sources are used. 18 From “Qatar”, since those carriers are envisaged to serve mainly exports from the Middle East, in particular from Qatar.
23
Nonetheless, although such large vessels allow economies of scale, they offer less flexibility because of navigation and port limitations. Thus, the “Q-“ size is most likely to have only a limited application, on selected routes at least in the medium term [25]. Another future trend could see the Med-max size vessel, of about 70,000 m3, becoming increasingly popular. Several European countries in the Mediterranean region are planning new LNG receiving facilities, which could require the use of smaller LNG vessels. Finally, there is increasing demand for LNG vessels with multiple uses, such as Floating Storage and Regasification Units (FSRU). This trend is driven by the growing safety and security concerns onshore, including the NIMBY (Not In My BackYard) issue, and related administrative measures at the receiving points [6, 25]. Figure 19: Current (2007) and projected (2010, 2020, 2030) capacity of world LNG fleet (million m3) and number of LNG carriers (based on an average vessel’s capacity of 150,000 m3) 1100 1000 900 800 700 600 500 400 300 200 100 0 2007
2010
Years
Total capacity
2020
2030
Number of vessels
Vessels
Million m3
110 100 90 80 70 60 50 40 30 20 10 0
Source: Adapted from Ocean Shipping Consultants Ltd., Copyright protected Figure 20: World LNG fleet by size in 2007, number of vessels
Source: Ocean Shipping Consultants Ltd., Copyright protected The cost of building LNG carriers has fallen significantly in the period 1995-2005. However, as with the rise in LNG liquefaction costs, the newbuilding costs and prices of LNG carriers have risen since 2005, and by the end of 2007 had reached 24
the year 2000 levels, both in absolute terms (Figure 21) and in relative terms (per 1 m3 of capacity – Figure 22). LNG carriers with re-gasification features tend to cost a few tens of millions of USD more than conventional LNG vessels [6]. Because of the high unit cost of LNG carriers and the specifics of trade, LNG ownership is rather dispersed and no company owns more than 10% of the world LNG fleet [6]. As for freight rates, these have also maintained an upward trend since 2002. Figure 21: LNG newbuilding prices by average vessel size (Million USD)
Source: Ocean Shipping Consultants Ltd., Copyright protected Figure 22: LNG newbuilding prices per 1 m3 (USD)
Source: Ocean Shipping Consultants Ltd., Copyright protected The key developments and challenges associated with the shipping aspect of the LNG supply chains appear to be the following: •
Shortage of crew: There is a growing crew shortage within shipping overall. In the LNG sector, an additional 4000 seafarers are required just to man the 25
current fleet of vessels under construction. Crew shortages may result in a lowering of recruitment criteria and, hence, increased risks to safety and security [28]. In this context, European countries could do more to encourage investment in human capital. A life at sea is currently not viewed as a positive proposition by most Europeans. This needs to be addressed. Good training and support would encourage more Europeans to try a career at sea. This situation is very much in contrast to the USA, where there is an active recruitment drive backed by government policy. •
Shipping patterns (Congestion): The total world fleet is close to 1,013 million tonnes dwt /deadweight/, including all the main vessel types. Of this, the LNG fleet currently accounts for 16.5 million dwt, or approximately 1.6% of the fleet total. Even with the forecast growth rate of the LNG fleet sector, its significance with regard to the total fleet will always be limited. The increased LNG traffic to Europe is forecast to be of marginal significance in the main choke points of the English Channel, Dardanelles, Bosphorus and Suez Canal. However, the safety and security zones that are enforced around LNG vessels calling into the USA (Everett and Lake Charles) can disrupt the flow of traffic in specific areas on a significant scale. These zones restrict the flow of traffic during the passing of LNG carriers. If similar safety zones are adopted in Europe, LNG vessels could also disrupt the flow of traffic near LNG terminals. It also remains to be seen what the effect of the Q-flex and Q-max vessels will be on the flow of vessels through the waterway. Currently, it is unclear whether these large LNG carriers will need special safety zones around them (such as in the USA) to journey through the waterway.
•
Shipbuilding and repair activity: The expansion of the LNG carrier sector is likely to have only a marginal impact on world shipbuilding and ship repair activity. Shipbuilding will take place mainly in low-cost shipbuilding countries, possibly in the Far East and Turkey. The anticipated increase in European voyages is likely to lead to increased levels of repair activity. This may open up opportunities for European yards, especially in Southern Europe, where significant experience has been gained in the past.
•
LNG freight market: Historically, the LNG market has involved vessels on long-term (20-25 years) contracts, operating on fixed routes or series of routes and earning regular monthly incomes. However, along with the changes in trading, more flexible terms and shorter durations are replacing the older fixed commitments. Contracts for 10-15 years are now commonplace. The increasing number of vessels that have entered and will continue to enter the market in the near term will add to the downward pressure on current contract rates. Many utility companies and terminal operators are also capitalising more and more on the flexibility of the spot market (which is actually short-term). The tonnage built on speculation, i.e. without guaranteed long-term employment, will increase [6, 40]. All in all, the LNG spot market is forecast to grow owing to the availability of spare LNG production capacity, spare vessel capacity and the continuation of seasonal LNG demand. The increased spot trade is likely to move the LNG sector towards a more flexible market structure, similar to that of oil markets. In such a case, the optimisation of shipping costs would be crucial not only for the market competitiveness of different LNG suppliers, but also for competitiveness vis-à-vis other (competing) energy options. While transportation by sea accounts for 10-30% of final LNG costs, for oil the shipping share is only 10% [40]. The difference is due to the far more sophisticated - and therefore expensive - LNG carriers, the lower energy density of gas even when liquefied and the more complex logistics and handling [28, 40].
26
5. LIST OF FIGURES Figure 1: Primary production and primary consumption of natural gas in EU-15 over 1975-2006 (Bm3)..........................................................................5 Figure 2: Pipeline gas and LNG net imports in the EU by countries of origin in 2007, (%) ...........................................................................................6 Figure 3: World absolute (Bm3) and relative (% of world total natural gas production) LNG production between 1975 and 2007 (%)...........................7 Figure 4: Breakdown of world oil and gas reserves in 1987, 1997 and 2007 (%) 7 Figure 5: Shares of Middle East, OPEC and GECF in world LNG production 19752006 (%) ............................................................................................8 Figure 6: LNG exporting countries, their shares in world LNG trade, share of export to the EU in their total export and membership of various groupings in 2007 ..................................................................................................9 Figure 7: Lower and upper share of various cost items in total LNG chain (%) . 11 Figure 8: LNG and natural gas pathways from extraction to end-use .............. 13 Figure 9: Primary energy consumption to deliver extracted gas by LNG and pipeline path-ways [%, primary fossil energy consumed along the chains / total energy employed (energy of the extracted natural gas and energy consumed from other sources), all on Net Calorific Value /NCV/ basis] ....... 14 Figure 10: Extrapolated energy consumption to bring a unit of extracted natural gas via LNG and pipeline pathways ....................................................... 15 Figure 11: GHG balance of LNG and pipeline natural gas supply pathways (grams of CO2 equivalent emitted to deliver 1 MJ of gas) .................................... 15 Figure 12: GHG emissions to transport a unit of energy by LNG and pipeline pathways .......................................................................................... 16 Figure 13: Overall GHG balance of LNG versus other fossil pathways.............. 16 Figure 14: Composition of European pipeline gas and LNG (the relative size of the bubbles indicates the methane content) ........................................... 18 Figure 15: Physical properties of European pipeline gas and LNG (the relative size of bubbles indicates the density of gas relative to air)........................ 19 Figure 16: Physical properties of pipeline gas and LNG relevant to engine performance (the size of the bubbles expresses the variations in Gross Calorific Value /GCV/; right-hand axis indicates Motor Octane Number equivalent to Methane Number)............................................................ 20 Figure 17: Drawbacks of using regasified LNG in facilities tuned to pipeline gas21 Figure 18: World LNG fleet development 1965-2007, (thousand m3 and number of vessels)......................................................................................... 23 Figure 19: Current (2007) and projected (2010, 2020, 2030) capacity of world LNG fleet (million m3) and number of LNG carriers (based on an average vessel’s capacity of 150,000 m3) .......................................................... 24 Figure 20: World LNG fleet by size in 2007, number of vessels ...................... 24 Figure 21: LNG newbuilding prices by average vessel size (Million USD) ......... 25 Figure 22: LNG newbuilding prices per 1 m3 (USD) ..................................... 25
27
6. LIST OF USED ABBREVIATIONS Bm3 – Billion cubic metres EEA – European Economic Area EU – European Union, (European) Community/ies19 EU-15 – the 15 Member States of the European Union as at 30 April 2004 GECF – Gas Exporting Countries Forum GHG – Greenhouse gas emissions OPEC – Organization of Petroleum Exporting Countries OECD – Organisation for Economic Cooperation and Development
19 Although from a strict legal standpoint, the European Union and European Community/ies are different entities, in this report they are assumed to be identical, reflecting the widely established understanding in Europe.
28
7. BIBLIOGRAPHY 1. BP, Quantifying energy – BP Statistical Review of World Energy 2006, June 2006 2. BP, BP Statistical Review of World Energy 2007, June 2007 3. BP, BP Statistical Review of World Energy 2008, June 2008 4. Brown M., Bryant N., Haynes D., Study on LNG Quality Issues, a study for the European Commission – JRC Institute for Energy prepared by Advantica Ltd., Loughborough, The UK, April 2008 5. Coyle D., Reviewing LNG Specifications, Pipeline and Gas Technology, February 2008 6. Drewry Shipping Consultants Ltd., The Drewry annual LNG Shipping Market Review and Forecast 2007-2008, 2007 7. Ecoinvent Centre, Ecoinvent Data v.2.0, Swiss Centre for Life Cycle Inventories, Dübendorf, 2007 8. EASEE-gas (European Association for the Streamlining of Energy Exchange), Common Business Practice on Harmonisation of Natural Gas Quality, CBP 2005-001/01, Paris, February 2005 9. Enerdata S.A., GlobalStat – October 2007 Database, 2007 10. Energy Business Review Online, GECF unlikely to emerge as OPEC equivalent, 01 July 2005 11. European Commission, EUROSTAT, Energy, transport and environment indicators 2007, Office for Official Publications of the European Communities, 2007 12. European Commission, Directorate-General for Energy and Transport, European Energy and Transport Trends to 2030 – 2007 update, 2008 13. Federal Institute for Geosciences and Natural Resources (BGR), Reserves, Resources and Availability of Energy Resources 2006, 2007 14. Financial Times Ltd., Putin considers creation of gas OPEC, 2 February 2007 15. Financial Times Ltd., Pipe dream, 23 February 2007 16. Financial Times Ltd., Putin visits Qatar amid talks of ‘gas OPEC’, 13 February 2007 17. Financial Times Ltd., Gas cartel might not be in pipeline, 08 April 2007 18. Financial Times Ltd., Gas exporters launch pricing study, 09 April 2007 19. Financial Times Ltd., Gazprom in talks for Asian LNG expansion, 10 September 2007 20. Financial Times Ltd., Concern rises over Qatari gas reserves, 16 October 2007 21. Financial Times Ltd., Gas exporters set to hold ‘gas OPEC’ talks, 25 January 2008 22. Financial Times Ltd., Gulf states target gas flares, 11 March 2008 23. Gas Exporting Countries Forum (GECF), http://www.gecforum.org 24. Gas Technology Institute, Final Report on Gas Interchangeability Tests – Evaluating the Range of Interchangeability of Vaporized LNG and Natural Gas, Study GRI-03/0159, April 2003 25. Global Insight, Global LNG Outlook 2007, 2007 26. Hallouche H., The Gas Exporting Countries Forum: Is It Really a Gas OPEC in the Making?, Oxford Institute for Energy Studies, NG 13, June 2006
29
27. International Energy Agency, Security of Gas Supply in Open Markets – LNG and Power at a Turning Point, Organisation for Economic Co-operation and Development, 2004 28. International Energy Agency, Natural Gas Market Review 2007 – Security in a Globalising Market to 2015, Organisation for Economic Co-operation and Development, 2007 29. International Energy Agency, World Energy Outlook 2007 – China and India insights, Organisation for Economic Co-operation and Development, 2007 30. Intergovernmental Panel on Climate Change (IPCC), 2006 IPCC Guidelines for National Greenhouse Gas Inventories, National Greenhouse Gas Inventories Programme, Japan, 2006 31. JRC/CONCAWE/EUCAR, Well-To-Wheel Analysis of Future Automotive Fuels and Powertrains in the European Context, Version 2c, March 2007 32. Liss W., Rue D., Natural Gas Composition and Fuel Quality Information Report, Gas Technology Institute, February 2005 33. Muñecas M.A. (REPSOL), Old appliances testing in Spain, using natural gas in the upper limit range, MarcoGaz workshop "Towards a harmonised European gas quality specification for high calorific gases", St. Denis, Paris, France, December 2005 34. Ocean Shipping Consultants, Impact of Increased LNG Trade on the Shipping Sector by 2020-2030, a study for the European Commission – JRC Institute for Energy, February 2008 35. Organization of Petroleum Exporting Countries (OPEC), http://www.opec.org 36. RIA Novosti, Gas OPEC: Economic advantages and political drawbacks, 01 February 2007 37. Sevenster, M.N., Croezen, H.J., Optimising the life cycle, Fundamentals of the World Gas Industry, Petroleum Economist, 2006 38. Sevenster M.N., Croezen H.J., The Natural Gas Chain – Toward a Global Life Cycle Assessment, CE Delft, The Netherlands, 2006 39. SoCalGas, Gas Quality and LNG Research Study Final Report, April 2005 40. US Department of Energy, Energy Information Administration, The Global Liquefied Natural Gas Market: Status & Outlook, 2003 41. US Department of Energy, National Energy Technology Laboratory, LNG Interchangeability / Gas Quality: Results of the National Energy Technology Laboratory's Research for the FERC on Natural Gas Quality and Interchangeability, Report DOE/NETL-2007/1290, June 2007 42. Wagbara O.N., How Would The Gas Exporting Countries Forum Influence Gas Trade?, Energy Policy Vol. 35, Elsevier 2007 43. World Bank, First Satellite Observations Of Gas Flaring Show Countries, Companies Need To Step Up Efforts, 30 August 2007 44. World Energy Council, Survey of Energy Resources, 2007
30
European Commission EUR 23818 EN – Joint Research Centre – Institute for Energy Title: Liquefied Natural Gas for Europe – Some Important Issues for Consideration Authors: Boyan Kavalov (Боян Кавалов), Hrvoje Petri´c, Aliki Georgakaki (Αλίκη Γεωργακάκη) Luxembourg: Office for Official Publications of the European Communities 2009 – 30 pp. – 21.0 x 29.7 cm EUR – Scientific and Technical Research series – ISSN 1018-5593 ISBN 978-92-79-12392-4 Catalogue number LD-NA-23818-EN-C DOI 10.2790/1045
LD-NA-23818-EN-C
The mission of the Joint Research Centre (JRC) is to provide customer-driven scientific and technical support for the conception, development, implementation and monitoring of European Union policies. As a service of the European Commission, the JRC functions as a reference centre of science and technology for the Union. Close to the policy-making process, it serves the common interest of the Member States, while being independent of special interests, whether private or national.