Swiss Centre for Life Cycle Inventories A joint initiative of the ETH domain and Swiss Federal Offices
Life Cycle Inventories of Waste Treatment Services Data v1.0 (2003) Gabor Doka Doka Life Cycle Assessments, Zürich
ecoinvent report No. 13 Dübendorf, December 2003
Project "ecoinvent 2000" Commissioners:
Swiss Centre for Life Cycle Inventories, Dübendorf Swiss Federal Roads Authority (ASTRA), Bern Swiss Federal Office for Construction and Logistics (BBL), Bern Swiss Federal Office for Energy (BFE), Bern Swiss Federal Office for Agriculture (BLW), Bern Swiss Agency for the Environment, Forests and Landscape (BUWAL - SAEFL), Bern
ecoinvent Board:
Xaver Edelmann (Chair) EMPA, St. Gallen Alain Cuche, ASTRA, Bern Norbert Egli, BUWAL, Bern Reinhard Friedli, BBL, Bern Gérard Gaillard, FAL, Zürich-Reckenholz Paul W. Gilgen, EMPA, St. Gallen Stefan Hirschberg, PSI, Villigen Stefanie Hellweg, ETHZ, Zürich Olivier Jolliet, EPFL, Lausanne Susanne Kytzia, EAWAG, Dübendorf Christoph Rentsch, BUWAL, Bern Klaus Richter, EMPA, Dübendorf Thomas Köllner, ETHZ, Zürich Mark Zimmermann, BFE, Bern
Participating institutes and consultants:
Swiss Federal Institute of Technology Zürich (ETHZ) Swiss Federal Institute of Technology Lausanne (EPFL) Paul Scherrer Institute (PSI) Swiss Federal Laboratories for Materials Testing and Research (EMPA) Swiss Federal Institute for Environmental Science and Technology (EAWAG) Swiss Federal Research Station for Agroecology and Agriculture (FAL) Swiss Federal Research Station for Agricultural Economics and Engineering (FAT) Chudacoff Oekoscience, Zürich Doka Life Cycle Assessments, Zürich ESU-services, Uster
Software Development:
ifu Hamburg GmbH
Project leader:
Rolf Frischknecht, ESU-services, Uster
Life Cycle Inventories of Waste Treatment Services Project leader:
Roland Hischier, EMPA
Author:
Gabor Doka, Doka Life Cycle Assesments
Review:
Niels Jungbluth, ESU-services Rolf Frischknecht, ESU-services
Contact address:
EMPA P.O. Box CH-9014 St. Gallen www.ecoinvent.ch
[email protected],
[email protected]
Responsibility:
This report has been prepared on behalf of one or several Federal Offices listed on the opposite page (see commissioners). Information has been gathered from sources believed to be reliable. Nevertheless, Doka Life Cycle Assessments does not accept liability for any loss or damage arising from the use of this report.
Terms of Use:
Data published in this report are subject to the ecoinvent terms of use, in particular paragraphs 4 and 8. The ecoinvent terms of use (Version 1.1, 01.07.2003, conditions.pdf) can be downloaded via the Internet (www.ecoinvent.ch, Publications).
Citation: Doka G. (2003) Life Cycle Inventories of Waste Treatment Services. ecoinvent report No. 13. Swiss Centre for Life Cycle Inventories, Dübendorf, 2003 © Swiss Centre for Life Cycle Inventories / 2003
Part I
General Introduction Waste Material Compositions Municipal Waste Collection Author:
Gabor Doka, Doka Life Cycle Assessments
Doka G. (2003) Life Cycle Inventories of Waste Treatment Services. ecoinvent report No. 13, Swiss Centre for Life Cycle Inventories, Dübendorf, December 2003. Final report of the project of a National Life Cycle Inventory Database "Ecoinvent 2000" commissioned by BUWAL/BFE/ASTRA/BLW
Acknowledgements
Acknowledgements I would like to express thanks and gratitude towards the following people: BUWAL, Department Waste, for their excellent and detailed online collection of statistical information on waste in Switzerland. Andreas Keel, Vereinigung für Holzenergie Schweiz, regarding wood ash disposal. Thomas Heck, PSI Villigen, for help with the Wilkinson-Fenton approximation.
ecoinvent report No. 13 – part I
-i-
Summary
Summary This report is a general part on waste management and waste compositions. A general introduction to the waste disposal inventories of ecoinvent 2000 is given. General statistical data on waste in Switzerland and Europe is presented. The larger part of the report details the waste compositions used to calculate the disposal inventories in the ecoinvent database for waste incineration, landfilling, wastewater treatment, and building material disposal.
ecoinvent report No. 13 – part I
- ii -
Table of Contents
Table of Contents ACKNOWLEDGEMENTS ....................................................................................................I SUMMARY ..................................................................................................................... II TABLE OF CONTENTS .................................................................................................... III 1
INTRODUCTION ....................................................................................................... 1 1.1.1
1.2
Other general remarks ........................................................................................................... 3 1.2.1 1.2.2 1.2.3 1.2.4 1.2.5
2
Municipal waste composition................................................................................................ 7 Hazardous waste composition ............................................................................................... 7
WASTE GENERATION AND TREATMENT .................................................................. 11 3.1
Municipal waste generation and treatment.......................................................................... 11 3.1.1 3.1.2 3.1.3
3.2 3.3
4
Displayed vs. significant digits ............................................................................................. 3 Literature references.............................................................................................................. 3 Uncertainty values GSD and GSD2 ....................................................................................... 4 Uncertainty of transport services........................................................................................... 4 Uncertainty of infrastructure exchanges ............................................................................... 5
WASTE CONSTITUENTS ........................................................................................... 7 2.1 2.2
3
Internal references and navigation through the report .......................................................... 2
Swiss municipal waste generation and treatment................................................................ 11 Municipal waste generation and treatment in other countries............................................. 11 Beyond developed waste treatment..................................................................................... 15
Swiss hazardous waste generation and treatment................................................................ 16 Hazardous waste generation and treatment in other countries ............................................ 17
COMPOSITIONS OF WASTE FRACTIONS .................................................................... 19 4.1
Unspecific, general waste fractions..................................................................................... 20 4.1.1 4.1.2 4.1.3 4.1.4 4.1.5 4.1.6
4.2
Plastic waste material .......................................................................................................... 23 4.2.1 4.2.2 4.2.3 4.2.4 4.2.5 4.2.6 4.2.7 4.2.8 4.2.9 4.2.10
4.3
Average municipal waste mixture....................................................................................... 20 Average residual material waste mixture ............................................................................ 20 Average hazardous waste to incineration............................................................................ 21 Average hazardous waste to underground deposit.............................................................. 21 Average wastewater to municipal treatment ....................................................................... 21 Solidifying cement to residual material landfill .................................................................. 22 Polyethylene PE .................................................................................................................. 23 Polypropylene PP ................................................................................................................ 23 Polystyrene PS .................................................................................................................... 23 Polyvinylchloride PVC ....................................................................................................... 23 Polyethylene terephtalate PET ............................................................................................ 23 Polyurethane PU.................................................................................................................. 23 Unspecified municipal plastics mixture .............................................................................. 24 Plastics from electronics products dismantling ................................................................... 24 Polyvinylfluoride to municipal waste incineration.............................................................. 25 Rubber to municipal waste incineration.............................................................................. 25
Biomass waste ..................................................................................................................... 25 4.3.1 4.3.2
Average paper ..................................................................................................................... 26 Packaging paper .................................................................................................................. 26
ecoinvent report No. 13 – part I
- iii -
Table of Contents
4.3.3 4.3.4 4.3.5 4.3.6 4.3.7 4.3.8
4.4
Metal and glass waste.......................................................................................................... 28 4.4.1 4.4.2 4.4.3 4.4.4
4.5 4.6
Structural inorganic building materials ............................................................................... 30 Gypsum products ................................................................................................................ 30 Insulation materials ............................................................................................................. 30 Glass and steel..................................................................................................................... 31 Wood materials ................................................................................................................... 31 Paints................................................................................................................................... 31 Bulk plastic materials .......................................................................................................... 32 Structural composite materials ............................................................................................ 32 Plaster.................................................................................................................................. 32 Plastic sheets ....................................................................................................................... 32 Electric wiring..................................................................................................................... 33
Specific wastes by process .................................................................................................. 33 Waste from furnaces and power plants ............................................................................... 33 4.8.1 4.8.2 4.8.3
4.9
Steel..................................................................................................................................... 28 Aluminium .......................................................................................................................... 29 Tin sheet.............................................................................................................................. 29 Glass packaging .................................................................................................................. 30
Inert materials to inert landfill............................................................................................. 30 Building materials ............................................................................................................... 30 4.6.1 4.6.2 4.6.3 4.6.4 4.6.5 4.6.6 4.6.7 4.6.8 4.6.9 4.6.10 4.6.11
4.7 4.8
Newspaper........................................................................................................................... 26 Packaging cardboard ........................................................................................................... 26 Untreated wood ................................................................................................................... 26 Chrome preserved wood pole.............................................................................................. 26 Chrome preserved building wood ....................................................................................... 27 Textiles to municipal waste incineration............................................................................. 28
Wastewater from energy infrastructure production............................................................. 33 Residue from cooling tower to sanitary landfill.................................................................. 33 Catalytic converter for NOx reduction to underground deposit .......................................... 33
Coal energy ......................................................................................................................... 34 4.9.1 4.9.2 4.9.3 4.9.4
Hard coal tailings to opencast backfill ................................................................................ 34 Hard coal ash to residual landfill......................................................................................... 34 Lignite ash to opencast backfill........................................................................................... 34 Coal ashes from small scale coal furnaces .......................................................................... 37
4.10 Oil energy............................................................................................................................ 37 4.10.1 4.10.2 4.10.3 4.10.4 4.10.5 4.10.6
Oil drilling waste................................................................................................................. 37 Refinery sludge ................................................................................................................... 37 Zeolite in inert material landfill........................................................................................... 37 Separator sludge from mineral oil storage tanks ................................................................. 37 Rain water from mineral oil storage tanks .......................................................................... 38 Condensate from light fuel oil boiler .................................................................................. 38
4.11 Natural gas energy............................................................................................................... 38 4.11.1 4.11.2 4.11.3 4.11.4 4.11.5 4.11.6
Solvents to hazardous waste incineration............................................................................ 38 Soiled textiles to municipal waste incineration ................................................................... 38 Ashes to residual material landfill....................................................................................... 38 Anti-freezer liquid to hazardous waste incineration............................................................ 39 Condensate to hazardous waste incineration....................................................................... 39 Gas pipeline disposal........................................................................................................... 39
4.12 Nuclear energy .................................................................................................................... 39 4.12.1 4.12.2
Uranium mill tailings .......................................................................................................... 39 Wastes from uranium enrichment ....................................................................................... 40
ecoinvent report No. 13 – part I
- iv -
Table of Contents
4.12.3
Uranium hexafluoride production ....................................................................................... 40
4.13 Photovoltaic energy............................................................................................................. 40 4.13.1 4.13.2
Inorganic wastes from silicon wafer production to residual material landfill ..................... 40 Organic wastes from silicon wafer production to underground deposit ............................. 41
4.14 Solar heat energy ................................................................................................................. 41 4.14.1 4.14.2
Wastewater from solar collector tube production ............................................................... 41 Heat carrier liquid to wastewater treatment......................................................................... 41
4.15 Wind energy ........................................................................................................................ 41 4.16 Wood energy ....................................................................................................................... 42 4.16.1
Ash from natural wood incineration.................................................................................... 42
4.17 Paper and cardboard production.......................................................................................... 42 4.17.1 4.17.2 4.17.3 4.17.4 4.17.5
Ash from incineration of deinking sludge to landfill .......................................................... 42 Ash from incineration of wood and bark to landfill............................................................ 42 Wastewater treatment sludge from paper production.......................................................... 42 Green liquor dregs from pulp production............................................................................ 43 Lime residue in inert material landfill ................................................................................. 43
4.18 Building materials production ............................................................................................. 43 4.18.1 4.18.2 4.18.3 4.18.4 4.18.5
Wastewater from processed wood boards production......................................................... 43 Lime sludge from reinforced concrete board production .................................................... 43 Wastewater from concrete production ................................................................................ 43 Wastewater from glass production...................................................................................... 43 Wastewater from ceramic production ................................................................................. 44
4.19 Aluminium production ........................................................................................................ 44 4.19.1 4.19.2 4.19.3 4.19.4 4.19.5
Redmud in residual material landfill ................................................................................... 44 Spent pot lining to residual material landfill ....................................................................... 44 Filter dust from electrolysis to residual material landfill .................................................... 45 Dross from electrolysis to residual material landfill ........................................................... 45 Tar and soot waste to residual material landfill................................................................... 45
4.20 Iron and steel production..................................................................................................... 45 4.20.1 4.20.2 4.20.3 4.20.4
Wastes from pig iron production......................................................................................... 45 Wastes from electric arc furnace steel................................................................................. 45 Wastes from basic oxygen furnaces .................................................................................... 45 Treatment sludge from steel rolling/drawing ...................................................................... 46
4.21 Silicon production ............................................................................................................... 46 4.22 Production of various metals............................................................................................... 46 4.22.1 4.22.2 4.22.3 4.22.4
Overburden.......................................................................................................................... 46 Mining tailings .................................................................................................................... 47 Smelter Slag ........................................................................................................................ 47 Production effluent from galvanic black chromium coating ............................................... 47
4.23 Inorganic chemicals production wastes............................................................................... 47 4.23.1 4.23.2 4.23.3 4.23.4 4.23.5 4.23.6 4.23.7 4.23.8
Solid residues from sodium dichromate production............................................................ 47 Sludge from iron chloride production to underground deposit ........................................... 48 Solid remains from titanium dioxide production................................................................. 48 Phosphogypsum tailings stacks........................................................................................... 48 Solid remains from phosphoric acid purification ................................................................ 49 Chlorine production ............................................................................................................ 49 Salt residues from potash mining to residual material landfill............................................ 49 Water purification ............................................................................................................... 50
4.24 Organic chemicals production wastes ................................................................................. 50 4.24.1 4.24.2
Catalysts from formaldehyde manufacture ......................................................................... 50 Catalysts from ethylene oxide manufacture ........................................................................ 50
ecoinvent report No. 13 – part I
-v-
Table of Contents
4.24.3 4.24.4
Catalysts from ethylene dichloride manufacture ................................................................. 51 Disposal of chemical production facility infrastructure ...................................................... 51
4.25 Agricultural products........................................................................................................... 51 4.25.1
Starch production effluent................................................................................................... 51
4.26 Rail transport ....................................................................................................................... 51 4.26.1
Used rail track support material .......................................................................................... 51
4.27 Road transport ..................................................................................................................... 52 4.27.1 4.27.2 4.27.3 4.27.4 4.27.5 4.27.6 4.27.7
Used mineral oil to hazardous waste incineration............................................................... 52 Asphalt to sanitary landfill .................................................................................................. 53 Bitumen to sanitary landfill................................................................................................. 53 Wastewater from lorry production ...................................................................................... 53 Catalytic converter .............................................................................................................. 53 Automotive shredder residue (ASR) to incineration........................................................... 53 Automobile tyres disposal................................................................................................... 54
4.28 Ship transport ...................................................................................................................... 54 4.28.1
5
LIFE CYCLE INVENTORY OF MUNICIPAL WASTE COLLECTION ................................... 55 5.1 5.2 5.3
Introduction ......................................................................................................................... 55 Fuel consumption of waste collection ................................................................................. 55 Direct air emissions of waste collection .............................................................................. 56 5.3.1 5.3.2 5.3.3 5.3.4
5.4 5.5 5.6 5.7
6
Bilge oil to hazardous waste incineration............................................................................ 54
Exhaust emissions ............................................................................................................... 56 Cold start emissions and petrol fumes................................................................................. 57 Particle emissions................................................................................................................ 57 Emission category ............................................................................................................... 58
Infrastructure for waste collection vehicle .......................................................................... 58 Road infrastructure .............................................................................................................. 59 Uncertainties........................................................................................................................ 59 Inventoried unit process data............................................................................................... 60
DATA QUALITY CONSIDERATIONS .......................................................................... 61 6.1 6.2
The Pedigree approach ........................................................................................................ 61 Mathematical Operations .................................................................................................... 61
ABBREVIATIONS.......................................................................................................... 65 7
APPENDIX ............................................................................................................ 66 7.1 7.2
8
Synopsis of solid waste compositions ................................................................................. 66 Synopsis of wastewater compositions ................................................................................. 83
REFERENCES ....................................................................................................... 88
ecoinvent report No. 13 – part I
- vi -
1. Introduction
1
Introduction
Life cycle assessments are also called 'cradle-to-grave' analysis, because they assess the process chain of a product from production, use to disposal. Often only cradle-to-gate or gate-to-gate assessments are performed in LCA. This report addresses the 'graves'. Waste disposal is a somewhat neglected part in life cycle inventories. While for the production and use phase elaborate data gathering and computation of emissions and burdens is performed, the disposal phase receives often comparatively inferior treatment. For example, mere waste masses are summed up into a single figure, or masses to few classes of wastes are inventoried (see e.g. Boustead 1999). Sometimes only land occupation for landfills is inventoried. Such inventoried parameters pose an unnecessary complication in the valuation step of LCA. Seeing that waste disposal processes are indeed man-made technosphere processes that emit pollutants like any other technosphere process, there seems no need to assign special indirect inventory parameters like 'waste mass' to disposal processes. In the case of inventorying only land occupation for landfills, it is not clear, why for landfills only land occupation should be relevant and not direct emissions. An improvement is the use of average disposal emissions. For example the air emissions, water emissions and auxiliary material inputs during average operation of a waste incinerator can be inventoried. However, seeing that very dissimilar waste materials are depicted with this procedure (paper, plastic, kitchen waste glass, cans) this is by comparison as accurate as if the emissions for any industrial material (metals, plastic, paper etc.) were inventoried using some average industry mix emissions. Calculating disposal emissions in a way which is as detailed as for the production and use phase means to heed the waste-specific burdens generated by or attributable to a specific waste composition. With data from substance flow analysis in disposal processes, it has become feasible to model the fate of single chemical elements in disposal processes. With this information it is also possible to calculate waste-specific disposal inventories. Such inventories were first performed in (Zimmermann et al. 1996, Sundqvist et al. 1997). The aim of the reports in the disposal part of ecoinvent 2000 is to create waste-specific life cycle inventories for different waste compositions, based on the Swiss disposal processes. The report is structured into several parts1: -
Part I
General statistical information, inventory of waste collection and documentation of waste compositions (This part)
-
Part II Inventory model of municipal waste incineration, hazardous waste incineration
-
Part III Inventory model of sanitary landfills, slag compartments, residual material landfills, inert material landfills, subsurface deposits (salt mines) and surface spreading
-
Part IV Inventory model of municipal wastewater treatment
-
Part V
Inventory of building material disposal
All the induced further downstream processes are included in the inventories, e.g. for wastewater treatment, the disposal of resulting wastewater treatment sludge is included. Or for incineration processes, the landfilling of solid incineration residues and resulting burdens are included in the inventories as well. Recycling processes per se are not considered in these inventories. Although for building material disposal, a sorting plant is inventoried which can be seen as a prerequisite for recycling (see part V).
1
Treatment and disposal of radioactive wastes is inventoried in (Dones 2003).
ecoinvent report No.13 – part I
-1-
1. Introduction
Some limited information on electronic dismantling prior to recycling is given in chapter 4.2.8 'Plastics from electronics products ' on page 24. The aim of these reports is to document calculation tools that allow the consistent calculation of life cycle inventory (LCI) data from any waste composition, i.e. not only the disposal of average waste is inventoried by these tools, but also the inventories attributable to the disposal a specified waste fraction. The Excel calculation tools are part of this report and the user shall be enabled to compute inventories of the disposal of user-specified waste materials, that can virtually have any arbitrary combination of characteristics. Some waste material disposals that are common and/or occurring within other parts of the ecoinvent 2000 are already calculated and available in the database. A restriction is however, that only chemical elements are modelled. The fate of individual chemical substances (e.g. PCB, hexachlorobenzene) is not modelled2. The conception and application of the calculation models for different disposal processes is presented in the respective parts of this report. The specific waste compositions for different inventoried wastes are presented for all wastes in chapter 4 'Compositions of waste fractions' on page 19. These reports differ from other reports in the ecoinvent 2000 project, as not only static data tables for some pre-defined processes are provided and documented, but actually software tools. The inventory process therefore aims to anticipate characteristics in any imaginable waste composition and make sure that the software delivers reasonable data, not only for average waste compositions, but also for particular waste fractions. The reporting of this kind of LCI user tools tends to be more complex than for static LCI data tables encountered in other LCI reports. The reason for this is that some calculation steps, that would seem natural or obvious, if performed by a human for a specific waste, need to be formalised, automated and implemented in the software in order to deliver reasonable data for any waste composition. Also a lot of information is cross-connected, and all these co-dependencies need to be formalised3. Almost any section of the report is therefore cross-referenced to another part and the whole calculation procedure is rather elaborate and intricate. I apologise to the reader, if this makes for difficult reading. The reviewers and me tried our best to structure the report in a clear way, without too much redundancy. The advantage is of course that in the end the calculation tool behaves 'intelligently' (reacts correctly for any waste) and besides the waste composition data only little control information is needed to calculate the waste disposal LCI data. Please consult the list of abbreviations and the glossary given prior to the appendices of each report.
1.1.1
Internal references and navigation through the report
Due to the complex nature of the topic, the reports contain a lot of internal references. Internal references to distant tables, figures and chapters within a part are given with the page number for convenience. In the electronic versions of the reports (Adobe Acrobat PDFs) the page references are invisible or boxed 'hotlinks'. They will take you directly to the indicated table, figure or chapter. Move the cursor over the indicated page number. The cursor will change to a pointer ( ). Click and Acrobat takes you to this page. To return to the page you came from use the arrow buttons in the menu bar of Acrobat Reader (cf. Fig. 1.1).
2
For wastewaters however generic fate of COD, BOD, DOC, TOC, NH4, NO3, NO2, Norg, SKN, TKN, PO4, Ppart., Ptot., SO4, Spart, Stot. is heeded as well as for other chemical elements.
3
These dependencies not only affect the calculation of mean values, but also the calculation of uncertainty ranges.
ecoinvent report No.13 – part I
-2-
1. Introduction
Fig. 1.1
Use the arrow buttons in the Acrobat Reader menu bar to return from hotlinks.
Literature references for internet sources are given as underlined weblinks. Move the cursor over the link. The cursor will change to a web pointer in Acrobat Reader ( ). Click and your web browser should start with the indicated URL address.
1.2
Other general remarks
This report deviates in some other respects form other reports in the ecoinvent 2000 project. These differences are pointed out below to avoid misunderstandings.
1.2.1
Displayed vs. significant digits
Figures in the inventory tables of this report often feature several digits. This is not to imply that all the digits are really significant or that the data displayed is very precise (it is mostly not). Showing several digits helps to minimise the avoidable accumulation of rounding mistakes along the chain of calculations performed here, and in possible future studies referring to this data. The level of significance or the uncertainty of the inventoried values is specifically expressed with uncertainty values in ecoinvent 2000. Those uncertainty values shall be used to judge the significance of data values, and not the number formatting in tables. Unnecessary rounding can even introduce new rounding errors which are not accounted in ecoinvent 2000 and which are entirely avoidable4.
1.2.2
Literature references
Literature references are given in round brackets, e.g. (BUWAL 1999). Different references from the same source and year are discerned by lower case letters, e.g. (BUWAL 2000a, BUWAL 2000b etc.). Page numbers for a particular information reference are separated by a colon, e.g. (Leuenberger & Spittel 2001:20). If page numbers are used discontinuously throughout a report, the part of the report is included in the page number reference, e.g. (Zimmermann et al. 1996:B.17, Frischknecht et al. 1996:V.55).
4
For example, if a parameter has a mean value of 0.123 and a GSD2 of 123%, its lower to upper boundary values are 0.1 – 0.151 (mean*GSD±2). The practice of keeping only to the significant digits would suggest to use a 'significant' mean value of 0.1. The rounding mistake is 0.023. The introduced rounding error is comparable to the original parameter uncertainty. Using significant digits only, the original lower boundary value (0.1) is used as the new mean value in this example. The data quality has deteriorated by using significant digits only. In the opinion of the author this is unnecessary and avoidable. The new 'significant' mean value of 0.1 carries less – or less appropriate – information than the original figure 0.123. A rounded mean value of 0.1 can potentially originate from any figure between 0.050 and 0.149. . The uncertainty of this latter range has GSD2 values of approximately 150% to 200%, i.e. is larger than the original parameter uncertainty. Hence, rounding to only one significant digit can lead to intolerable rounding mistakes, which are larger than the original parameter uncertainty. This effect is increasingly alleviated, the larger the one retained significant digit is: for 0.9 the . , which corresponds to a GSD2 of approx. 106%. Rounding to significant digits original figure can be between 0.85 and 0.949 makes sense, only if the original parameter uncertainty so low that the introduced rounding mistake is much smaller than the original parameter uncertainty. In LCA this is often not the case.
ecoinvent report No.13 – part I
-3-
1. Introduction
1.2.3
Uncertainty values GSD and GSD2
Uncertainty ranges can be expressed for lognormal distributions by the geometric standard deviation GSD. The GSD is an 'uncertainty factor' for the confidence range around a mean value (cf. Tab. 1.1). The uncertainty information in the ecoinvent 2000 database relates to a 95%-confidence range. Tab. 1.1
Calculation of confidence ranges expressed with the GSD value.
68% confidence range: 95% confidence range:
lower confidence limit mean/GSD mean/GSD2
upper confidence limit mean*GSD mean*GSD2
In ecoinvent 2000 uncertainty values are often estimated using the Pedigree approach introduced in (Frischknecht et al. 2003a). In this report GSD values derived from the Pedigree approach are usually given as GSD2 i.e. GSD squared. Uncertainty values derived form other sources are sometimes also given as non-squared GSD values GSD. In ECOSPOLD percent values are entered without multiplication with a factor of 1005. I.e. a value of 175% is entered as '175%' or the mathematical equivalent '1.75', but not as '175'. Please note the difference between GSD and GSD2, the latter also denoted as GSD2 or GSD^2. In any case a value of e.g. 175% equals 1.75 (percent is not a unit)
1.2.4
Uncertainty of transport services
In almost every unit process inventory of the ecoinvent 2000 project transport services for transport of materials are inventoried. Transport services can be fulfilled by lorries, rail, ship and air cargo. The functional unit of transport services for goods is ton-kilometer, tkm, i.e. one ton of goods transported for the distance of one kilometer. Average load factors are included in the standard transport modules in the ecoinvent database. During the inventory process the situation often arises that inventoried masses are known, but the transport distances are not. To fill the data gap of transport distances, standard distances are devised for several materials in (Frischknecht et al. 2003a). Within the ecoinvent 2000 project, the uncertainty of transport services when using standard distances, is generally described by a GSD2 value of 209%, using the Pedigree approach (Frischknecht et al. 2003a). Tab. 1.2 shows this generic Pedigree uncertainty. This uncertainty is understood to cover the uncertainty in the transport distance and the uncertainty in the transported mass, i.e. the mathematical product expressed in ton-kilometers. Most reports within the ecoinvent project use this generic uncertainty for transport services when applying the ecoinvent standard distances.
5
This is a deviation in ECOSPOLD from the earlier SPOLD format. In the SPOLD format, percent values were entered with a factor 100, i.e. 175% was entered as 175 (Weidema 1999:16).
ecoinvent report No.13 – part I
-4-
1. Introduction
Tab. 1.2
Generic Pedigree uncertainty of transport services (not used in this report)
Exchange Uncertainty of transport services
GSD2 value Pedigree codes 209% (4,5,n.a.,n.a.,n.a.,n.a.)
Comment Basic uncertainty of 200%; uncertainty of transport services (tkm) using ecoinvent standard distances (km)
In this report however, input masses are often calculated depending on waste compositions. The masses vary and so do the associated uncertainties. For the transport distances usually the ecoinvent standard distances are used. Since the transport services are the product of 'mass' times 'distance', the uncertainties of the transport services are not constant, because the uncertainty in the mass changes. This contrasts with the notion expressed in Tab. 1.2, that devises one constant GSD2 value for the uncertainty of a transport service. Uncertainties of transport services are calculated in this report by first calculating the uncertainty of the product of 'mass' times 'distance' for each individual material. The uncertainty of this product depends on the uncertainties of the factors 'mass of material' and 'transport distance', i.e. standard distance. Next, the uncertainty of the sum of the transports for all the individual materials is calculated using the Wilkinson-Fenton approximation for sums of lognormal distributed summands. To minimise the discrepancy between the procedure in this report and the other ecoinvent reports, the uncertainty of the ecoinvent standard distances is altered to a lower, constant value so that the calculated uncertainties of transport services are in the approximate vicinity of the value given in Tab. 1.2. The uncertainties in the transported masses is usually already quite high (GSD2 typically ranges between 200% and 300%). The uncertainty of the final sum decreases somewhat by use of the Wilkinson-Fenton approximation. By setting the uncertainty of the ecoinvent standard distances to the minimum of 100%, final GSD2 values in the approximate range of 180% to 260% are obtained (compared to a constant value of 209% using the Pedigree approach above). Tab. 1.3
Calculated uncertainties of transport services in this report
Exchange Uncertainty of masses Uncertainty of ecoinvent standard transport distances Uncertainty of transport services
GSD2 ranges approx. 200% – 300% 100%
Comment Variable, dependent on waste composition. Constant value
approx. 180% – 260%
Calculated depending on the figures above. Variable, dependent on waste composition.
This deviation from other project members – although considered an improvement by the author – has earned the respective data modules a review comment: "Passed. Calculation for standard deviation 95 of transport services can differ from standard Pedigree approach used in this project".
1.2.5
Uncertainty of infrastructure exchanges
The Pedigree approach suggest a basic uncertainty of 300% for infrastructure exchanges. Some administrators in the ecoinvent 2000 project have used this basic uncertainty only for infrastructure materials (bricks, concrete, steel etc.), but for infrastructure construction energy used the basic uncertainty for generic energy exchanges (i.e. 105%). In this report the suggested basic uncertainty of 300% for infrastructure exchanges has been applied for both infrastructure materials and infrastructure construction energy. The reason for this is that it
ecoinvent report No.13 – part I
-5-
1. Introduction
seems not feasible that – e.g. in the maximal case – three times as much materials are processed with only 5% more energy6. This deviation – although considered entirely appropriate by the author – has earned the respective data modules a review comment: "Passed. Calculation for standard deviation 95 of infrastructure can differ from standard Pedigree approach used in this project".
6
This would mean that the specific energy consumption per kg built material would decrease by a factor 2.86. Some decrease in specific energy consumption can be expected for larger building volumes, but not to the extent that the absolute energy consumption is almost identical for any size of building. I.e. if three times as much materials are processed, then energy consumption is bound to be (almost) threefold as well, and unlikely to increase only 5%.
ecoinvent report No.13 – part I
-6-
2. Waste Constituents
2
Waste Constituents
The waste compositions use for the life-cycle inventories of disposal processes generated in this study are documented in chapter 4 'Compositions of waste fractions' on page 19. In this chapter a general overview of municipal and hazardous waste is given.
2.1
Municipal waste composition
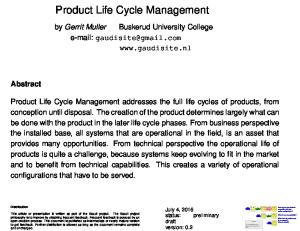
Municipal waste is household refuse and similar waste from small businesses or industry, excluding hazardous or special wastes. Main constituents are kitchen waste (biomass), paper, plastics, metals, glass and fine material. The composition of the waste being disposed of in municipal facilities depends on recycling rates for individual fractions, which are collected separately (e.g. paper, glass, metals, cf. Fig. 3.1 on page 11 and Fig. 3.6 on page 14).
Fig. 2.1
Fig. 2.2
Municipal solid waste sample, sorted according to defined size fractions (Kost & Rotter 2000)
Composition of municipal waste in several countries as an illustration of waste variability. Data is evaluated by EPA from OECD data of 1989 (EPA 1997)
2.2
Hazardous waste composition
Hazardous wastes are a very heterogeneous group of materials. In Switzerland 170 different types of waste are considered as hazardous wastes according to the ordinance on hazardous waste transactions (VVS). The largest type of hazardous waste by weight is 'soil contaminated with mineral oil or other ecoinvent report No.13 – part I
-7-
2. Waste Constituents
substances' (214'000 tons/a). Some other important hazardous waste types are for example: acids, solvents, emulsions with metals, oil mixtures like oil separator sludge, non-metallic shredder residues, dusts, electrostatic precipitator ashes from waste incineration, wastes and distillation residues from organic synthesis, lead batteries, or road gutter sludge. Figures for 1999 are given in Tab. 2.1. The 170 types of hazardous wastes can be grouped into classes with similar characteristics or treatment methods. Fig. 2.3 shows the development of these classes of hazardous waste fractions generated in Switzerland. One of the largest classes – contaminated soils – is very variable in time, and essentially determines the overall trend of the total amount of hazardous wastes generated. Wastes with high heating value are dominantly incinerated (waste solvents, mineral oil mixtures, organic synthesis waste, residues from decanting).
ecoinvent report No.13 – part I
-8-
2. Waste Constituents
Tab. 2.1
Hazardous waste generated in Switzerland 1999 (BUWAL 2001a). The 21 itemised waste types comprise 85% of the total hazardous waste mass in 1999
English
German
soil contaminated with other substances gasoline and oil separator wastes road gutter sludge mineral oil mixtures contaminated materials and appliances non-metallic shredder residues (mostly from cars) electrostatic precipitator ash from MSWI halogen-free or weakly halogenated solvents waste, malfunctions, and byproducts from organic synthesis dusts, fines, fly ashes chlorine-free solvents/mixtures
mit anderen Substanzen verunreinigtes Erdreich
aqueous wastes not contaminated with halogenated solvents soil contaminated with mineral oil distillation residues from organic synthesis residues from decanting, filtration and centrifugation lead batteries weakly halogenated solvents aqueous wastes contaminated with halogenated solvents halogenated solvents acids, free of metals (except iron) chlorinated solvents others Total
ecoinvent report No.13 – part I
waste generated t/a 185'436
Oelabscheider-, Benzinabscheiderabfaelle
69'168
Strassensammlerschlaemme Mineraloelgemische verunreinigte Materialien und Geraete
66'074 49'814 47'547
nichtmetallische Schrederabfaelle
44'590
Elektrofilterstaub aus KVA
42'475
nicht oder schwach halogenierte Loesungsmittel (Chlorgehalt 10'000 years) a major part of the heavy metals are emitted from the tailings stack and leached into the groundwater. No detailed model for long-term emissions from tailings could be created for this study33. The long-term emissions from tailings are therefore neglected. The fraction of elements emitted in the short term (i.e. the first 100 years) is assumed to be 5% for soluble elements (Ca, K, Cl, Na, Mg, S) and 1% for all other elements. The inventory for tailings stacks is documented in detail (Althaus et al. 2003b) and not here.
4.22.3
Smelter Slag
Slag originates from smelting of purified metal ores. Slag composition depends on the ore composition and the used flux materials used to create a slag and the unwanted metals removed by smelting. From nickel metal smelting a limited slag composition (Ni, Co, Cu, Fe, Si, Ca) is available (Althaus et al. 2003b). The mass difference to 100% in the waste composition is inventoried as oxygen. This composition is only for slags from smelting of nickel and nickel-related platinum group metals. The slag is assumed to be deposited in a residual material landfill without solidification.
4.22.4 Production effluent from galvanic black chromium coating During solar collector production, some types of collector tubes are coated (plated) with black chromium (Jungbluth 2003c). The internally pre-treated effluent of this galvanic coating contains organic pollutants and heavy metals (Cu, Cr, Ni, Zn, Pb, Ag, Cd) and is treated in a class 2 municipal wastewater treatment plant.
4.23 4.23.1
Inorganic chemicals production wastes Solid residues from sodium dichromate production
During the production of sodium dichromate (Na2Cr2O7) large amounts of residues are generated from chromium ore processing (Althaus et al. 2003a). Residues are neutralised with lime (CaCO3). The 32
For example oxidation of pyrite: 4 FeS2 + 15 O2 + 14 H2O -> 8 H2SO4 + 4 Fe(OH)3
33
It is possible to create such models from field measurements, analogous to the landfill models. Tailings models were not in the scope of this report.
ecoinvent report No.13 – part I
- 47 -
4. Compositions of waste fractions
residues are rich in chromite (FeCr2O4) and are disposed on a so called 'surface impoundment' located on-site. Surface impoundments are described as natural or man-made 'pools' to hold liquid or slurry wastes for storage, settling or aeration (EPA 2001:1.9). Over 59% of all US impoundments are without any base seal or liner (EPA 2001:2.26). Of the two US dichromate producers34, only the smaller one has disposal facilities with HDPE liners (EPA 2000:11&26). For dichromate production the impoundment is usually located in the abandoned chrome ore quarry (EPA 2000:22). It is assumed that these deposits are not removed after production has ceased. This disposal practice is approximated with the residual landfill model described in part III35. No additional solidification with cement is assumed. A residue composition heeding P, B, Ag, As, Ba, Cd, Co, Cr, Cu, Mn, Mo, Ni, Pb, Sb, Se, Sn, V, Zn, Si, Fe, Ca, Al, K, Mg, and Na is defined in (Althaus et al. 2003a). The remainder to 100% is assumed to be oxygen. The emission potential of chromium in the residual landfill model is limited, as 75% of chromium is assumed to be bound in very stable chromite (FeCr2O4). The short-term emissions (0–100 years) are 6% of the landfilled chromium, the long-term emissions (> 100 years) are another 19% of the landfilled chromium. In total only 25% of the landfilled chromium is emitted. Emission as CrVI is assumed, based on measurements in (Fruchter et al. 1990, Kersten et al. 1998). For more information see chapter 'Speciation of residual material landfill emissions' in part III (landfills) of this report.
4.23.2 Sludge from iron chloride production to underground deposit A sludge rich in carbon, silicon, iron and sulfur originates from iron chloride production (cf. Althaus et al. 2003a). According to manufacturers, the sludge is deposited in an underground deposit. Deposition in a 200 liter steel drum with cement solidification is assumed.
4.23.3
Solid remains from titanium dioxide production
During the production of titanium dioxide (TiO2) solid inorganic residues are produced (cf. Althaus et al. 2003a). Two different titanium dioxide production processes are regarded in ecoinvent 2000: the sulfate process and the chloride process. The technical term for solid residues from the sulfate process is 'digester residues'. In essence the waste is the residue of the ilmenite ore feedstock (FeTiO3) that will not dissolve in hot strong sulphuric acid in the digestion process. The waste is categorised as hazardous because it contains 3-5% free sulfuric acid. The waste is solidified with cement or co-produced gypsum before landfilling. Landfilling in a residual material landfill with cement solidification is assumed. The technical term for solid residues from the chloride process is 'neutralised spray vessel solids'. These wastes are not considered hazardous. They are landfilled without prior treatment. Landfilling in a residual material landfill without cement solidification is assumed.
4.23.4
Phosphogypsum tailings stacks
During the mining of phosphor resources large volumes of phosphogypsum, a solid residue, are created (Althaus et al. 2003a). Per kg of P2O5 approximately 5 kg of phosphogypsum are produced. Phosphogypsum is stacked on site in up to 60 m tall piles. Phosphogypsum consists largely of gypsum 34
Elementis Chromium, Corpus Christi, TX (capacity 49'900 t/a) and Occidental Chemical Corporation "Oxychem", Castle Hayne, NC (capacity 106'200 t/a). Capacity data for 1997 from (EPA 2000).
35
The residual landfill model includes a base seal and recultivation, which is not entirely appropriate here, but is of minor importance in the total landfill burdens which are dominated by leachate emissions.
ecoinvent report No.13 – part I
- 48 -
4. Compositions of waste fractions
(CaSO4) but contains also fluorine, radioactive uranium and radium. The pH is very acidic and ranges at 2.6 to 1.2. No detailed model for emissions from tailings could be created for this study36. An estimate of emissions from phosphogypsum stacks is described in (Althaus et al. 2003a).
4.23.5 Solid remains from phosphoric acid purification An inorganic, solid residue originates during the purification step of phosphoric acid production (cf. Althaus et al. 2003a). It contains anhydrite (calcium sulfate) and apatite (calcium phosphate) and is rich in fluorine. According to manufacturer, the sludge is landfilled. Landfilling in a residual material landfill is chosen. Additional solidification with cement in the landfill is assumed.
4.23.6
Chlorine production
Sludge from NaCl electrolysis to residual material landfill During the production of chlorine gas (Cl2) from chlorine-alkali electrolysis, an inorganic brine filtration sludge is produced (Althaus et al. 2003a). The sludge mainly contains calcite (CaCO3), magnesium hydroxide (Mg(OH)2) and barite (BaSO4). For the electrolysis using mercury cells the sludge can also contain up to 150 ppm mercury. No further information was available from the manufacturers. An estimated composition of 47.5% calcite, 47.5% magnesium hydroxide, 5% barite and 0% water was assumed37. For the case of mercury cells electrolysis a similar composition was assumed, but containing 75 ppm mercury. Additional solidification with cement in the landfill is assumed for both wastes. Spent activated carbon to underground deposit During the production of chlorine gas (Cl2) from chlorine-alkali electrolysis, spent activated carbon is produced (Althaus et al. 2003a). The carbon absorber purifies the flue gas from the mercury cell process. The spent carbon contains 0.1 to 50 w% (sic) mercury. In a distillation step the mercury is recovered. The remaining carbon contains 20 to 200 ppm mercury. It is assumed that this remaining waste is disposed in an underground deposit. The expenditures for the mercury recycling are not contained in this module. Deposition in a BigBag (large LDPE bag) is assumed.
4.23.7
Salt residues from potash mining to residual material landfill
During potash mining for potassium fertilisers (cf. Nemecek et al. 2003) large quantities of unusable salts are co-mined ('salt tailings'). These salt tailings consist mainly of Kieserite (MgSO4·H2O), Carnallite (KCl·MgCl2·6H2O), rock salt (NaCl) and Anhydrite (CaSO4). The majority of the tailings is stacked on the surface on piles. A smaller amount is disposed internally in the potash mine as backfill. Aqueous solutions of salt tailings are also injected into deep groundwater. In this study only the surface tailings stack is inventoried. It is assumed that the stack is similar to an inorganic waste dump (landfill). For calculations of the emissions the model of residual material landfill is used. No solidification is assumed. No measurements of trace contents is available.
36
It is possible to create such models from field measurements, analogous to the landfill models. Tailings models were not in the scope of this report.
37
The carbon from carbonate was heeded as oxygen. Otherwise it would be interpreted as organic carbon.
ecoinvent report No.13 – part I
- 49 -
4. Compositions of waste fractions
4.23.8
Water purification
Ion exchange resins to municipal waste incineration During production of potable water, anion and cation exchange resins are used to treat the water. The resins can be regenerated with NaCl, but eventually have to be disposed (cf. Althaus et al. 2003a). Disposal in municipal waste incinerators is common, if the treated water is not polluted. No information on the spent resin composition was available. Exchange resins are usually copolymers of styrene. Cation exchange resins commonly have a sulfonate functional group (R–SO3-) to bind cations. For anion exchange resins a dihydroxyamine functional group is common (R-N(OH)2+). For industry products, a styrene copolymer with 8% divinylbenzene (DVB) can be assumed to be typical38, which results in a theoretic composition C204H181(SO3-Na+)23. and C1234H1786(N(OH)2+Cl-)92. Detailed calculations see the chapter on drinking water production in Althaus et al. (2003). The spent resins are assumed to be charged with typical amounts of cations (Mg2+, Ca2+, K+, Na+) and anions (NO3-, SO42-, SiO22-, Cl-, HPO42-), for cation exchange resins and anion exchange resins, respectively. This information is complemented with heavy metal trace element compositions found in polystyrene waste fraction of municipal waste and an estimated water content of 50%. The anion exchange resin is also used as a proxy for epoxy-polyamine exchange resins of unknown composition in the uranium enrichment step. Cf. chapter 4.12.2 'Wastes from uranium enrichment' on page 40. Decarbonising waste to residual material landfill Decarbonising waste is carbonate-rich waste obtained during decarbonisation of water. A waste composition for slow decarbonisation from (VGB 1990) is adopted with a water content of 30%. The carbon on this waste is dominantly from inorganic carbonate. In the residual material landfill model carbon in waste leads to organic carbon emissions. This is not suitable here. The carbon in this waste is therefore registered as neutral oxygen. This composition is also used for lime sludge from wastewater treatment in reinforced concrete board production (see chapter 4.18.2 'Lime sludge from reinforced concrete board production' on page 43).
4.24
Organic chemicals production wastes
4.24.1
Catalysts from formaldehyde manufacture
For the manufacture of formaldehyde (CH2O), catalysts containing iron and molybdenum or vanadium oxide are used (Althaus et al. 2003a). The metals are removed from the used catalyst and recycled. The remaining catalyst matrix is landfilled. The matrix material is assumed to be SiO2. No measurements for traces could be obtained. As a cautious guess, a concentration of 5 ppm of molybdenum and vanadium is assumed for the landfilled material39. Iron is assumed not to be recycled and to be present in 5 w% in the landfilled catalyst. Disposal in a residual material landfill without solidification is assumed.
4.24.2
Catalysts from ethylene oxide manufacture
For the manufacture of ethylene oxide (C2H4O), catalysts containing silver oxide on a porous carrier such as aluminium oxide Al2O3 are used (Althaus et al. 2003a). The silver is removed from the used 38
See for example http://www.resintech.com/index.cfm?Point=Products.
39
5% estimated concentration of silver in catalyst and an estimated removal efficiency of 99.99% in recycling.
ecoinvent report No.13 – part I
- 50 -
4. Compositions of waste fractions
catalyst and recycled. The remaining catalyst matrix is landfilled. No measurements for traces could be obtained. As a cautious guess, a concentration of 5 ppm of silver is assumed for the landfilled material40. The remainder is assumed to be aluminium oxide Al2O3. Disposal in a residual material landfill without solidification is assumed.
4.24.3
Catalysts from ethylene dichloride manufacture
For the production of ethylene dichloride41 (EDC, CH2Cl-CH2Cl), catalysts with copper or iron chloride are necessary (Althaus et al. 2003a). The spent EDC catalyst contains octochlorodibenzofurans, which have dioxin-related toxicity. The concentration in these materials is high (approx. 1 mg TEQ TCDD per kg waste42). Copper content is in the range of 1–10% (Cavaterra & Novara 1986). An average value of 5.5% is assumed here. The remainder is assumed to be SiO2. Disposal in underground deposit and in hazardous waste incinerators are inventoried. Disposal in underground deposit in a 200 liter steel drum without cement solidification is assumed. The fate of dioxin is not heeded waste-specifically in the HWI model (see part II). Instead a constant emission of 3 ng TEQ is attributed to each kg of incinerated waste, regardless of input (processspecific emission). With an input 1 mg TEQ per kg of spent catalyst, this suggests a dioxin removal of 99.9997%. This is in the vicinity of a common destruction and removal efficiency (DRE) for highly toxic compounds (99.9999%). No additional dioxin emissions are inventoried for this waste.
4.24.4
Disposal of chemical production facility infrastructure
The disposal of the infrastructure of chemical production facilities (including electronics) is inventoried in (Althaus et al. 2003a).
4.25 4.25.1
Agricultural products Starch production effluent
During starch production from maize and potatoes a wastewater is produced, which is discharged to canalisation (Nemecek et al. 2003). Treatment in municipal wastewater treatment plant of size class 2 is assumed. For the disposal of the resulting treatment sludge 60% incineration and 40% agricultural application is assumed.
4.26
Rail transport
4.26.1 Used rail track support material Large masses of the gravel and sand that are used to build the supporting base (ballast) of a rail track, can be recycled after use (Spielmann et al. 2003). Usually a cleaning step is necessary to remove fines from old material. Fines are unwanted for reasons of mechanical track stability. The fines removed are assumed to be 2 w% of the total waste material, based on information from Wigro (1999). Sometimes track material is also polluted with heavy metals or organic pollutants, e.g. from herbicide use or from accidental or routine spills of chemicals or lubricants. Such material can be cleaned and reused. The pollutant fraction separated during cleaning needs to be disposed. Disposal in a residual material 40
5% estimated concentration of metals in catalyst and an estimated removal efficiency of 99.99% in recycling.
41
Ethylene dichloride is the educt for the production of the vinyl chloride monomer (VCM, CH2=CH-Cl), which is the building block of polyvinylchloride resins (PVC).
42
20.3 µg I-TEQ TCDD in 20.3 g spent catalyst per ton of produced EDC (Althaus et al. 2003a).
ecoinvent report No.13 – part I
- 51 -
4. Compositions of waste fractions
landfill is considered here. Since the landfill model only heeds chemical elements as input and not specific compounds, possible herbicide or mineral oil traces are not heeded here. Tab. 4.9
Pollutant
Arsenic Lead Cadmium Cr tot. Cr-VI Copper Nickel Mercury Zinc Inert fines Sum
Calculation of the removed parts in polluted rail track material
A TLV ppm 15 50 1 50 0.05 40 50 0.5 150
B % at TLV sum % 98%1 97% 98% 80% 98%1 75% 90% 98%1 95%
C D max. removed conc. ppm mg/kg 15.31 0.0361 51.5 0.196 1.02 0.00241 62.5 3.5 0.051 0.000120 53.3 4.33 55.6 1.056 0.51 0.0012 157.9 1.14 947 2 958
E composition ppm 38 205 2.51 3655 0.126 4525 1102 1.26 1195 989'275 1'000'000
A: Threshold limit value TLV for unpolluted excavation material B: Percentage of rail track material samples exceeding the limit value in A (160 samples in Fuhrer et al. 2000:15) C: Estimated maximal concentration in rail track material samples, assuming a triangular probability distribution with a maximal likelihood value MLV of zero. D: Mass of pollutant that needs to be removed in a cleaning step from 1kg average rail track material, assuming that on average a share of (100% minus column B) needs to be cleaned, that the treated material originally contained a concentration C of pollutants, and that the cleaned material contains a final concentration of 90% of column A. In total, a mass of 958 mg/kg needs to be removed. E: Composition of the removed pollutants/fines in cleaned rain track material. 1: Estimate based on value for cadmium. 2: Inert fines in track material. Geometric mean of 20'000ppm*(100% minus column B). 20'000 ppm=2 w%
Per kilogram of average rail track material, approximately 958 milligram of a concentrated pollutant fraction with the composition given in column E of Tab. 4.9 is separated. The calculation procedure is explained in the table footnotes. This material needs to be landfilled in a residual material landfill. Solidification with cement is assumed. Inert fines are assumed to be silicon. The concentrations in the disposed composition is rather high. The mass of pollutants per kg old rail track material (i.e. residue composition times 958 mg per kg old rail track material) should be in the right order of magnitude. For each kilogram of all rail track material, a total of 2 w% of inert fines are removed. A small part of that (0.0947 w%) is already separated in the washing of polluted materials (cf. Tab. 4.9) and is landfilled. A remainder of 1.905 w% is separated from unpolluted materials (for mechanical reasons) and is either recycled in building material production (e.g. cement kiln) or is landfilled in an inert material landfill.
4.27 4.27.1
Road transport Used mineral oil to hazardous waste incineration
Used mineral oil is obtained in the maintenance of transportation vehicles for road and rail. Metals traces are adopted from (VDZ 2000:18) for As, Pb, Cd, Cr, Cu, Ni, Hg, Tl and Zn. Further waste composition (C, H and P) is adopted from (BUWAL 1993, Citepa 1981).
ecoinvent report No.13 – part I
- 52 -
4. Compositions of waste fractions
4.27.2
Asphalt to sanitary landfill
Asphalt is a mixture of bitumen and minerals (gravel, sand stone, clay, lime etc.). Waste asphalt originates from maintenance and dismantling of transportation infrastructure (roads, ports). Waste asphalt can be reprocessed on site and only small amounts are landfilled. A bitumen content of 5.3% is adopted from (Frischknecht et al. 1996:B.18). Bitumen composition is detailed in the according to chapter 4.27.3 'Bitumen to sanitary landfill' on page 53. Mineral composition is inventoried as SiO2.
4.27.3
Bitumen to sanitary landfill
Bitumen wastes originate e.g. from building materials (e.g. water-proof seals). Bitumen composition is adopted from (Frischknecht et al. 1996:IV.19) and complemented with sodium, aluminium, silicon, calcium, phosphor, lead, arsenic, molybdenum, cobalt, chromium, selenium, and mercury content of heavy fuel oil given in (Frischknecht et al. 1996:IV.18). This approximation is justified as bitumen and heavy fuel oil originate from the same distilling fraction during refining (Frischknecht et al. 1996:IV.130).
4.27.4
Wastewater from lorry production
A wastewater charged with sulfur, chlorine, nickel, lead, zinc in the sub-ppmw range is discharged from lorry production sites to the local sewer system (Spielmann et al. 2003). Treatment in a class 1 plant (large city sewage treatement) is assumed.
4.27.5
Catalytic converter
Catalytic converters are recylced for their platinum content. Used catalytic converters are also disposed in underground deposits. For disposal an inventory module 'catalytic converter for cars to underground deposit' is created (a similar module 'catalytic converter NOx reduction to underground deposit' shall be used for stationary industrial converters). Deposition in a 200 liter steel drum without cement solidification is assumed.
4.27.6 Automotive shredder residue (ASR) to incineration Automotive shredder residue (ASR, or German: RESH, 'Reststoffe aus Shredderwerken') is a mixture of fine remains from the shredding of used cars (Spielmann et al. 2003) and tractors (Nemecek et al. 2003). It mainly consists of fine plastic and metal particles and contains large quantities of heavy metals. In Switzerland approximately 50'000 to 60'000 tons of ASR are produced annually. Plans are underway to build the first European ASR recycling plant in Switzerland, which extracts metals in a recyclable form from ASR (Strässle 2002). Operation is expected to start approximately in 2005. As an intermediary solution, ASR is incinerated in Swiss or foreign MSWIs. During 1996 to 2000, only 0.6 % were landfilled in the Swiss municipal landfill Sorval VD (IGEA 2001). Approximately 18% was disposed in the recycling plant Citron, Le Havre, that produced marketable fractions of Hg, ZnO, CdO, Mn and Fe. To inventorise the disposal of ASR the module 'plastics, mixture to municipal incineration' is used for all polymers (rubber, plastics, lacquer) along with additional modules for small metallic parts to municipal incineration (aluminium, steel, copper, zinc, lead). The small metallic parts are assumed to be finely dispersed, since larger bulk metals are recycled. Accordingly, the metals are assumed to be only 50% inert (transferred completely to bottom ash) and 50% burnable (partly transferred to raw gas during incineration). For aluminium the aluminium composition found in MSWI is used (cf. chapter 4.4.2 'Aluminium' on page 29). For steel the iron scrap composition found in MSWI is used (cf. ecoinvent report No.13 – part I
- 53 -
4. Compositions of waste fractions
chapter 4.4.1 'Steel' on page 28). For copper, a composition estimated for copper particles recycled from MSWI bottom ash is used (Doka 2002:29).
4.27.7 Automobile tyres disposal In Switzerland, used tyres are disposed via specific disposal companies. Old tyres are sorted out for export43 and for final disposal. The latter takes place predominantly in cement kilns and to a minor part in municipal waste incinerators. In Switzerland cement kilns burned 15'000 tons old tyres in 2000 (BUWAL 2001l). Rubber incineration in cement kilns is treated in (Kellenberger et al. 2003). There, emissions from rubber incineration (and other alternative fuels) is fully accounted to cement production, i.e. waste rubber is percieved as valuable alternative fuel in the cement production process inventory and less as a burdensome waste44. This understanding conveyed by the allocation choice in the inventory for cement production is not reflected by involved costs: cement kilns are paid a fee to accept old tyres45. This suggests that tyres are in fact regarded as a waste and not a valuable commodity (i.e. not a fuel). However, this probably reflects the circumstance that no other facility will accept old tyres without charge. Also zinc contents limit the use of tyres as alternative fuel in cement kilns (BUWAL 1998a), which demands attention in cement kiln operation. This latter point also establishes the value of tyres as a waste, rather than a fuel. However, this allocation issue is managed here in order to be compatible with the inventory of cement production: tyres disposed in cement kilns (approx. 50% of all tyres) have no further burden to the road vehicle life cycle (cut-off to recycling). But tyres disposed in municipal incinerators (approx. 10% of all tyres) are inventoried with the disposal modules 'steel' and 'rubber' to municipal incineration and the resulting burdens are fully allocated to the road vehicle life cycle. Exported old tyres (approx. 40% of all tyres) are treated as recycling (cut-off system boundary).
4.28 4.28.1
Ship transport Bilge oil to hazardous waste incineration
Bilge oil is a liquid pumped from the bottom of ships. It contains wasted mineral and lubricating oil residues. A small fraction (0.5 – 1 w%) of the lubricants and fuels in ship operation is transferred to bilge. Bilge composition is adopted from (Frischknecht et al. 1993:IV.112) with a water content of 90%.
43
Run down tyres with insufficient profile are e.g. wanted in sand desert regions.
44
Also, the incineration residues of fuels in cement kilns (including residues from alternative fuels) become part of the cement product.
45
Personal communication with Michael Spielmann, UNS-ETH Zürich, according to information from Tyre association Switzerland (Reifen Verband Schweiz) of December 11, 2002
ecoinvent report No.13 – part I
- 54 -
5. Life Cycle Inventory of Municipal Waste Collection
5
Life Cycle Inventory of Municipal Waste Collection
5.1
Introduction
Prior to the disposal, waste has to be hauled to the disposal site – be it a waste incinerator or a landfill. This transport is usually not included in the waste disposal inventories (Frischknecht et al. 2003a)46. The waste transport to incinerators and landfills must be inventoried with the waste-producing process. Waste of businesses and industries can be transported directly by lorry to the disposal site. In case of household or comparable waste (municipal solid waste MSW) municipal collection of the waste with special waste collection vehicles usually applies. Here the inventory of such municipal waste collection is presented to be used in the inventories of waste-producing processes. The author of inventories of waste-producing processes has to decide if direct transport or municipal collection is more appropriate for the generated wastes. Of a total mass of 2.8 Mio. tons of MSW incinerated in Swiss MSWIs in 2000, a share of 59% (1.66 Mio. tons) were delivered by municipal collection (BUWAL 2001c). The functional unit of the waste collection service is ton-kilometers (tkm), including an average load of 50%. The inventory presented here is based on a lorry of the 16 t class inventoried in (Spielmann et al. 2003). Adaptations are documented below.
5.2
Fuel consumption of waste collection
Fuel consumption figures of waste collection from different studies are presented in Tab. 5.1. This fuel consumption includes 'Stop&Go' transport and hydraulic waste compression. A collection truck has a nominal capacity of 8.2 t (Bürgin & Steinemann 1991). The lorry is gradually filled up along the collection route. When fully loaded the lorry returns to the disposal plant and returning empty to the collection route. This leads to an average load factor of approximately 50%. Per vehicle-kilometer (vkm) an average of 4.1 ton-kilometers (tkm) is accomplished. Tab. 5.1
Waste collection data from different studies
per t MSW
Area
Bürgin & Steinemann 1991 Baumann & Ménard 1992 Gebler 1992 ATAL 1993
Hinwil Winterthur Germany Canton Zürich Zürich municipality
2
This study
Distance km 10.4 – – 9.4 3.1 10 1
Diesel consumption l/t waste 5.1 4.35 5 4.8 2.1 4
NOx emisison g/t waste 240 – 36 >220 – see Tab. 5.2 below
1 suggested standard transportation distance to MSWI in ecoinvent 2000 2 communication with Peter Keller, Abfuhrwesen der Stadt Zürich, AWZ, January 23, 1996
46
The exception is the disposal of building wastes (part V) which includes on-site demolition and subsequent transport of the waste material. Also in wastewater treatment (part IV) transport of wastewater in sewers is included in the inventory.
ecoinvent report No.13 – part I
- 55 -
5. Life Cycle Inventory of Municipal Waste Collection
Per functional unit (tkm) 0.4 l of diesel are consumed (4 l/t / 10 km from Tab. 5.1). With a density of 0.84 kg/l the diesel consumption is 0.336 kg/tkm. A GSD value of 111% is estimated from the range in Tab. 5.1.
5.3 5.3.1
Direct air emissions of waste collection Exhaust emissions
Exhaust emissions are based on emissions for a lorry of the 16 t class in (Spielmann et al. 2003). The 16 t class includes lorries with gross weights ranging from 3.5 – 20 t. Waste collection leads to an enforced Stop&Go driving cycle. This type of driving leads to increased emissions of volatile organic compounds VOC, particulate matter PM10 and carbon monoxide CO, but reduced NOx emissions. The diesel emission factors from normal lorry transport are adjusted here accordingly. Tab. 5.2
Adjustment of emission factors for 16t lorry to Stop&Go driving of waste collector lorries.
Emission
Original emission Adjustment Adjusted factor for 16t factor for emission factor lorry 1 Stop&Go driving for Stop&Go 2 driving 3 g/l diesel g/l diesel Carbon dioxide CO2 2646 15 2646 Carbon monoxide CO 5.527 1.24 6.832 Particulate Matter (PM10) 1.483 1.11 1.642 Nitrogen Oxides NOx 25.3 0.75 18.95 Nitrous Oxide N2O 0.1312 16 0.1312 Ammonia NH3 0.01988 16 0.01988 5 Sulphur Dioxide SO2 0.505 1 0.505 NMVOC 4.06 2.13 8.637 Methane 0.0994 2.13 0.2115 Benzene 0.07952 2.13 0.1692 Toluene 0.03181 2.13 0.06767 Xylene 0.03181 2.13 0.06767 Cadmium 0.00000839 15 0.00000839 5 Copper 0.001427 1 0.001427 Chromium 0.00004215 15 0.00004215 Nickel 0.00005885 15 0.00005885 Selenium 0.00000839 15 0.00000839 5 Zinc 0.000839 1 0.000839
Adjusted emission factor for Stop&Go driving 4 mg/tkm 1'059'000 2733 656.6 7579 52.49 7.952 202 3455 84.59 67.67 27.07 27.07 0.00336 0.571 0.01686 0.02354 0.003356 3.333
1 Calculated from data given in (Spielmann et al. 2003)with a specific diesel consumption of25.15 l/100vkm (or 211.26g/vkm) given in (Spielmann et al. 2003). 2 Average adjustment actors from stationary cycle ('ECE-13') to Stop&Go cycles ('US-Transient and TÜV-FIGE') from (BUWAL 1995a:183). 3 Adjusted emission factors from original emission factor for 16t lorry and adjustment factors for Stop&Go. 4 Derived from a fuel consumption of 0.4 l/tkm for waste collection (see chapter 5.2 'Fuel consumption of waste collection' on page 55). 5 These emission factors (per l diesel) can be assumed to remain unchanged in Stop&Go driving. 6 These emission factors (per l diesel) can be assumed to change in Stop&Go driving, but no adjustment factors could be derived from (BUWAL 1995a:183).
ecoinvent report No.13 – part I
- 56 -
5. Life Cycle Inventory of Municipal Waste Collection
5.3.2
Cold start emissions and petrol fumes
The emissions involved in fueling a vehicle (petrol fumes) are taken into account in the fuel module (petrol, at regional storage). In (Spielmann et al. 2003) VOC evaporation from hot motors and cold start emissions were only inventoried for delivery vans, but not for heavy duty vehicles (>3.5 t). This data gap is not corrected here.
5.3.3
Particle emissions
Particle emissions are inventoried in three size classes in ecoinvent 2000. The complementary ranges from 0 – 2.5 µm, from 2.5 – 10 µm, and >10 µm aerodynamic diameter are discerned in the inventory. These size classes are commonly termed 'fine', 'coarse' and 'large' particles, respectively. Exhaust emissions A PM10 value for exhaust emissions is derived in Tab. 5.2. The TSP distribution profile is adopted from TSP emissions for a 16 t lorry from (Spielmann et al. 2003): 88.7% fine, 7.5% coarse, and 3.9% large. Tab. 5.3
PM emission factors for waste collection.
PM category fine 10 µm TSP 1
PM profile 88.7% 7.5% 3.9% 100%
Emission factors g PM/tkm 0.6057 1 0.0509 1 0.0263 0.683
Please note that the sum of fine and coarse particles gives the emission factor of 0.6566 g PM10/tkm as given in Tab.
5.2.
Tyre abrasion Values of 0.2 g PM10 and 0.768 g TSP per vkm are adopted from (Hüglin 2000) for Swiss heavy duty vehicles in urban Stop&Go traffic. A fraction of 5% of PM10 is assumed to be PM2.5. A factor of 4.1 tkm per vkm is used to calculate emission factors per tkm. Heavy metals are present in the tyre, which are inventoried additionally. Concentrations of heavy metals in tyre material is 1.6% zinc, 26 ppm lead and 6 ppm cadmium. Based on total TSP matter from tyres, emissions to air of 3 mg zinc, 0.0049 mg lead, and 0.0011 mg cadmium per tkm waste collection are calculated. Brake abrasion Values from (Lükewille 2001) are adopted for European heavy duty vehicles (7.1 mg/vkm PM2.5, 22.8 mg/vkm PM10, 27.5 mg/vkm TSP). A factor of 4.1 tkm per vkm is used to calculate emission factors per tkm. Though not considered a major source of particles, the materials involved in brake abrasion are different, than for tyre abrasion. The involved toxic materials have to be inventoried additionally to the particle emission (Frischknecht et al. 2003a). Trimbacher & Neinavaie (2002:30) found materials like brass (Cu-Zn) and copper, as well as iron, graphite and silicates to be typical for deposited particles ecoinvent report No.13 – part I
- 57 -
5. Life Cycle Inventory of Municipal Waste Collection
originating from brake abrasion in road traffic. Österle et al. (2000) give the composition of one case study sample of a braking lining material to be composed of 48% barite (BaSO4), 14% vermiculite (SiO2), 19% phenolic resin, 4.6% antimony sulfide Sb2S3, 6.4% aramide, 7.5% natural rubber, 0.3% Sulfur (S), 0.1% Zinc oxide ZnO. The braking layer is however just a part of the emitted braking particles. Due to lack of further quantitiative information the composition of emitted brake lining particles is not inventoried. Road abrasion and re-suspended road dust The values given in (Spielmann et al. 2003) are adopted without change. A factor of 4.1 tkm per vkm is used to calculate emission factors per tkm. Tab. 5.4
Synopsis of particle emissions from all sources.
g/tkm
PM2.5
PM2.5-PM10
PM >10
Sum TSP
From fuel Tyre abrasion Brake abrasion Road abrasion
0.606 0.00244 0.00173 0.0051
0.0509 0.0463 0.00383 0.00417
0.0263 0.139 0.00115 0.00927
0.683 0.187 0.00671 0.0185
Total
0.615
0.105
0.175
0.896
Underlined figures indicate dominant contributions
Exhaust emissions are generally the largest source of particles (indicated by underlining in Tab. 5.4), except for PM>10 where tyre abrasion is dominant.
5.3.4
Emission category
Seeing that waste collection vehicles operate mainly in populated areas to collect waste of municipalities, all air emissions are inventoried as being emitted in areas with high population density.
5.4
Infrastructure for waste collection vehicle
In (Spielmann et al. 2003) the expenditures for construction, maintenance and disposal of vehicle infrastructure is inventoried per one single vehicle unit. For the 16 t lorry class an average load of 2.93 tons is assumed and a vehicle lifetime mileage 540'000 vkm. This amounts to a lifetime service performance of 1'582'200 tkm per vehicle unit. Per tkm with a 16 t lorry a fraction of 6.27·10-7 vehicle units is inventoried. These figures change for the waste collection vehicle. It is estimated here that the total mass of the collection vehicle is 30% higher than that of a generic 16 t lorry. The total mass of the waste collection vehicle is 21t. Expenditures for lorry construction and disposal, but not maintenance, are increased accordingly. The average load is 4.1 tons and a vehicle lifetime mileage 540'000 vkm is assumed47, resulting in a lifetime service performance of 2'214'000 tkm per vehicle unit. Per tkm a fraction of 4.52·10-7 16 t lorry maintenance units is inventoried. For construction and disposal the figure is a factor 1.3 larger.
47
This same figure is used for all lorries, 16 t, 28 t, and 40 t class, in (Spielmann et al. 2003).
ecoinvent report No.13 – part I
- 58 -
5. Life Cycle Inventory of Municipal Waste Collection
Tab. 5.5
Expenditures for construction, maintenance and disposal of waste collection vehicle infrastructure
construction maintenance disposal
5.5
Mass increase in waste collection vehicle compared to 16 t lorry 30% 0% 30%
Units of 16 t lorry infrastructure per tkm with waste collection vehicle 0.000000587 0.000000452 0.000000587
Road infrastructure
In (Spielmann et al. 2003) the expenditures for construction, maintenance and disposal of roads is given in meter-years, i.e. one meter of average road mix for the duration of one year, denote as 'ma'. For cargo transport the Swiss road network, a general figure of 641 ma per Mio. tkm is calculated in (Spielmann et al. 2003). For construction, maintenance and disposal of roads an amount of 0.000641 ma is inventoried per tkm also for waste collection.
5.6
Uncertainties
For uncertainty ranges of all exchanges the same GSD values as derived in (Spielmann et al. 2003) for 16t lorries are used without modification. The original data covers special vehicles like collection vehicles.
ecoinvent report No.13 – part I
- 59 -
5. Life Cycle Inventory of Municipal Waste Collection
5.7
Inventoried unit process data
Tab. 5.6
Inventoried exchanges for municipal waste collection transport, municipal waste collection, lorry 21t
Location InfrastructureProcess Unit diesel, at regional storage
StandardDeviation95% GSD2
Unit
Location
Infrastructure Process
Name
CH 0 tkm CH
0
kg
Carbon dioxide, fossil Carbon monoxide, fossil Nitrogen oxides Dinitrogen monoxide Ammonia Sulfur dioxide NMVOC, non-methane volatile organic compounds, unspecified origin Methane, fossil Benzene Toluene Xylene Cadmium Copper Chromium Nickel Selenium Zinc Lead Particulates, < 2.5 um Particulates, > 2.5 um, and < 10um Particulates, > 10 um
0.336
123.2%
kg kg kg kg kg kg kg
1.05857654 0.00273271 0.00757928 5.2485E-05 7.9523E-06 0.00020199 0.00345477
107.1% 500.4% 150.4% 150.4% 150.4% 107.1% 150.4%
kg kg kg kg kg kg kg kg kg kg kg kg kg kg
8.4593E-05 6.7674E-05 2.707E-05 2.707E-05 4.4798E-09 5.7097E-07 1.6859E-08 2.3539E-08 3.3559E-09 3.3327E-06 4.8702E-09 0.00061497 0.00010526 0.00017529
150.4% 150.4% 150.4% 150.4% 510.8% 510.8% 510.8% 510.8% 510.8% 510.8% 510.8% 200.4% 201.7% 206.1%
lorry 21t, municipal waste collection
CH
1
unit
4.517E-07
110.0%
operation, maintenance, road road disposal, road
CH CH RER
1 1 1
ma ma ma
0.000641 0.000641 0.000641
110.0% 110.0% 110.0%
Inventoried exchanges for infrastructure of municipal waste collection lorry
Location
Infrastructure Process
Name
transport, municipal waste collection, lorry 21t
Location InfrastructureProcess Unit lorry 16t maintenance, lorry 16t disposal, lorry 16t
ecoinvent report No.13 – part I
StandardDeviation95% GSD2
Unit
Tab. 5.7
CH 0 tkm RER RER RER
1 1 1
unit unit unit
1.3 1 1.3
- 60 -
110.0% 201.3% 110.0%
6. Data Quality Considerations
6
Data Quality Considerations
6.1
The Pedigree approach
Within the ecoinvent 2000 project each LCI figure in the database is given a measure of uncertainty. This measure is given either as a standard deviation (for normal distribution), as a geometric standard deviation (GSD2, for lognormal distribution), as a range with minimal and maximal values (for triangular and rectangular distributions). The lognormal distribution is the default distribution type. Often in LCI, the collected data is too sparse to conduct proper uncertainty calculations. To obtain a measure of uncertainty a generic method to judge a particular data item was devised for the ecoinvent 2000 project. This so called 'Pedigree approach' is based on (Weidema & Wesnaes 1996). The Pedigree approach in ecoinvent 2000 is described in (Frischknecht et al. 2003a).
6.2
Mathematical Operations
In this project, calculation tools for inventories are created. These tools shall not only calculate mean values for inventories, but also the respective uncertainty data. This necessitates that mathematical operations for uncertainty data are known. At various places, uncertain values are involved in mathematical operations like addition or multiplication. For example, air emissions are derived from waste composition multiplied by the transfer coefficients. Or addition is used, e.g. for the combined transport distances of consumed auxiliary materials. It is necessary to know, how the geometric standard deviation GSD is calculated in such operations. Multiplication If lognormally distributed values are multiplied, the resulting distribution is strictly lognormal again and the GSD can be calculated exactly. If GSDi are the geometric standard deviations of log-normally distributed factors of a multiplication, the GSD of the resulting product GSDprod can be calculated from the following formula: Eq. 6.1
ln 2 (GSDprod ) = ∑ i ln 2 (GSDi )
and thus Eq. 6.2
GSDprod = e
∑ i ln 2 (GSDi )
The mean value of the product mprod is the usual product of all mean values of the factors mi. Eq. 6.3
m prod = ∏i mi
Addition If lognormally distributed values are added, the resulting distribution is not formally defined and the GSD cannot be calculated with a general and exact formula. However, approximations are known that calculate a GSD based on the assumption, that the resulting sum is lognormally distributed again. If mi are the (geometric) mean values of the lognormally distributed summands and GSDi are the corresponding geometric standard deviations, the GSD of the sum GSDsum can be calculated according to the Wilkinson-Fenton approximation (Fenton 1960):
ecoinvent report No.13 – part I
- 61 -
6. Data Quality Considerations
av sum +1 am sum
Eq. 6.4
GSDsum = e
Eq. 6.5
amsum = ∑i mi ⋅ e ln
Eq. 6.6
av sum = ∑i ami ⋅ e
Eq. 6.7
ami = mi ⋅ e ln
(GSD of the sum)
where
(
2
2
(GSDi ) 2
ln 2 (GSD i )
( GSDi ) 2
(Arithmetic mean of the sum)
) (Arithmetic variance of the sum)
−1
(Arithmetic mean of summand i)
After Wilkinson's approximation, the proper mean value of the sum should be derived from the arithmetic mean of the sum amsum and GSDsum using the formula: Eq. 6.8
msum = amsum e ln
2
( GSDsum ) 2
An 'improper' way – improper within the Wilkinson-Fenton approximation – to calculate the mean value of the sum would be to use the simple sum of the mean values: Eq. 6.9
msum = ∑i mi
The 'proper' mean in Eq. 6.8 is not equal to the the 'improper' simple sum in Eq. 6.9. The discrepancy is usually small, especially if small values are added to large values. The difference can become significant, if the summands all have the same order of magnitude and have larger uncertainties associated with them. For an LCI this is quite a disturbing fact. It means that a sum of inventoried figures can increase merely by the decision that the summands have a lognormal and not a normal distribution (in the case of normal distribution the simple sum as in Eq. 6.9 would be the correct value for the mean of the sum). In other words the 'proper' Wilkinson-Fenton mean in Eq. 6.8 violates mass balance considerations. For example in the MSWI three outputs are joined and landfilled as residual material (boiler ash, precipitator ash and scrubber sludge). To calculate the GSD of the resulting sum of elements the Wilkinson-Fenton approximation is used (Eq. 6.4 – Eq. 6.7). If, for example, the 'proper' formula according to Wilkinson-Fenton (Eq. 6.8) were used for the mean value of the sum, the masses of mercury and cadmium in the combined residual waste would increase by 25% compared to the simple sum (Eq. 6.9). Accordingly, using the 'proper' formula Eq. 6.8 would suggest that mass balances of the MSWI violate the principle of mass conservation. This seems nonsensical. Hence, in order to inventory massconserving mean values also for sums I choose to deviate from the Wilkinson-Fenton approximation in this study and use the 'improper' simple sum (Eq. 6.9) for the mean value of the sum. Division No exact or approximate formula for the calculation of GSD values of divisions of lognormally distributed values is available. A very coarse method to derive a uncertainty estimate for divisions is developed here. Let's consider a division of two lognormally distributed values A and B with mean values mA and mB. The upper confidence value of A is uA = mA*GSDA2. The lower confidence value of B is lB = mB/GSDB2. An upper confidence value of the result C =(A/B) could be estimated to be uC = uA / lB.
ecoinvent report No.13 – part I
- 62 -
6. Data Quality Considerations
Assuming that the result C is still lognormally distributed48, the upper confidence value of C can be used to calculate the GSD of C, since uC = mC*GSDC2. Thus, Eq. 6.10 GSDC = uC mC And with uC = uA / lB = (mA*GSDA2*GSDB2 / mB ) and mC =(mA / mB) Eq. 6.11
GSDC =
(mA ⋅GSDA 2 ⋅ GSDB 2 ) mB ⋅ = GSDA ⋅ GSDB mB mA
The formula suggests that the GSD of the result is the simple product of the GSDs of the two constituting terms. This makes sense. Assuming that GSDB is 100%, the GSDC is exactly equal to GSDA. The division with a certain figure (GSDB = 100%) is merely a shrinking of the scale for A in the probability distribution graph. The GSDA, which is a relative measure for the uncertainty of A, is unaffected by this mere 'change of scale', i.e. GSDC = GSDA. Also for a certain A (GSDA = 100%) and uncertain B, the formula makes sense49. The formula increases quickly for large GSD values. This is an effect of combining the upper confidence value of A with the lower confidence value of B50. Subtraction No exact or approximate formula for the calculation of GSD values of subtractions of lognormally distributed values is available. A very coarse method to derive an uncertainty estimate for differences is developed here. Let's consider a difference of two lognormally distributed values A and B with mean values mA and mB. The upper confidence value of A is uA = mA*GSDA2. An upper confidence value of the result C =(A-B) could be estimated to be uC = uA – mB, if B has no uncertainty. Assuming that the result C is still lognormally distributed51, the upper confidence value of C can be used to calculate the GSD of C, since uC = mC*GSDC2. Thus, Eq. 6.12 GSDC =
uC mC
And with uC = uA – mB = mA*GSDA2 – mB and mC =(mA – mB) Eq. 6.13
GSDC = (mA ⋅GSDA 2 − mB ) (mA − mB )
This formula features some characteristics which are correct for uncertainties of differences. The formula results in greatly enlarged GSD values for the result C, if A is close to B, i.e. if C is the relatively small difference of two large values. On the other hand if B=0 the GSDC for the result C is accurately equal to GSDA (see Fig. 6.1).
48
Generally, this is not likely, since dividing by a lognormally distributed and hence left-slanted distribution B will result in a right-slanted distribution for C, which will no longer be lognormally distributed.
49
However the same two corollary points also hold for an unused ad hoc formula GSDC = GSDA + (GSDB-1).
50
Combining these two values results in a uncertainty range which is larger than the usual 95%-probability range.
51
Generally, this is not likely, since subtracting a lognormally distributed and hence left-slanted distribution B with large uncertainty will result in a right-slanted distribution for C, which will no longer be lognormally distributed.
ecoinvent report No.13 – part I
- 63 -
6. Data Quality Considerations
Fig. 6.1
GSDC for the difference C = (A–B) for A=250 and different values of B (with GSDA = GSDB = 1.50). Note how the GSDC increases if C is small, i.e. when C is the difference of two large numbers
There would be other ways of estimating a GSDC value. For example, the uC could be estimated from the difference of the mean value of A minus the lower value for B (i.e. uC = mA – mB/GSDB2). Several other possibilities exist, which seem a priori equally reasonable. Numerical testing for different values of mA, mB, GSDA, and GSDB however showed that the approach in Eq. 6.13 gives reasonable results, especially regarding following general prerequisites: 1. GSDC is always larger than GSDA, which is reasonable, as the GSD is a measure of relative uncertainty (i.e. not an absolute measure. It relates to the mean value). The relative uncertainty GSDC must be larger than GSDA, since the mean of C is smaller than the mean of A. 2. Granted that mC = (mA-mB) is positive, the term in the square root is never negative even for extreme values of mA, mB, and GSDA, Otherwise, this would result in nonsensical imaginary numbers. Other approaches do not fulfil these two prerequisites and are therefore not suitable as a general formula. As a disadvantage, the approach in Eq. 6.13 does not include the uncertainty of B, i.e. GSDB is not used at all. This is equal to assuming that B has no uncertainty, which will usually not be the case. The uncertainty of C will be even larger if A and B are uncertain. So the Eq. 6.13 calculates a lax estimate for GSDC. Attempts to include GSDB in the formula for GSDC failed to fulfil the two general prerequisites noted above. Within this study, subtraction is only used in heat balance and waste heat calculations. So this approximation is not applied in essential parts of the LCI, like for pollutants.
ecoinvent report No.13 – part I
- 64 -
6. Data Quality Considerations
Abbreviations APME
Association of Plastics Manufacturers in Europe
BOD
Biological oxygen demand (German 'Biologischer Sauerstoffbedarf, BSB'). A measure for the content of readily degradable hydrocarbons. Equates to the amount of oxygen taken up in microbial decomposition of hydrocarbons – usually in dark incubation at 20°C and over 5 days (BOD5). Given as mass of absorbed oxygen (O2). Usually smaller than COD.
COD
Chemical oxygen demand (German 'Chemischer Sauerstoffbedarf, CSB'). A measure for the total content of degradable hydrocarbons. Equates to the amount of oxygen taken up in oxidation of hydrocarbons using a oxidation agent like potassium permanganate KMnO4 or potassium dichromate K2Cr2O7. Given as mass of absorbed oxygen (O2). Usually larger than BOD.
DOC
Dissolved organic carbon. Given as mass of carbon (Corg). Smaller or equal than TOC (exludes organic carbon in undissolved solids and particulates).
EDC
1,2-ethylene dichloride, CH2Cl-CH2Cl.
GSD
(also SDg) Geometric Standard Deviation. Uncertainty measure for lognormally distributed values. The GSD cannot be smaller than 1 (i.e. 100%). The squared GSD value (GSD2) can be used to calculate 95% confidence intervals around the mean. More information on the uncertainty calculations in ecoinvent 2000 can be found in chapter 1.2.3 'Uncertainty values GSD and GSD2' on page 4 and the methodology report (Frischknecht et al. 2003a).
MSWI
Municipal Solid Waste Incinerator (Swiss expression: KVA Kehrichtverbrennungsanlage, German expression: MVA Müllverbrennungsanlage)
PGM
platinum group metals (platinum, palladium, rhodium)
PM
particulate matter (air emissions), usually given as PM2.5 and PM10, aerodynamic crosssection


![Product Life cycle. Product life cycle and the Product Life Cycle Curve [PLC]](https://kipdf.com/img/300x300/product-life-cycle-product-life-cycle-and-the-prod_5ac29f511723dd94208541f2.jpg)