Presented at Workshop on Life Cycle Assessment Research in Indonesia, Puspiptek-Serpong, 24-25 November 2015. Available in http://www.ilcan.or.id Copyright @ the respective author(s).
Life Cycle GHG Emission and Energy Consumption of Biodiesel Production From Crude Palm Oil in Aceh Province by :
Kiman Siregar1*, Syafriandi2, Andriani Lubis3, Armansyah H.Tambunan4 1,2,3Agricultural
Engineering of Dept., Syiah Kuala University (Unsyiah), Banda Aceh and Biosystem of Dept., Bogor Agricultural University (IPB), Bogor *Corresponding author :
[email protected]
4Mechanical
1Founding
member of ILCAN (Indonesian Life Cycle Assessment Network)
www.ilcan.or.id
@Workshop on LCA Research In Indonesia- Puspitek, Nop 24-25 2015, Serpong
Presented at Workshop on Life Cycle Assessment Research in Indonesia, Puspiptek-Serpong, 24-25 November 2015. Available in http://www.ilcan.or.id Copyright @ the respective author(s).
OUTLINE :
1. Introduction 2. Methodology
3. Result and Discussion 4. Conclusion
5. Acknowledgement
2
Presented at Workshop on Life Cycle Assessment Research in Indonesia, Puspiptek-Serpong, 24-25 November 2015. Available in http://www.ilcan.or.id Copyright @ the respective author(s).
CHAPTER 1. INTRODUCTION Some Issues On Energy Development In Indonesia : Energy sector plays an important role for Indonesia in achieving its economic development goal Fossil fuels demand increase, while their reserve decrease by year, Indonesia is still heavily dependent on fossil based energy, which is accounted for more than 90% of its energy mix (including oil, gas and coal) Imbalance between average fossil fuel demand increasing and supply of energy per year, Renewable energy have been underutilized
BIOENERGY = ONE OF SOLUTIONS ?
Biofuel target 5% by 2025 from the national energy mix.
Presented at Workshop on Life Cycle Assessment Research in Indonesia, Puspiptek-Serpong, 24-25 November 2015. Available in http://www.ilcan.or.id Copyright @ the respective author(s).
World vegetable oil consumption
Vegetables oil producer
(2011) Sources: www.soystat.com
Bogor Agricultural University
Sources: www.oil world.de
Presented at Workshop on Life Cycle Assessment Research in Indonesia, Puspiptek-Serpong, 24-25 November 2015. Available in http://www.ilcan.or.id Copyright @ the respective author(s).
Importers of palm oil
Palm oil production 90
Indonesia
Malaysia
World
80 70 M Ton
60 50 40 30 20 10 0 1995 2000 2005 2009 2010 2015 2020 Source : Oil World (2010) and IPOA (2011)
Bogor Agricultural University
Sources: RSPO
Presented at Workshop on Life Cycle Assessment Research in Indonesia, Puspiptek-Serpong, 24-25 November 2015. Available in http://www.ilcan.or.id Copyright @ the respective author(s).
INDONESIA BIODIESEL PRODUCTION 2009 - 2013
(*as of April’ 2013)
Sources: ESDM, 2013
Bogor Agricultural University
Presented at Workshop on Life Cycle Assessment Research in Indonesia, Puspiptek-Serpong, 24-25 November 2015. Available in http://www.ilcan.or.id Copyright @ the respective author(s).
Top 10 Producers of Biodiesel in the world
Source US Energy Information Administration (2011) in Pehnelt et al. (2012)
Although a few facilities for esterification/biodiesel production have been established in the countries of origin in South-East Asia, the process of esterification usually takes place in facilities in the importing countries. Note that the first country that grows oil palms in a significant manner, Thailand, ranks 6th, far behind countries in Europe and America. The actual biodiesel production of Malaysia, as the second largest producer of crude palm oil in the world, significantly falls behind those on top of the list. Indonesia, the world’s largest palm oil producer, does not even appear on this list.
Presented at Workshop on Life Cycle Assessment Research in Indonesia, Puspiptek-Serpong, 24-25 November 2015. Available in http://www.ilcan.or.id Copyright @ the respective author(s).
EPA Issues Notice of Data Availability Concerning Renewable Fuels Produced from Palm Oil Under the RFS Program “The U.S. Environmental Protection Agency (EPA) is issuing a Notice of Data Availability (NODA) to release its lifecycle greenhouse gas (GHG) analysis of palm oil used as a feedstock to produce biodiesel and renewable diesel under the Renewable Fuel Standard (RFS) program. The release of the NODA provides the public an opportunity to comment on EPA’s analysis” “EPA’s analysis shows that biodiesel and renewable diesel produced from palm oil do not meet the minimum 20% lifecycle GHG reduction threshold needed to qualify as renewable fuel under the RFS program” Pathway Determinations “EPA’s analysis found that biodiesel and renewable diesel produced from palm oil have estimated lifecycle GHG emissions reductions of 17% and 11%, respectively, compared to the baseline petroleum diesel fuel they replace. These biofuels therefore fail to meet the minimum 20% GHG emissions reduction threshold required by EISA for renewable fuel made in facilities that commenced construction after December 19, 2007”
Presented at Workshop on Life Cycle Assessment Research in Indonesia, Puspiptek-Serpong, 24-25 November 2015. Available in http://www.ilcan.or.id Copyright @ the respective author(s).
Global Issues US EPA-NODA states that palm oil based biodiesel can only reduce GWP emission by 17% compared to fossil-fuel based EU introduced RED, threshold 35% emission saving, palm biodiesel only 19%
Trade policies US Sustainnability Criterion
EU Sustainnability Criterion
Requires a 20% reduction in GHG emmision from conventional sources
Biofules or feedstocks cannot come from land with high biodiversity status as of 2008
Advanced biofuels must have 50% reduction in GHG emmision
Biofuels must have a GHG savings of at least 35% (rising to 50% in 2017 and 60% for new facilities starting after 2016)
This condition could make barrier to Indonesia as one of the world’s largest CPO producer
Presented at Workshop on Life Cycle Assessment Research in Indonesia, Puspiptek-Serpong, 24-25 November 2015. Available in http://www.ilcan.or.id Copyright @ the respective author(s).
LCI database related to LCA agri-food Type of database
Country
Institution
Denmark France Japan Switzerland USA
DIAS (Aarhus University) INRA NARO ART USDA
LCI database
LCA Food Agri-BALYSE Agricultural JALCA (NARO LCI) SALCA LCI Digital Commons database World Food LCA World ART, Quantis Database Australia ALCAS AusLCI Germany PE GaBi Databases LCI Japan AIST (JEMAI) IDEA (MiLCA) database Malaysia National Project MY-LCID with Netherlands University of Amsterdam IVAM LCA Data agricultural Switzerland ecoinvent Center ecoinvent production Switzerland ESU-services ESU database processes Thailand National Project Thai National LCI USA NREL USLCI
Format/Software SimaPro ILCD SimaPro (EcoSpold) TEAM, SimaPro EcoSpold EcoSpold n.a. GaBi Special format ILCD SimaPro EcoSpold EcoSpold EcoSpold
Indonesia hasn't done nationally, but some researchers have already done it
Presented at Workshop on Life Cycle Assessment Research in Indonesia, Puspiptek-Serpong, 24-25 November 2015. Available in http://www.ilcan.or.id Copyright @ the respective author(s).
WHAT LCA IS ? The Life Cycle Assessment (LCA) is compilation and evaluation of the inputs, outputs and the potential environmental impacts of a product system throughout its life cycle (ISO 14044:2006)
FOUR STAGES INVOLVED IN LCA : (1) Goal & Scope definition (ISO 14041) -The objective of LCA application - The background of the research - The consumer
(2) Life Cycle Inventory (ISO 14041) -
Data collection Data validation Data processing to thr procession unit AlLocation and release
(3) Life Cycle Impact Assessment (ISO 14042) - Category impact selection - Characterization
(4) Interpretation (ISO 14043)
Identification on significant issue Evaluatin through : - Completeness check - Sensitivity check - Consistency check - Other check
Conclusion Recomendation Report
Presented at Workshop on Life Cycle Assessment Research in Indonesia, Puspiptek-Serpong, 24-25 November 2015. Available in http://www.ilcan.or.id Copyright @ the respective author(s).
INTRODUCTION Two important issues of biodiesel from oil palm plantation development : (1) Global warming (2) Energy security Global warming issue can be analyzed by Life Cycle Assessment (LCA) LCA can be used to ensure that environmental impact has been considered in decision making The result of LCA is highly influenced by the reliability and sufficiency of data inventory of the assessed objects
Accessibility of data for LCA in Aceh Province and Indonesia still very limited and need to be improved Crude Palm oil (CPO) is the main biodiesel feedstock in Indonesia
Presented at Workshop on Life Cycle Assessment Research in Indonesia, Puspiptek-Serpong, 24-25 November 2015. Available in http://www.ilcan.or.id Copyright @ the respective author(s).
INTRODUCTION The following questions have been formulated from the previous problem in systematic and structured study to provide good result : 1. What is the emission distribution for planting, harvesting and postharvesting of palm oil based biodiesel? Which stage has significant effect? What kind of material input is the most siqnificant increasing the GHG emission value? 2. How are the energy consumption, net energy balance, net energy ratio, and renewable index of biodiesel production from crude palm oil? 3. How potential in reducing GHG emission generated from crude palm oil based biodiesel compared to diesel-fuel? It is expected that the research could give solution and describe the GHG emission and energy consumption for further development of biodiesel processing.
Presented at Workshop on Life Cycle Assessment Research in Indonesia, Puspiptek-Serpong, 24-25 November 2015. Available in http://www.ilcan.or.id Copyright @ the respective author(s).
Riset Fundamental Ditjen Dikti (2 Tahun) Kajian Perubahan Metode Analisa Life Cycle Assessment (LCA) Menjadi Exergetic Life Cycle Assessment (ELCA) Pada Produksi Biodiesel Secara Katalis Dari Bahan Baku Kelapa Sawit
Dibiayai oleh Direktorat Penelitian Pengabdian kepada Masyarkat, Direktorat Jenderal Pendidikan Tinggi, Kementerian Pendidikan dan Kebudayaan, sesuai dengan Surat Perjanjian Penugasan Pelaksanaan Hibah Penelitian bagi Dosen Perguruan Tinggi Batch-I Universitas Syiah Kuala Tahun Anggaran 2015 : 035/SP2H/PL/Dit.Litabmas/II/2015 tanggal 5 Pebruari 2015
Presented at Workshop on Life Cycle Assessment Research in Indonesia, Puspiptek-Serpong, 24-25 November 2015. Available in http://www.ilcan.or.id Copyright @ the respective author(s).
OBJECTIVE
The objective of this study is to analysis of life cycle assessment of biodiesel production using catalyst from Crude Palm Oil (CPO) in Aceh Province
Presented at Workshop on Life Cycle Assessment Research in Indonesia, Puspiptek-Serpong, 24-25 November 2015. Available in http://www.ilcan.or.id Copyright @ the respective author(s).
METHODOLOGY
1.Goal and Scope Definition
(Es)
planting
T
mass, energy (Es)
fertilizing mass, energy
(Es)
protection
pesticides & herbicides
seedling
transportation (T)
seed
to be planted
(Es)
plant ready to harvest
T
land preparation
mass, energy (Es)
fertilizer
mass, energy
mass, energy
mass, energy
emission (Es)
harvesting
T
FFB
mass, energy
palm oil mills
mass, energy (Es)
(Es)
T
biodiesel CPO plant 1 ton BDF
kernel Shell, EFB
shell empty fruit bunches (EFB) fibers
cradle to gate for oil palm
Boundary of research
The objective of LCA applications is to assess the life cycle from cradle to gate of biodiesel production using CPO under catalytic process. Overall, this research is expected to result: global warming potential, acidification, eutrophication, waste landfill volume, energy consumption, and energy ratio, the amount of emissions to air, water and soil.
Presented at Workshop on Life Cycle Assessment Research in Indonesia, Puspiptek-Serpong, 24-25 November 2015. Available in http://www.ilcan.or.id Copyright @ the respective author(s).
METHODOLOGY Research boundary 1. 2. 3. 4. 5. 6. 7. 8.
Land preparation Seedling Planting Fertilizing Protection Harvesting Palm oil mills Biodiesel production
Presented at Workshop on Life Cycle Assessment Research in Indonesia, Puspiptek-Serpong, 24-25 November 2015. Available in http://www.ilcan.or.id Copyright @ the respective author(s).
Life Cycle Impact Assesment (LCIA) 1. Environmental Impact LCIA was conducted using the software released by MiLCA-JEMAI
ver.1.1.2.50
Point of interest for environmental impacts in this study : 1. Global warming potential (GWP), 100-year, IPCC,2007 (kg-CO2eq.) 2. Acidification, DAF, LIME 2006 (kg-SO2eq.) 3.Waste, landfill volume, LIME 2006 (m3) 4.Eutrophication, EPMC, LIME 2006 (kg-PO4eq.)
2. Energy consumption, NEB, NER, & RI
Net Energy Balance ( NEB) Energioutput Energiproses Energyoutput Net Energy Ratio ( NER) Energyinput Re newable Index( RI )
Energirenewable 1 Energiproses
Presented at Workshop on Life Cycle Assessment Research in Indonesia, Puspiptek-Serpong, 24-25 November 2015. Available in http://www.ilcan.or.id Copyright @ the respective author(s).
METHODOLOGY Data Source 1.Primary data Data for oil palm plantation, harvesting and palm oil mills were collected from PTPN 1 Lhoksukon-Aceh Timur, and private company national in
Aceh Province, i.e.: PT.SPS 1 and 2 in Nagan Raya, PT.Soxfindo in Nagan Raya, PT.Kurnia Tanah Subur in Meulaboh, PT.PKS in Biureun, and oil palm plantation from people, i.e.: Kabupaten Nagan Raya, Kabupaten Aceh Barat, Kabupaten Aceh Timur, Kabupaten Biureun, dan Kabupaten Lhokseumawe. So used data primer from PTPN VIII Unit Kebun Kertajaya Lebak Banten Catalytic transesterification experiment was conducted in a facility owned by Agency for Technology Assessment and Application of Indonesia
(Capacity = 1 ton BDF/day) Electricity Indonesia data (Statistics PLN 2013) 2. Secondary data Scientific journal, research report published by research institutions as follow ; Syiah Kuala University, Bogor Agricultural University, Institute of Technology Bandung, Indonesian Oil Palm Research Institute, private
company with core business in CPO and biodiesel processing
Presented at Workshop on Life Cycle Assessment Research in Indonesia, Puspiptek-Serpong, 24-25 November 2015. Available in http://www.ilcan.or.id Copyright @ the respective author(s).
Restrictions and the assumption of this research Scenario 1 1. The functional unit (FU) of this study is 1 ton of Bio Diesel Fuel (BDF) 2. To produced 1 ton BDF from CPO required plantation area : 0.246 ha for oil palm. 3. Inluding transportation from seedling to plantation area and from plantation to palm oil mills and from palm oil mills to biodiesel plant.
4. Oil palm will start to produce at the age of 30 months, but the production will be stable after 5 years. 5. Productivity of oil palm used in this research is 21 tonnes per ha, eventhough the productivity range from 12 tonnes per ha by farmers to 30 tonnes per ha by private plantation
Presented at Workshop on Life Cycle Assessment Research in Indonesia, Puspiptek-Serpong, 24-25 November 2015. Available in http://www.ilcan.or.id Copyright @ the respective author(s).
Restrictions and the assumption of this research 7. Life cycle of oil palm is about 25 years. 8. Calculation divided in two stages : before stable productivity (1-5 years), after stable productivuty (6-25 years)
9. Palm oil mills assumed have implemanted methane capture 10. Excluding land use change 11. Calculation of methanol only for methanol that reacted with the triglyceride
12. Impact evaluation was made and analyzed in 2 scenarios
Presented at Workshop on Life Cycle Assessment Research in Indonesia, Puspiptek-Serpong, 24-25 November 2015. Available in http://www.ilcan.or.id Copyright @ the respective author(s).
Restrictions and the assumption of this research • Scenario 1 : Using primary data from PTPN 1 LhoksukonAceh Timur, and private company national in Aceh Propince, i.e.: PT.SPS 1 and 2 in Nagan Raya, PT.Soxfindo in Nagan Raya, PT.Kurnia Tanah Subur in Meulaboh, PT.PKS in Biureun, and oil palm plantation from people, , i.e.: Kabupaten Nagan Raya, Kabupaten Aceh Barat, Kabupaten Aceh Timur, Kabupaten Biureun, dan Kabupaten Lhoksemumawe. So used data primer from PTPN VIII Unit Kebun Kertajaya Lebak Banten • Scenario 2 : The same data but the calculation was conducted before stable production (1-5 years), and did not calculate the transportation to transport material used from the store to the location of the material used.
Presented at Workshop on Life Cycle Assessment Research in Indonesia, Puspiptek-Serpong, 24-25 November 2015. Available in http://www.ilcan.or.id Copyright @ the respective author(s).
RESULT AND DISCUSSION : 2. Life Cycle Inventory (LCI) A composition of electricity Indonesia(Statistik PLN, 2013) A kind of a power plant and a source of fuel Percentage (%) Hydropower (PLTA) 7.23 Fossil fuel-HSD 22.46 Fossil fuel-IDO 0.03 Fossil fuel-MFO 6.83 Geothermal (PLTP) 2.44 Coal 38.5 Natural Gas 22.52% Solar power plant 0.0005
A composition of electricity Japan (Widiyanto et al. 2003) A kind of a power plant and a source of fuel Persentasi (%) Hydropower (PLTA) 9.6 Coal 18.4 Fossil fuel 9.2 Natural gas 26.4 Nuclear 34.3 Others 2.1
ophication (per kWh) Energy consumption (per kWh) GWP (per kWh) Acidification (per kWh) Waste (per kWh) Jenis Jenis Energy Eutrophication Jenis Jenis Jenis GWP Acidification Consm.(MJ) Pembangkit Pembangkit kg-PO e Urut 4 Urut Pembangkit Urut Urut Pembangkit kg-SO e Pembangkit kg-CO e 2
2
Eutrophication (per kWh) Energy consumption (per kWh) Waste Jenis Jenis Energy Eutrophication 3 Urut m Pembangkit kg-PO4e Urut Pembangkit Consm.(MJ)
Nuclear
3.9E-07 1 fuel-IDO Geothermal 0.337 1 Fossil 0.003 10.062 1 Hydropower 2.8E-06 1 Nuclear 3.9E-07 1 Eutrophication (per kWh) Energy consumption (per kWh) 2.4E-07 2 Nuclear 0.308 2 Natural gas 0.0004 27.535 Nuclear 2.2E-06 2 Geothermal 2.4E-07 2 3 Fossil fuel-HSD 5.40E-08 0.287 3 Coal3 Hydropower 0.0002 Eutrophication 34.355 Geothermal 5.2E-08 Jenis 3 Hydropower Energy 5.40E-08 3 Hydropower 4 Fossil fuel-MFO 0.278 4 Fossil fuel-HSD 0.00016 4 Coal 1.2E-09 4 Coal 1.3E-10 4 Coal 1.3E-10 4 Fossil fuel-IDO kg-PO 3.9934e Pembangkit Consm.(MJ) Urut 5 Natural gas 0.186 5 Fossil 0.00014 53.842 Fossil fuel-MFO 1.4E-10 5 Fossil fuel-MFO 1.21E-12 5 Fossil fuel-MFO 1.21E-12 5 fuel-MFO Fossil fuel-MFO 6 Nuclear 0.039 6 Nuclear 0.00013 6 Fossil 3.9E-07 fuel-IDO 1.3E-10 6 Fossil fuel-IDO 1.10E-12 1 Hydropower 2.8E-06 Nuclear 1 Geothermal 10.0626 Fossil fuel-IDO 1.10E-12 6 1Fossil fuel-HSD 3.743 7 Hydropower 0.007 7 Hydropower 0.00006 7 Fossil fuel-HSD 1.2E-10 7 Fossil fuel-HSD 1.03E-12 7 2 Nuclear 2.2E-06 7 2Coal Geothermal 2.4E-07 2 Nuclear 7.535 Fossil fuel-HSD 8 Geothermal 1.03E-12 0.003 8 Geothermal 0.000005 83.616 Natural gas 0.0E+00 8 Natural gas 0.0E+00 8 Natural gas 0.0E+00 gas 3.545 3 Geothermal 5.2E-08 8 3Natural Hydropower 5.40E-08 3 Hydropower 4.355
1 Coal Waste (per kWh) Geothermal 2 Fossil fuel-IDO
4 Coal 5 Fossil fuel-MFO
1.2E-09 1.4E-10
4 Coal 5 Fossil fuel-MFO
1.3E-10 1.21E-12
4 Fossil fuel-IDO 5 Fossil fuel-MFO
3.993 3.842
Geothermal 10.062 Nuclear 7.535 Hydropower 4.355 Fossil fuel-IDO 3.993 Fossil fuel-MFO 3.842 Fossil fuel-HSD 3.743 Coal 3.616 Natural gas 3.545
Presented at Workshop on Life Cycle Assessment Research in Indonesia, Puspiptek-Serpong, 24-25 November 2015. Available in http://www.ilcan.or.id Copyright @ the respective author(s).
RESULT AND DISCUSSION : 2. Life Cycle Inventory (LCI) Materials and energy used at each activity to produce 1 ton BDF Input activities (1) Land preparation (2) Seedling
Input names Herbicide Diesel fuel for toppling & clearing
Fungicides Insecticides Chemical fertilizer Urea 0.2 %
Organic fertilizer Kieserite (MgSO4) Urea Herbicide Dolomite Compound fertilizer Electricity for Pump Water Pesticides Transportation Diesel fuel for truck 5 ton (3) Planting TSP/SP36 Organic fertilizer Rock Phosphate KCl (4) Fertilizing Compound fertilizer for five years Rock Phosphate ZA/Urea HGF Borate TSP/SP36 MOP (K)/KCl Kieserit HGF Borate Organic fertilizer
Oil Jatropha Unit Palm curcas kg 0.861 0.624 L 0.703 1.208 kg 0.852 kg 0.00018 0.0057 kg 0.00492 kg 8.367 9.377 kg 2.008 kg 0.00007 kg 0.974 kg 2.949 kg 4.686 kWh 0.436 kg 0.004 L 1.004 1.189 kg 13.387 79.562 kg - 994.524 kg 22.887 15.912 kg 9.844 kg 252.492 kg 279.464 87.518 kg 3.347 kg 117.140 278.467 kg 245.995 95.474 kg 184.078 kg 3.347 kg - 994.524
Oil palm land preparation uses more pesticides, diesel fuel is used for machinerry (tractor)
Oil palm seedlings takes longer time (about 12 months), hence oil palm need more materials and energy At this sub process of planting, need a little chemical fertilizer to oil palms. And there are number of plants per hectare for oil palms is 136 trees At this sub process of fertilizing : need more the materials and energy utilization for oil palms and this is a fact of due to inheritance nature of oil palms
Presented at Workshop on Life Cycle Assessment Research in Indonesia, Puspiptek-Serpong, 24-25 November 2015. Available in http://www.ilcan.or.id Copyright @ the respective author(s).
RESULT AND DISCUSSION : 2. Life Cycle Inventory (LCI) Materials and energy used at each activity to produce 1 ton BDF Input activities Input names (5) Protection Herbicide for five years Insecticides (liquid & powder) Pesticides Diesel for power sprayer & fogging
Unit kg kg kg L
Oil Jatropha At this sub process of protection Palm curcas 56.317 : need more the materials and 1.323 energy utilization for oil palms 0.801 2.955 0.554 -
Diesel fuel for truck 10 ton Electricity Steam consumption Water consumption PAC Flokulon NaOH H2SO4/HCl Tanin Consentrate Poly Perse BWT 302 Alkaly BWT 402 Shell consumption Transportation Diesel fuel for truck 10 ton (8) Biodiesel Methanol H2SO4 production Esterification Electricity TransMethanol esterification Electricity NaOH Water consumption Diesel fuel for Boiler
L kWh kg 3 m kg kg kg kg kg kg kg kg L ton ton kWh ton kWh ton L L
5.027 34.39 1325.40 3.968 0.125 0.00053 0.107 In the 0.109 - case of palm oil mills, need 0.045 - materials and energy more 0.045 0.043 At - the stage of biodesel 133.862 production sub-process, due to 2.540 1.890 0.449 average value of free fatty high 0.027 acids 1.285 (FFA) on Crude Palm Oil, it 0.269 needs esterification stage before 15.645 15.645 trans-esterification. Consequently, 0.080 0.080 1700.68 1719.180 needs more materials and energy 14.00 16.00
(6) Harvesting Transportation (7) Palm oil mills vs Oil extraction
At the stage of harvesting sub2.468 process, the transport energy 14.833 use -for oil palms. The yield of oil palms is abou 21 ton per hectars per year -
Presented at Workshop on Life Cycle Assessment Research in Indonesia, Puspiptek-Serpong, 24-25 November 2015. Available in http://www.ilcan.or.id Copyright @ the respective author(s).
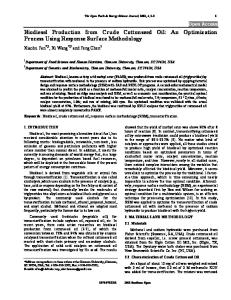
RESULT AND DISCUSSION : 3. Life Cycle Impact Assessment Calculation for GWP of plants for the first 5 years of each sub-processes Scenario 1
Scenario 2
100-year GWP (IPCC,2007) of Palm Oil
1600
Land preparation Seedling
902.9
900
kg-CO2 eq./ton BDF
800
602.1
700
Planting
588.3
600
Fertilizing
500 Protection
393.4
400
Harvesting
300 200 100
23.5 11.2
31.7
15.7
0 Global Warming Potential
Palm oil mills Biodiesel production
Land preparation
1,408 1400
Seedling
kg-CO2eq./ton BDF
1000
1200 Planting
1000 Fertilizing
800 580.40
600
Protection Harvesting
400 159.35
200 15.52 29.14 11.71
94.39 1.73
0
GHG Emission
Palm oil mills Biodiesel production
The GWP value for LCA oil palms is higher at fertilizing sub-process and biodiesel production stages both at scenario 1 and scenario 2 The most significant environmental impact based on GWP value is caused by fertilizing and biodiesel production stages for scenario 1 and scenario 2
Presented at Workshop on Life Cycle Assessment Research in Indonesia, Puspiptek-Serpong, 24-25 November 2015. Available in http://www.ilcan.or.id Copyright @ the respective author(s).
RESULT AND DISCUSSION : 3. Life Cycle Impact Assessment On Scenario 1 The percentage of fertilizing sub-process and biodiesel production are 35.15% and 23.44%,respectively On Scenario 2 The percentage of fertilizing sub-process and biodiesel production are 61.21% and 25.23%,respectively
On Scenario 1 The percentation of proportion of each stage including pre-harvest, harvest and post-harvest is 52.42 %, 1.23 %, and 46.34 %, respectively On Scenario 2 The percentation of proportion of each stage including pre-harvest, harvest and post-harvest is 70.59 %, 0.08 %, and 29.34 %, respectively
Presented at Workshop on Life Cycle Assessment Research in Indonesia, Puspiptek-Serpong, 24-25 November 2015. Available in http://www.ilcan.or.id Copyright @ the respective author(s).
kg-CO2e/ton BDF
3. LIFE CYCLE IMPACT ASSESSMENT GWP, 100-year GWP(IPCC, 2007)
18000 16000 14000 12000 10000 8000 6000 4000 2000 0
1 2 3 4 5 6 7 8 9 10 11 12 13 14 15 16 17 18 19 20 21 22 23 24 25 Year of
before stable productivity : the average of GWP emission for oil palm is 2575.48 kg-CO2eq./ton-BDF_CPO (Scenario 1) before stable productivity : the average of GWP emission for oil palm is 2300.24 kg-CO2eq./ton-BDF_CPO (Scenario 2) after stable productivity : the average of GWP emission for oil palm is 1511.96 kg-CO2eq./ton-BDF_CPO (Scenario 1) after stable productivity : the average of GWP emission for oil palm is 1109.42 kg-CO2eq./ton-BDF_CPO (Scenario 2)
The declining trend also occurred in acidification, eutrophication and energy consumption
Presented at Workshop on Life Cycle Assessment Research in Indonesia, Puspiptek-Serpong, 24-25 November 2015. Available in http://www.ilcan.or.id Copyright @ the respective author(s).
3. LIFE CYCLE IMPACT ASSESSMENT (Scenario 1) 0.25
Eutropication, EPMC(LIME,2006)
Waste,landfill volume(LIME,2006) 0.001 0.001 kg-PO4e/ton BDF
m3/ton BDF
0.20 0.15
0.10 0.05
0.001
0.001 0.000
0.000
0.00
0.000
1 2 3 4 5 6 7 8 9 10 11 12 13 14 15 16 17 18 19 20 21 22 23 24 25 Year of Palm oil Jatropha curcas
14
1 2 3 4 5 6 7 8 9 10 11 12 13 14 15 16 17 18 19 20 21 22 23 24 25 Year of Palm oil Jatropha curcas
Energy consumption,HHV(fossil fuel)
Acidification, DAF(LIME,2006)
180000
160000 140000
10
MJ/ton BDF
kg-SO2e/ton BDF
12
8 6
120000
100000 80000 60000
4
40000
2
20000
0
0
1 2 3 4 5 6 7 8 9 10 11 12 13 14 15 16 17 18 19 20 21 22 23 24 25 Year of Palm oil Jatropha curcas
1 2 3 4 5 6 7 8 9 10 11 12 13 14 15 16 17 18 19 20 21 22 23 24 25 Year of Palm oil Jatropha curcas
Presented at Workshop on Life Cycle Assessment Research in Indonesia, Puspiptek-Serpong, 24-25 November 2015. Available in http://www.ilcan.or.id Copyright @ the respective author(s).
3. LIFE CYCLE IMPACT ASSESSMENT CO2eq. emission reduction vs conventional diesel fuel
• The emission reduction in CO2eq. emissions is higher at stable productivity due to lower input energy and mass which only used for maintenance, fertilizing and harvesting. The sub-processes of land preparation, seedling, and planting are not carried out in this phase • On scenario 1 The combination values of CO2eq.emission before and after stable production for biodiesel fuel from crude palm oil (BDF-CPO) is 37.83 %. • On scenario 2 The combination values of CO2eq. emission before and after stable production for crude palm oil (BDF-CPO) is 49.96 %.
Presented at Workshop on Life Cycle Assessment Research in Indonesia, Puspiptek-Serpong, 24-25 November 2015. Available in http://www.ilcan.or.id Copyright @ the respective author(s).
COMPARISON OF EMISSION AND ENERGY FOR BIODIESEL PRODUCTION FROM OIL PALM (Elaeis guineensis) AND JATROPHA CURCAS (Jatropha curcas L.) BASED ON LIFE CYCLE ASSESSMENT (LCA) IN INDONESIA Advisory Committee : Prof.Dr.Ir.Armansyah H.Tambunan Dr.Ir.Abdul K. Irwanto,M.Sc Dr.Ir.Soni S. Wirawan,M.Eng Dr.Tetsuya Araki The external assessor : Dr.Ir.Prastowo,M.Eng Dr.Ir.Dadan Kusdiana,M.Sc by : Kiman Siregar_F164090031 Doctoral Student of Agricultural Engineering Science @Open Examination of The Graduate School-IPB, Bogor, Sept 09 2013
Presented at Workshop on Life Cycle Assessment Research in Indonesia, Puspiptek-Serpong, 24-25 November 2015. Available in http://www.ilcan.or.id Copyright @ the respective author(s).
ENERGY ANALYSIS NEB, NER, RI
Energyinput Energyprocess Energyoutput Energyinput EnergyCPO EnergyMeOH EnergyNaOH Ein
E1
E2
Energyoutput Energybiodiesel Energyglyerol EnergyMeOH _ residual E
out
Eout _ t arg et
Eout _ residual
Energyinput EnergyCPO Energyoutput Energybiodiesel Energyglycerol
Energyproses Energyfosil Energyrenewable
E pr Energyfossil Energynon fossil Energyelectricity Energymechanical Energythermal Re newable Index( RI ) Net Energy Ratio ( NER)
Energyrenewable 1 Energyprocess
Energyoutput Energyinput
Net Energy Balance( NEB) Energyoutput Energyprocess
Presented at Workshop on Life Cycle Assessment Research in Indonesia, Puspiptek-Serpong, 24-25 November 2015. Available in http://www.ilcan.or.id Copyright @ the respective author(s).
ENERGY ANALYSIS : NEB, NER, RI Net Energy Balance (NEB)
Net Energy Ratio (NER)
200000
1.0420
150000
0 -50000 1 2 3 4 5 6 7 8 9 10 11 12 13 14 15 16 17 18 19 20 21 22 23 24 25
-100000
MJ/ton BDF
1.0415
50000
1.0410
1.0405
-150000 -200000
1.0400
-250000
-300000
1 2 3 4 5 6 7 8 9 10 11 12 13 14 15 16 17 18 19 20 21 22 23 24 25 Year of Oil palm Jatropha curcas
Year of Oil palm
Jatropha curcas
Renewable Index (RI) 0.450
0.400 MJ/ton BDF
MJ/ton BDF
100000
0.350 0.300
0.250 0.200 0.150
1 2 3 4 5 6 7 8 9 10 11 12 13 14 15 16 17 18 19 20 21 22 23 24 25 Year of Oil palm Jatropha curcas
Presented at Workshop on Life Cycle Assessment Research in Indonesia, Puspiptek-Serpong, 24-25 November 2015. Available in http://www.ilcan.or.id Copyright @ the respective author(s).
Energy Analysis of NEB, NER, RI for Scenario 4 Sources BDF-CPO
BDF-CJCO
Lam et al. (2009)
2.27
1.92
Yee et al. (2009)
3.53
Energy parameter NEB NER RI
NER
1.44
Scenario 2 Scenario 3 Oil palm Jatropha Oil palm Jatropha curcas curcas 408750.58 365350.47 146948.08 39334.79 2’97 0.80
1.98 0.41
BDF-Rapeseed
1.041 0.162
1.042 0.270
Scenario 4 Oil palm Jatropha curcas 155041.89 42649.83 1.041 0.06 0.45
1.042 0.116 0.74
• NER value for oil palm and Jatropha curcas i.e. 1.041 and 1.042, respectively. It turns that NER value appears to have constant value due to increased output value will increase the input value, although the NER value can reach higher value if the produced biomass energy is calculated as output energy. • The NER value of oil palm and Jathropa curcas is 2.97 and 1.98, respectively for Scenario 2. NER value of oil palm is higher as its produced biomass is higher than Jatropha curcas.
Presented at Workshop on Life Cycle Assessment Research in Indonesia, Puspiptek-Serpong, 24-25 November 2015. Available in http://www.ilcan.or.id Copyright @ the respective author(s).
Emission Reduction of CO2eq. Biodiesel vs Diesel Fossil For Scenario 3 before stable productivity
after stable productivity CO2 emissions reduction value of the fossil fuel After stable productivity
CO2 emissions reduction value of the fossil fuel Before stable productivity 10.07 % 24.251 % 3.400 reduction reduction
4.0
3.5
4.0
3.0
3.0
2.575
2.5
55.531 % menurun
2.5
kg-CO2/kg
kg-CO2/kg
3.400
3.5
3.058
2.0 1.5 1.0 0.5
2.0
1.512
1.5 1.0
0.381
0.5
0.0
0.0
Fuel source Diesel oil
BDF-Palm oil
Diesel oil
BDF-Jatropha curcas
CO2 emissions reduction value of the fossil fuel total productivity 4.0 3.400
3.5
kg-CO2/kg
Total life cycle
3.0 2.5
49.27 % reduction
2.0
1.725
1.5
73.06 % reduction 0.916
1.0 0.5 0.0
Fuel source Diesel oil
88.81 % menurun
BDF-Palm oil
BDF-Jatropha curcas
Fuel source BDF-Palm oil BDF-Jatropha curcas
Sheehan et al. (1998) : BDFsoybean can reduce CO2eq. of emission = 78.45% (B100), dan 15.66% (B20) vs fossil fuel US EPA NODA palm oil biodiesel = 17% EU-RED palm oil biodiesel = 19%
Presented at Workshop on Life Cycle Assessment Research in Indonesia, Puspiptek-Serpong, 24-25 November 2015. Available in http://www.ilcan.or.id Copyright @ the respective author(s).
INTERPRETATION Conclusion-Recomendation Conclusion The utilization of agro-chemical in form of fertilizer and plant protection generate significant contribution to environmental impact of biodiesel production from CPO , which is 50.46 % for scenario 1 and 68.14 % for scenario 2. The characteristics of GHG emission value before stable productivity is 2568.82 kg-CO2eq./ton-BDF-CPO for scenario 1 and 2300.24 kg-CO2eq./ton-BDF-CPO for scenario 2.
The GWP at the stable production is 1658.50 kg-CO2eq./ton-BDF_CPO and 1711.96 kg CO2eq.-/ton-BDF-CJCO for scenario 1 and scenario 2, respectively. Reduction in emission of CO2eq. when compared to diesel oil is 37.83 % for Scenario 1 and 49.96% for Scenario 2.
Recomendation Utilization of organic fertilizer is recommended instead of chemical fertilizer
Presented at Workshop on Life Cycle Assessment Research in Indonesia, Puspiptek-Serpong, 24-25 November 2015. Available in http://www.ilcan.or.id Copyright @ the respective author(s).
ACKNOWLEDGEMENT
This research was supported by DGHE, Ministry of Education and Culture of Indonesia, under Fundamental Research Scheme with Syiah Kuala University (No.035/SP2H/PL/Dit.Litabmas/II/2015, 15 February 2015).
Thank you very much to Prof.Dr.Ir.Armansyah H.Tambunan,M.Agr, Dr.Ir.Abdul Kohar,M.Sc, Dr.Ir.Soni Solistia Wirawan,M.Ec, and Prof.Tetsuya Araki,Ph.D
Presented at Workshop on Life Cycle Assessment Research in Indonesia, Puspiptek-Serpong, 24-25 November 2015. Available in http://www.ilcan.or.id Copyright @ the respective author(s).
Thank you for your attention... Contact person : Dr.Kiman Siregar Agricultural Engineering Department of Syiah Kuala University E-mail :
[email protected] Mobile phone :+628128395848
[email protected]; cell : 0812-8395848