Life Cycle Assessment of Film and Digital Imaging Product System Scenarios International Conference on Life Cycle Engineering, LCE2006 1
Bert Bras1, Jay Mathewson2, Michael C. Muir1 Georgia Institute of Technology, School of Mechanical Engineering, Atlanta, GA, USA 2 Eastman Kodak Company, Health, Safety & Environment, Rochester, NY, USA
Abstract With the advent of digital imaging technology, the options available in consumer imaging have increased. However, the relative environmental impacts of these different options are not clear cut. Assessment of the impacts of these options can help to provide feedback to decision makers and give insight that will help reduce environmental impact through product system design. In this paper, we present the use of Life Cycle Assessment to evaluate different product and service scenarios for both traditional film and digital imaging systems, and the results obtained for ten different consumer imaging scenarios. Results and implications for systems design and performance improvement are discussed. Keywords Life Cycle Assessment, Life Cycle Analysis, LCA, Photography
in computer display technologies [2], comparing different packaging scenarios for yogurt delivery [3], and in establishing a baseline for environmental performance of personal computers [4]. Internal studies at Kodak began in the nineties and covered a range of systems and products, many of which were leveraged for this study.
1 INTRODUCTION With the growing options in consumer photography, there are many different pathways to achieve the image capture, processing, and output functions. Not only are there different technologies to choose from, but there are also different instantiations of these technologies in the form of different business models. Traditional photography has utilized a hybrid product/service model, while digital options range from a similar product/service model to an entirely product-oriented model with home printers. Additionally, the scale of these systems can range from extremely high-volume wholesale processing and printing operations to retail photo minilabs and down to personal home printers. The relative environmental impacts of these different options are not clear cut. Simplistically, one might say that the use of a digital camera creates a reduced environmental burden than the use of a reloadable film camera because the image produced as a result of using the digital camera avoids chemicals in film developing. However, digital cameras require electronics and computers that need electricity. And electricity production is one of the contributors to greenhouse gasses, such as CO2. In the summer of 2003, Kodak and Georgia Tech began a partnership to explore the environmental impacts of the different imaging technologies and scenarios. Approaching this issue leads to many questions; a few were identified for further investigation. With such a variety of functionally equivalent product systems, the inevitable question is: “what are the differences in environmental impacts from these different pathways?” Assessing performance of a system naturally provides an opportunity to identify potential pathways for improvement. So, “what feedback regarding environmental impacts can be provided to designers from this study?” Finally, while assessing differences in functionally similar applied technologies can lead to improvements in both systems, assessing more general business strategies (i.e., product/service/hybrid) could provide insight that could be leveraged across technological and functional domains. In 2001, the International Standards Organization (ISO) published standards for Life Cycle Assessment (LCA) [1] as a tool for evaluation of environmental impacts. LCA has been used for a variety of applications in many different industries. These include assessing differences
2
STUDY STRUCTURE
2.1 Consumer options in photography Imaging processes can be divided into three stages: image capture, image processing, and image output. Image capture involves the operations required to store a particular image to an intermediate storage media. Image processing is the intermediate step required to prepare the captured image for printing. In traditional photography, this means film developing, fixing, and washing the film. The final stage in imaging is that of image output, reproducing the original captured image on the selected output media. Although these stages are clearly tied to traditional film imaging, parallels do exist in the newer digital processes. Capture and printing are clearly the same activities in both traditional and digital imaging; however, the lines where image processing begins and ends are a bit less defined. In this study, the digital image processing stage was defined to be the transfer of an image from a digital camera to a PC and then to the printer. The table below provides the stages covered for this study. Stage Capture
Process Film Digital Processing Retail Wholesale Digital PC/CRT Digital PC/LCD Output Retail Wholesale Digital PC/CRT Inkjet Digital PC/LCD Inkjet Digital PC/CRT Display Digital PC/LCD Display Table 1: Imaging stages
549
Abbr. FC DC RFP WFP CRTP LCDP RP WP CRTIO LCDIO CRTD LCDD
These twelve different imaging stage process models were combined to create ten different consumer-imaging scenarios. Each of the twelve imaging stage process models is a combination of one or more LCA modules. Each LCA module represents a product and/or service system that helps to achieve one or more of the imaging stages. In image capture, two distinct product systems were assessed. The traditional film-capture system involved a reloadable flash-film camera. The digital capture system assessed was a typical midrange digital camera with flash. In the image processing stage, retail and wholesale film processing were modelled for the traditional side. Digital processing includes processing via a personal computer with either an LCD monitor or CRT monitor. For the image output stage, retail and wholesale printing fill out the traditional side while digital output includes inkjet printing and display with an LCD or a CRT computer monitor. The study was undertaken from a functional capability point of view, and actual usage habits (especially with respect to the digital side) would significantly change the results. There are clear delineations between two primary technologies in the different imaging processes, traditional film-based imaging and the newer digital imaging. LCA has been used in the past for comparative assessment of two competing technologies [2]. Additionally, there are different means of instantiating these technologies in different business models. Traditional film photography was established and succeeded as a product-service system. Digital systems have been marketed in both product only systems as well as product-service systems. Some have suggested these product-service systems may have inherent advantages in terms of environmental performance [5]. This study uses LCA to assess several of the consumer options with the given scenarios that explore the different methods of providing the imaging function. 2.2 Life cycle assessment structure Development LCA, as with some other analysis techniques, is data driven. With LCA however, the data not only controls the conclusions one can make, but it also can influence the structure and scope of the analysis. Leveraging existing data and past studies was a necessity for this study due to the broad range of systems under investigation. However, incorporating past studies and data provides not only benefits but also brings restrictions, which are due to the structure, scope, and completeness of these sources. The imaging-stage process models comprised one or more LCA modules. These modules are potentially standalone product or process LCAs. They are incorporated into the imaging-stage LCA to complete that stages process LCA. These LCA modules had a variety of sources that can be broken down into three types: external reports, internal studies, and product teardowns. External reports were perhaps the quickest means of obtaining LCA data, but they also incorporate the most restrictions in their use. Internal studies provide the most flexibility in terms of scope and structure, but with the cost of being the most time intensive. Product teardowns linked with an LCA database provide a relatively quick means of obtaining LCA data. The use phase can be closely studied before product teardown and assessment of the materials in the product can help define the end of life. Product and packaging details linked with LCA database entries provide only a partial picture of the
550
system’s upstream phases because these upstream impacts are entirely reliant on general database entries. The resulting effects of including data from different sources can be seen in the structure of this LCA. The life cycle phases, for example, were limited to the lowest common denominator from the incorporated data. Specifically the mining, material processing, and manufacturing stages were aggregated into one phase called “upstream.” This was required for comparability between imaging stages and scenarios, as well as for specific LCA modules to be used in building the image stage process models required for the selected scenarios. While the data sources did influence the scope and the structure of the study, it was also guided by ISO standards for LCA in ISO 14040-3 [1]. The structure of the study, its progression and definition of goals, as well as impacts and improvement assessments, were guided by the ISO standards. Goal and Scope The initial goal of this project was to provide a quantitative profile of the environmental impacts, and their drivers, for each life cycle stage of different imaging systems. This study was to help establish a baseline for resource consumption, energy use and environmental impact information. Providing this profile of the environmental impacts for the various life cycle stages of the systems involved would help identify life cycle stages where improvements could be made. Initially, only a select subset of imaging system “modules” was planned to be analyzed, with the intent to expand to additional systems. The analysis was to be conducted in such a way as to be useful / leveraged across various imaging applications and to be consistent with industry practice and ISO standards. Life Cycle Phases Four life cycle phases were used to partition the life cycle of each of the processes that were evaluated. Material gathering, refining, and manufacturing are collapsed into the first phase, which is called upstream. This aggregation of phases was not by choice, but rather was dictated by some of the data sources in order to ensure phase comparability amongst the different imaging stages. The second phase, distribution, involves packaging and shipping the product from the manufacturing center to the use site. The LCA models used for the distribution phases included three different modes of transportation. These modes were shipment by sea, airfreight, and ground transport via truck. Each of the different imaging stage process models had their distribution phases built from these models. The product’s shipping weight and the distances for each of the utilized modes of transport were used to complete the distribution phases Primary consumer interaction is captured in the use phase. In order to ensure comparability, the use phase was developed with the philosophy of functional capability. The imaging stages for each scenario include the impacts assessed for one flash image capture, processing, and output. No other functions were included in the assessment. Additionally, consumer habits were not considered, such as the capture of multiple digital images and deleting some images in the camera before printing the remaining images. Further work incorporating actual consumer usage patterns could lead to further insight regarding the use phase of this process. The last phase, end-of-life, involves the impact associated with the transportation and disposal at the end of the useful life. The composition of this phase is similar to the
P ROCEEDINGS OF LCE2006
distribution phase in that it includes a general transportation model that is applied to all of the different products. The products mass and a general distance to landfill are used to complete the end-of-life phase. Functional Unit The functional unit in an LCA study must be chosen to encapsulate the end function that is being enjoyed by the user of the product or service. The evaluation on this basis is intended to provide some measure of the environmental effectiveness of different systems in providing the same function. While the individual processes, image capture, processing, and output are different, they are all connected by a common end goal of providing the user with an image. The Life Cycle Assessment models of each of these different stages were done independently with the functional unit of each stage chosen to facilitate an overarching functional unit of the capture, processing, and output required to produce one 4″ x 6″ color image. Of note are the fundamental differences between traditional film processes and digital processes; the traditional processes and thus the data sources and models are tied to a per image scheme while the digital processes (image processing and output specifically) generally have some sort of time estimate as to how long a particular process takes per image. Inventory Analysis With the broad range of different processes under investigation, the approach to performing this imaging LCA had to leverage as much existing data as possible. Where possible, data was drawn from existing internal and external sources. If data was not readily available, further internal studies were completed. The processes under investigation were divided into ten different imaging stages. These imaging stages, in turn, were divided into sixteen different LCA modules, which are shown in the table below. LCA Modules Data Source Film Camera Teardown Film Internal Battery External Digital Camera Teardown Retail Equipment Internal Retail Chemistry Internal Electricity Use External Photo Paper Internal Wholesale Equipment Internal Wholesale Chemistry Internal Personal Computer External LCD Monitor External CRT Monitor External Inkjet Printer Teardown Inkjet Cartridge Teardown Inkjet Paper Internal Table 2: LCA modules Data Sources The external studies were publicly available data either in the form of government studies or LCA databases. Life cycle inventories for these different studies were adapted for use within the larger imaging scheme. Data for many of the upstream processes was found in commercially available software/database packages [6] [7]. Product teardowns consisted of a breakdown of the particular
system and an assessment of the material types and weights. These breakdowns were connected with database entries to provide the upstream phase of its lifecycle. The product packaging, total mass, country of origin, and mode of transportation provided the basis for the distribution phase. Again, in the distribution phase, LCA databases where critical in tying measures and information to impacts. Product literature, as well as further measurement was used to complete the use phase. The end-of-life phase was developed using the known product material make up and masses, along with an estimate for typical disposal transportation. Internally developed studies allow the greatest control over data but at a higher development cost. Additionally, outside sources, in terms of suppliers, are likely to still be necessary. The ease with which these studies can be done depends on the level of information available and its format. Frequently, data is not collected per “product” (for example, utility information is usually tracked per building). The allocation necessary to break out impacts for a specific product further complicates the process. Impact Categories The selection of impact categories was influenced by the broad range of products and services under scrutiny, as well as the variety of data sources. There are a variety of environmental impacts; however, four categories were selected with guidance of Kodak’s corporate environmental goals. The impact categories were Energy Use (MJ), Greenhouse Emission (kg CO2 equivalent), 3 Water Use (m ), and Solid Waste Generation (kg). While these do not represent a comprehensive set, for this study they provide a set of accessible and manageable impacts Assumptions Lifetime assumptions can have a dramatic affect on the end results of any LCA. Given that the focus with LCA is that of a function provided to the users, the “amount” of this function that the system is able to provide over its lifetime is critical. This, of course, depends on the definition of the functional unit in the study. For the sake of simplicity, lifetimes for the main systems in this study where given approximate values. These values were in terms of either images or time. The systems that were tied directly to imaging had lifetimes in terms of the number of images. The computer and monitor systems were given lifetimes in terms of time, to cope with the fact that they were used for different processes in the different imaging stages. This format also provides some flexibility in parameter variation for these processes. The table below shows some of the selected assumptions for the systems, as well as some of the consumables these systems require for operation. LCA Modules Film Camera Digital Camera
Approximate Lifetime 4800 images
Retail Equipment
5.9*10^6 images
Wholesale Equipment
2.4*10^9 images
Battery Retail Chemistry, Water, Electricity, Photo Paper Wholesale Chemistry, Water, Electricity, Photo Paper
PC LCD Monitor CRT Monitor
5500 hours 22,500 hours 6,200 hours
Electricity Electricity Electricity
Inkjet Printer
3000 images
Electricity, Inkjet Cartridge, Paper
4500 images
13th CIRP I NTERNATIONAL C ONFERENCE ON L IFE C YCLE E NGINEERING
Consumables Film, Battery
551
552
1.00 0.75 0.50 0.25
C/ LD D
C/ CD
C/ LI
D
D
C/ CI D
C/ LW D
C/ CW D
C/ LR D
/W
D
FC
FC
C/ CR
0.00 /R
kg CO2 eq. / kg CO2 eq.
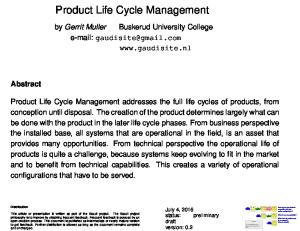
Scenario Comparison - Greenhouse Emission
Figure 1: Scenario comparison – greenhouse emission. As may be expected, the results for Energy Use and Greenhouse Emission were closely linked as the majority of electricity generation involved combustion of fossil fuels. The Water Use category also proved to be tied closely to energy use for the digital scenarios. This was due to tracking of water used in hydropower operations in the modes for electricity generation. The electricity models used in the digital side differed from those used in the traditional film production. The film production electricity generation was modelled from Kodak’s own electricity generation while the digital side used a module developed based on the average US electricity generation. The inclusion of hydropower related water makes the water use category somewhat contentious. Scenario Comparison - Energy Use 1.00 0.75
MJ / MJ
0.50 0.25
C/ LD D
D
C/ CD
C/ LI D
C/ CI D
C/ LW D
C/ CW D
C/ LR D
D
C/ CR
/W FC
FC
/R
0.00
Figure 2: Scenario comparison – energy use. The high value for water use for DC/CD is linked to the output stage and the CRT monitor, primarily in two of its phases. The majority (about two thirds) of it is linked to the upstream phase while around a quarter of it is associated with the use phase. The upstream impacts are magnified because of the CRT’s shorter lifespan, in comparison to an LCD monitor. This use phase water impact is of a questionable nature, because the grid mix electricity module includes turbine water from hydroelectric generation. Scenario Comparison - Water Use 1.00 0.75 0.50 0.25
C/ LD D
C/ CD D
C/ LI D
C/ CI D
C/ LW D
C/ CW D
C/ LR D
D
C/ CR
/W FC
/R
0.00 FC
3 LCA RESULTS The following section details the results obtained for ten different consumer-imaging and output scenarios. These are shown first in a graph for each impact category and then in a table. The results for each of the twelve different process models, by life cycle phase, are also shown. The results were computed in terms of the four impact categories. Greenhouse Emission was calculated in terms of kilograms of carbon dioxide equivalent while the Energy Use category was computed in terms of mega Joules. Water Use and Waste Generation were in terms of cubic meters and kilograms, respectively. The results were normalized across the scenario results and then separately normalized across the processes results. This separate normalization allows a comparison across scenarios and then between the different imaging stages. 3.1 Results, Scenario Comparison While the first scenario, Film Capture to Retail, is clearly the highest result in Greenhouse Emission, it is interesting to note how many of the scenarios are close to the midpoint here. Also of note is that the electricity generation details were known for the traditional side upstream processes while upstream electricity generation details for many of the other processes were not known. This resulted in a very specific, fossil fuel energy generation model for the FC/R module while a general model of the US generation sources was used for other processes. The inclusion of nuclear, hydro and other electricity generation from the average US grid mix lowers the Greenhouse Emission impact per kWhr. This is part of the reason why the FC/R result for Greenhouse
Emission is the highest while in the Energy Use category it is surpassed by the DC/CD scenario while most of the other scenarios maintain their relative order.
m^3 / m^3
Table 3: Some selected assumptions 2.3 Scenarios The following are brief descriptions of the ten scenarios that were developed. They include two fully traditional, film-based scenarios; four fully digital scenarios; and four hybrid scenarios. There are two scenarios that begin with traditional film capture and eight that begin with digital capture. The significant difference in number of options after digital and film capture is due to the greater flexibility of digital information. The flexibility is, at least, a functional advantage of beginning with a digital capture. The first scenario, Film Capture to Retail Print (FC/R), involves a traditional film capture process, combined with a local retail processing and a printing operation typical of drug store operations in the US, where processing and printing are done on site. The second scenario, Film Capture to Wholesale Print (FC/W), is the same capture option, but processing and printing is done in a largevolume facility that is typically used by many retailers. The next four scenarios that are presented are all hybrid systems that begin with digital capture and end with a traditional output. The processing component of these involves transferring the digital images from a camera to the printing operation via a personal computer (PC) with either a CRT or LCD monitor. These scenarios include Digital Capture to CRT Retail Print (DC/CR), Digital Capture to LCD Retail Print (DC/LR), Digital Capture to CRT Wholesale Print (DC/CW), and Digital Capture to LCD Wholesale Print (DC/LW). The final four scenarios are all purely digital options; once again both monitor options (CRT and LCD) are included. There are two inkjet print options, Digital Capture to CRT Inkjet Print (DC/CI), Digital Capture to LCD Inkjet Print (DC/LI), and two display options, Digital Capture to Display CRT (DC/CD) and Digital Capture to Display LCD (DC/LD).
Figure 3: Scenario comparison – water use.
P ROCEEDINGS OF LCE2006
The waste generation results are dominated by the inkjet output options. The sources of these impacts are primarily the upstream life cycle phases and are related to electronics manufacturing with some additional impact during the end of life. The lifetime assumption for the printer is less than the lifetimes assumed for other electronic devices. This helps explain the high impact scores in these particular scenarios.
3.2 Results, process comparison While some assumptions can be made about the process results by comparing the scenario results, a closer look at the process results is warranted. The charts below have a comparison of the various process life cycle phases per impact category. These results have been normalized separately from the scenario results presented above.
Scenario Comparison Waste Generation
Process / Phase Contributions - Greenhouse Emissions
Use
0.60
Distribution
0.40
Upstream
0.20 LCDD
CRTD
LCDIO
CRTIO
RP
WP
LCDP
CRTP
C/ LD
RFP
0.00
D
Figure 5: Process results – greenhouse emission. Process / Phase Contributions - Energy Use 1.60 1.40 1.20 1.00 0.80 0.60 0.40 0.20 0.00
End of Life Use Distribution
LCDD
CRTD
LCDIO
CRTIO
WP
RP
LCDP
CRTP
RFP
WFP
FC
Upstream
DC
Figure 4: Scenario comparison – waste generation. Scenario Overview The table below contains the normalized scenario results totalled for each of the different impact categories. The units for these results after normalization are: Greenhouse 3 3 Emission – kg CO2 eq. / kg CO2 eq, Water Use – m / m , Waste Generation – kg / kg and Energy Use – MJ / MJ. The bold-faced values represent highs for a particular category, while the underlined values indicate the low values. A comparison of the different scenarios, looking at all of the impact categories results at one time indicates that no one scenario performs best or worst in all four categories. Two scenarios have the lowest impacts in two out of the four impact categories. Both of these scenarios use a wholesale printing operation. A comparison with these options with their retail output counterparts indicates more of a savings in the Greenhouse Emission and energy use categories than in water use and waste generation. It can be suggested that these results indicate an advantage of economies of scale. It is important to note that these advantages would decrease if the wholesale equipment lifespan, in terms of images, was reduced. One example of this reduction could be if the output operation is not utilized at full capacity.
MJ / MJ
C/ LI
C/ CD D
D
C/ CI D
C/ LW D
C/ LR
C/ CW D
D
C/ CR
/W
D
FC
FC
/R
0.00
End of Life
0.80
WFP
0.25
1.00
FC
0.50
Figure 6: Process results – energy use. Process / Phase Contributions - Water Use 1.40 1.20 m^3 / m^3
kg / kg
0.75
1.20
DC
kg CO2 eq. / kg CO2 eq.
1.00
1.00
End of Life
0.80
Use
0.60
Distribution
0.40
Upstream
0.20 LCDD
CRTD
LCDIO
CRTIO
WP
RP
LCDP
CRTP
RFP
WFP
FC
DC
0.00
Figure 7: Process results – water use. Process / Phase Contributions - Waste Generation 1.20 1.00 kg / kg
End of Life
0.80
Use
0.60
Distribution
0.40
Upstream
0.20 LCDD
CRTD
LCDIO
CRTIO
WP
RP
LCDP
CRTP
RFP
WFP
FC
0.00 DC
Greenhouse Water Waste Energy Emissions Use Generation Use 1.0000 FC/R 0.0075 0.0992 0.9801 FC/W 0.6127 0.0064 0.0714 0.6508 DC/CR 0.6770 0.2053 0.2512 0.7945 DC/LR 0.6409 0.0595 0.2281 0.6786 DC/CW 0.4673 0.2053 0.2494 0.6193 DC/LW 0.2085 0.0547 0.2034 0.2235 1.0000 DC/CI 0.3122 0.1976 0.4606 DC/LI 0.2798 0.0670 0.9794 0.3567 1.0000 1.0000 DC/CD 0.5145 0.3388 DC/LD 0.3337 0.2709 0.1724 0.4203 Table 4: Results overview The high results in FC/R for Greenhouse Emission are related to use, and they are tied to energy use, film, and chemicals. The high results in DC/CD are related to electricity use and upstream manufacturing. High waste generation results are made worse by the relatively short lifespan assumption for inkjet printers.
Figure 8: Process results – waste generation. While these phases are not selected to in any way be “equal” to each other, it is interesting to note the large disparity. The end-of-life phase has almost unnoticeable impact in most categories and makes up only a fraction of the impact in waste generation. Similarly, the distribution
13th CIRP I NTERNATIONAL C ONFERENCE ON L IFE C YCLE E NGINEERING
553
phase is a fraction of the impacts for all of the impact categories and processes. The largest impact for the distribution phase occurs in the Greenhouse Emission and energy use categories, and they are associated with transportation energies related to the shipment of products from manufacturing sites (sometimes overseas) to the market. This being said, the use and upstream phases dominate the process impacts. There tends to be more impact from the upstream categories for digital output processes while the traditional processes impacts focus on the use phase. Part of this difference is due to the differences in the processes themselves. The traditional output systems are service systems. This means that the equipment is generally sized larger (to handle many individuals printing needs) but has a much longer lifetime than typical consumer products. The long product lifetimes of the traditional processing and printing equipment leads to a low impact, per image, from this equipment’s manufacture. A comparison of the impacts for traditional retail and wholesale processing and printing indicate that there certainly are benefits as a result of the economies of scale in this product/service system. In contrast, the shorter lifetimes and heavy use of electronics in the digital systems are tied to the larger portion of impact from their upstream phases. 4 SUMMARY hen all impacts were considered, no single imaging W scenario was clearly "better" or "worse" than the others. Imaging scenarios that were advantaged in one impact category were often disadvantaged in others. This leads one to believe that a more complete picture (with more impact categories) would also not show an “absolute winner.” Across the board, the two phases that most influenced the results, were the upstream and use phases. There tends to be more impact from the upstream categories for digital output processes, while the traditional processes impacts focus on the use phase. Part of this trend is related to the differences in product and service systems. Impacts from the distribution phases are mostly seen in the energy use and Greenhouse Emission categories, and they are heavier on the digital side because of overseas shipping. The benefits of economies of scale are shown in the comparison of retail vs. wholesale processing and printing. A continuation of these shared resources and moving to a more service oriented digital output scheme would seem to be advantageous. Additionally, any innovation that simplifies the imaging process (e.g., printer docks or automatic on-camera image manipulation/ correction) removes impacts from the imaging chain (computer processing and display). However, digital technologies offer more choice/flexibility, resulting in a much wider range of potential impact. Time spent “processing” on a computer, for example may significantly influence energy consumption, or viewing on a soft display, and/or image capture using the LCD vs. the viewfinder. The study was undertaken from a functional capability point of view and actual usage habits were not included. It is clear, however, that consumer choice during the use phase can significantly influence the environmental impact. The influence of the use phase on the scenario results shows the importance of continuing to strive for energy efficiency in design and production, as well as consumer awareness of the use phase impacts and means to mitigate them.
554
While efforts were made to incorporate the most up-todate information in this study, processes and technology across the industry change rapidly. The digital side, especially, is developing so rapidly that many of the suggested areas for improvement are already in play. Improvements in energy efficiency and incorporating features on-camera to eliminate process steps have already been incorporated into new systems Further efforts could be directed in several areas. First of all, life cycle inventory data can be updated and improved. Specifically, upstream data, which has been aggregated in this study, could be broken out to show the impact related to mining, material processing, and manufacturing. One of the challenges involved in pursuing this would include the number of different parties that may have to be involved. Additionally, the use phase in this study was, by design, a simple model. Further development of a more realistic use model, especially on the digital side, could yield some interesting results. For example, actual consumer usage habits could be incorporated and compared to these results as a baseline. This could be especially useful in drafting any sort of consumer communications regarding use-phase impacts and potential means to reduce them. Such a study could provide an opportunity to investigate some of the additional functions that digital photography allows, such as sharing, editing, and storage of images. ACKNOWLEDGMENTS Georgia Tech would like to acknowledge the support and partnership of Eastman Kodak Company. REFERENCES [1] International Standards Organization, 2001, ISO 14040-14043, Environmental Management – Life Cycle Assessment. [2] Socolof, M., Overly, J., Kincaid, L., Geibig, J., 2001, Desktop Computer Displays: A Life-Cycle Assessment, US EPA & University of Tennessee. [3] Keoleian, G., Phipps, A., Dritz, T., Brachfeld, D., 2004, Life Cycle Environmental Performance and Improvement of a Yogurt Product Delivery System, Packaging Technology and Science, 17, 85–103. [4] Atlantic Consulting, 1998, EU Ecolabels for Personal Computers, European Commission, Brussels. [5] Mont, O.K., 2002, Clarifying the Concept of ProductService System, Journal of Cleaner Production, 10, 237-245 [6] Sima Pro, 2004-5, Pre Consultants, Amersfoort. [7] TEAM, 2004, PricewaterhouseCoopers/Ecobilan, Neuilly-sur-Seine. Contact Professor Bert Bras Georgia Institute of Technology George W. Woodruff School of Mechanical Engineering Atlanta, GA 30332-0405
[email protected]
P ROCEEDINGS OF LCE2006


![Product Life cycle. Product life cycle and the Product Life Cycle Curve [PLC]](https://kipdf.com/img/300x300/product-life-cycle-product-life-cycle-and-the-prod_5ac29f511723dd94208541f2.jpg)