Oregon Health & Science University
OHSU Digital Commons Scholar Archive
May 2012
Leptin resistance and left ventricular hypertrophy in obese children and adolescents Dallen K. Ormond
Follow this and additional works at: http://digitalcommons.ohsu.edu/etd Recommended Citation Ormond, Dallen K., "Leptin resistance and left ventricular hypertrophy in obese children and adolescents" (2012). Scholar Archive. Paper 722.
This Dissertation is brought to you for free and open access by OHSU Digital Commons. It has been accepted for inclusion in Scholar Archive by an authorized administrator of OHSU Digital Commons. For more information, please contact
[email protected].
Leptin Resistance and Left Ventricular Hypertrophy in Obese Children and Adolescents
By Dallen K. Ormond
A Dissertation
Presented to Oregon Health & Science University School of Nursing In partial fulfillment of the requirements of the degree of Doctor of Philosophy
May 17, 2012
Faculty Approval:
________________________________________ Gail Houck, Ph.D, R.N. Dissertation Chair ________________________________________ Nancy Perrin, Ph.D Committee Member ________________________________________ Lisa Wood, Ph.D, R.N. Committee Member _________________________________________ Dean School of Nursing
2
Financial Support Financial and staff support were graciously provided by The University of Utah Government Center for Clinical Research, and Oregon Health & Science University. Tuition support was generously provided by Brigham Young University.
3
Acknowledgements Special thanks to Richard Williams, MD, cardiologist at Primary Children's Medical Center in Salt Lake City Utah. Without his support this project would not have materialized. I would like to express my sincere appreciation to the faculty of Oregon Health & Science University School of Nursing for their support and help, with special thanks to my dissertation committee members and chair for their countless hours of support. I also want to thank many family members and my children for providing motivation when it seemed that finishing this degree was impossible.
4
Abstract This study explores the relationship between leptin resistance (LR), as identified by elevated leptin levels, and cytokines, in obese children and adolescents. It is based on a conceptual framework that relates left ventricular hypertrophy (LVH) in obese children and adolescents to LR. LR is, perhaps, directly related to interleukin-1 receptor antagonist (IL-1RA), a potent anti-inflammatory cytokine. Regression analysis was performed with left ventricular mass (LVM) functioning as the dependent variable while age, sex, body mass index (BMI), mean arterial pressure (MAP), and serum levels of leptin, insulin, and IL1-RA as independent variables (R2 = .41, F (7, 12) = 1.204, p = .37). Because statistical power was not achieved, Cohen’s guidelines for r were followed. Several correlations demonstrated moderate to large effects. The results showed that LVM correlated with BMI, suggesting a moderate effect (r = .46). Other moderate correlations with BMI were detected with age (r = .77), MAP (r = .50), leptin (r = .56), and insulin (r = .61). The MAP for the sample population yielded correlations of moderate effect with leptin (r = .50), insulin (r = .57), and correlated strongly with IL-1RA (r = .75). Insulin levels were also correlated with leptin (r = .64) and IL-1RA (r = .52), both moderate effects sizes. The findings supported previous studies in which elevated BMI was associated with LVH, elevated MAP, elevated leptin, and increased insulin levels. The moderately correlated effect between LVM and MAP contradicts results from some studies reporting that blood pressure in adults was not associated with LVH. Because no relationship was detected between leptin and IL-1RA, a mediator relationship could not be tested. No statistically significant interaction between LR and IL-1RA was detected. However, the findings support previous research suggesting that LVH in obese children is associated with an increase in MAP but not leptin. This suggests that changes in MAP may be related to increased IL1-RA .
5
TABLE OF CONTENTS I. Introduction ………………………………………………………………………………….…9 II. Review of Literature …………...……………………………………………………………..13 III. Research Design and Methods ………………………………………………………………37 IV. Results ……………………………………………………………………………………….45 V. Discussion ………………………………………………………………………………...….53 A. Summary and Conclusions ………………………… …………………………… … 59 VI. References ………………………………………………………………………………...…62
6
LIST OF TABLES I.
Table I Descriptive Statistics by Gender…………………………………………….45
II.
Table 2 BMI, MAP, and IL 1-ra values for total sample (N =50) and by gender...........................................................................................................................46
III.
Table 3 Leptin, Insulin, and LVM for the initial sample (n = 20) and by gender...........................................................................................................................47
IV.
Table 4 Descriptive Statistics by BMI Group..............................................................47
V.
Table 5 Correlations among Study Variables for Initial Sample (n = 20) ..................50
VI.
Table 6 Correlations Among Study Variables (n=20)………………………………50
VII.
Table 7 Correlations among Study Variables (N = 50)…………………….………..50
VIII.
Table 8 Regression Model…………………………………………..……………….50
IX.
Table 9 Post Hoc Summary………………………………………………………….52
7
LIST OF FIGURES
I.
Figure 1: Model 1 for activation of the leptin receptor and pathway of anorexia versus appetite stimulation......................................................................................................18
II.
Figure 2: Model 2 of activation of the leptin receptor and pathway of anorexia versus appetite stimulation…………………………………………………………………..19
III.
Figure 3. Proposed model of leptin resistance……………………………………….25
IV.
Figure 4: Alternative Hypothesis for LVH…………………………………………..34
V.
Figure 5: Study Participation, consent, and qualification model………………….…41
8
Chapter 1 Introduction The United States Centers for Disease Control (CDC) defines obesity as an anthropometric measurement in children and adolescents as having “a gender- and age-specific body mass index (BMI) at or above the 95th percentile” of the general population (National Institute of Medicine Preventing Childhood Obesity, 2005). Overweight is defined as having a gender- and agespecific BMI ranking equal to or greater than the 80th percentile of the population. Obese children have been found to have increased blood pressure (BP), left ventricular hypertrophy (LVH), and heart chamber enlargement (Daniels, Witt, Glascock, Khoury, & Kimball, 2002; Gutin, Treiber, Owens, & Mensah, 1998; Hanevold, Waller, Daniels, Portman, & Sorof, 2004). Obesity in children and adolescents has also been associated with decreased high-density lipoprotein (HDL) levels, insulin resistance, and endothelial dysfunction (Jancin, 2003). Epidemiological studies have shown that some obese children are now developing type 2 diabetes mellitus (DM-2) and hyperlipidemia (Jancin, 2003). These conditions are suspected to be precursors to or associated with similar physiologic mechanisms and disease processes found in adults with metabolic syndrome. One estimate suggests that obesity accounts for nearly 9% of United States healthcare spending (Finkelstein & Feibelkorn, 2003)(National Institute of Medicine Preventing Childhood Obesity, 2005). A decade ago, statistics suggested that obesity-related disease accounted for up to 6% of total healthcare expenditures (Seidell, 1998). Hering and colleagues reported on a study of 363 obese children matched with 382 children of normal weight found that the obese children had more hospitalizations, for a longer duration and were given more medications (Hering, Pritsker, Gonchar, & Pillar, 2009). The epidemic of obesity has rapidly gained recognition as an
9
international public health crisis due to its associated co-morbidities which include DM-2, coronary artery disease, peripheral vascular disease, stroke, hypertension, renal failure and osteoarthritis. Left ventricular hypertrophy (LVH) is just one consequence of obesity. It refers to the condition when the muscle of the left ventricle of the heart is thicker than normal, resulting in increased myocardial oxygen demand and decreased cardiac output. Long-known to be associated with obesity in adults, LVH has recently been found to exist in obese children and adolescents as well (Hanevold et al., 2004). Several studies have suggested that LVH in adults is related to an inability of obese humans to properly use the hormone leptin (Pladevall et al., 2003). In obese persons, the inability to properly use leptin results in elevated levels of leptin circulating within the body. This phenomenon is known as leptin resistance (LR). Scientists assess LVH by measuring the left ventricular mass (LVM) of the patient. To date, no studies have been conducted to explore whether LVM levels are associated with serum leptin levels in obese children. The current body of scientific literature lacks in several regards concerning child and adolescent obesity. This study attempts to address two gaps within the literature: to confirm whether or not LVH in obese children and adolescents is associated with LR and to explain why LR occurs in obese children. To address the question of why LR occurs in obese children, this study was designed to explore the relationships between LR, cytokines, and LVH in obese children and adolescents. This study design draws upon the theory that LVH in obese children and adolescents occurs as a result of LR. A premise of this research is that LR may be directly related to elevated levels of interleukin-1 receptor antagonist (IL-1RA), a potent anti-inflammatory cytokine. Because LVH in obese individuals was historically considered related to elevated BP, the first part of this
10
research was performed where LVM was found to be related to BP, and IL-1RA accounted for a large proportion of the variance in BP. Recent studies have shown that IL-1RA is associated with mean arterial pressure (MAP) and LVH (Litwin et al., 2006; Norton et al., 2009). The specific aims of the current study included the following:
Specific Aims 1. Detect whether or not leptin explains a statistically significant proportion of the variance of LVM in obese children and adolescents; 2. Detect whether or not IL-1RA is related to LVM and if leptin mediates this relationship in obese children and adolescents; 3. Detect whether or not MAP accounts for a statistically significant proportion of the variance in LVM in children and adolescents; and to 4. Determine if IL-1RA explains a statistically significant proportion of the variance in MAP in children and adolescents. Definition of Terms Left Ventricular Hypertrophy (LVH) – Cardiac muscle cells do not increase in number after fetal development; therefore when additional stress is placed on cardiac muscle the muscle cells increase in size larger than normal. LVH is a compensatory mechanism. Just as skeletal muscle increases in size to compensate for increased stress, cardiac muscle increases in size in order to compensate for increased stress. Increased myocardial cell size results in increased cardiac wall thickness, which in turn causes decreased cardiac output, increased myocardial oxygen demand, and ultimately heart failure. LVH is calculated by measuring LVM, which is measured through a 2-dimensional echocardiogram of the left ventricular internal dimension,
11
interventricular septal thickness, and posterior wall thickness (Hanevold, et al., 2004). The equation for LVM (g) = 0.81 [1.04 (interventricular septal thickness + posterior wall thickness + LV end diastolic internal dimension)3 - (LV end diastolic internal dimension)3] + 0.06 (Hanevold et al., 2004). Leptin – In the mid-1990’s a bioactive protein called leptin was discovered. Zhang et al., 1994. Leptin is produced by adipose cells, and acts at the hypothalamus to decrease food intake by stimulating the release of pro-opiomelanocortin and increase thermogenesis (Tartaglia,1997). In starvation, leptin levels are very low. When leptin is secreted, appetite is decreased and metabolism increased. Leptin is therefore the body’s mechanism to prevent obesity. Leptin Resistance – Describes the phenomenon in humans whereby, despite elevated circulating levels of serum leptin, the individual does not have the expected physiologic responses of anorexia and increased basal metabolic rate. Interleukin-1 receptor antagonist (IL-1RA ) – Refers to an anti-inflammatory cytokine produced abundantly by white adipose tissue (Somm et al., 2005). IL-1RA binds to the proinflammatory cytokine IL-1β, blocking its activity (H. Yang et al., 2005). Mean arterial pressure (MAP) – MAP is used as a standardized method of assessing an average of systolic and diastolic BPs. It is the average arterial BP during a cardiac cycle. Systolic BP is the internal arterial pressure that occurs when the heart is contracting (systole). Diastolic BP is the internal arterial pressure that occurs when the heart is at rest (diastole). Mean arterial pressure is approximated by (2 x diastolic pressure) + systolic pressure divided by 3.
12
Chapter 2 Background and Significance Prevalence The prevalence of overweight and obese children and adolescents is currently increasing at an alarming rate within the general population of the United States. Statistics derived from the National Health and Nutrition Examination Survey (NHANES) IV (2010) suggest nearly 17% of all of children and adolescents aged 6 to 19 years are overweight (CDC, 2010). This represents an increase of over 50% from a similar assessment done in 1994 and a 228% increase from an assessment survey completed in 1980 (CDC, 2010). Problem While the rate of obesity rapidly increases in the general population, research studies have only scratched the surface as to the physiology of obesity-related disease. The physiology associated with obesity-related disease among children and adolescents also lacks complete description. Left ventricular hypertrophy—the thickening of the heart muscle—is one documented phenomenon found in obese children and adolescents that has previously been detected in obese adults (Kono et al., 1994; Yoshinaga et al., 1995). This location-specific thickening of the myocardial tissue shares a relationship with LR in obese adults (Pladevall et al., 2003). Leptin resistance is considered a condition in which the body becomes opposed to leptin at the cellular level. No method is currently known for directly measuring LR. The concept of LR is theoretical, based on the physiologic principal that fat cells produce leptin to signal the hypothalamus to increase metabolism and decrease appetite. In obese humans, leptin levels are very high, yet there is no decrease in appetite or increase in metabolism (Banks, 2008).
13
Therefore, the anticipated physiologic effects of leptin are not present. This is why elevated leptin levels in an obese adult are considered to be due to LR (Banks, 2008). LR is an assumption that is made when an obese person has elevated levels of leptin without the physiologic effects. Additionally, because leptin has been shown to be independently responsible for LVH in obese animals (Barouch, Berkowitz, Harrison, O'Donnell, & Hare, 2003) and adult humans (Kartal, Inal, Baysan, & Saglam, 2008), measuring LVH when leptin levels are elevated is considered an indirect measurement of LR. To examine LR in obese children, the relationships between leptin and LVH in obese children and adolescents are examined closely. No study has previously documented the relationships between leptin or LR and LVH in obese children and adolescents. The cytokines interleukin-1 (IL-1), IL-6, IL-10, and IL1-RA may be associated with obesity-related diseases such as metabolic syndrome (K. C. Huang et al., 2004; Mendall et al., 1997; Okamoto et al., 2000). No studies appear in the body of scientific literature having identified how chronic inflammation affects heart size in obese children and adolescents. A principal component of the current study was detecting whether or not LR is linked to cytokine function in adult human and animal models (Munzberg, Bjornholm, Bates, & Myers, 2005; H. Yang et al., 2005). No study could be found within the body of literature that documents LR in children attenuated by cytokines. This study was not conducted to document LVH’s cause rather it was to look at leptin resistance. LV-Mass was selected as the way to measure leptin resistance. A hypothesis of this research is that IL-1RA, a potent anti-inflammatory cytokine, plays an integral role in leptin resistance.
14
Leptin Leptin was first described in the mid 1990’s as a hormone acting at the hypothalamus to regulate food intake and thermogenesis (Satoh et al., 1997). Leptin is produced by adipose cells. Therefore, more adipose tissue should mean a higher level of circulating leptin in the body (Banks, 2008). In starvation the number of adipose cells decreases, leptin production decreases, and subsequently appetite is increased while metabolism is decreased. Leptin is known to be associated with many peripheral mechanisms such as immunity, bone mineralization, cognition and neurogenesis, and breathing (Banks, 2008). Leptin receptor genes contain genetic codes for several versions of the receptor molecule. The leptin receptor is particularly abundant in the hypothalamus (Tartaglia, 1997). Multiple forms of the leptin receptor have been identified; the most active form is known as the long form LRb (Tartaglia, 1997). The leptin receptor has been found in the IL-6 family of class 1 cytokine receptors (Tartaglia, 1997). The LRb signals via a non-covalently associated tyrosine kinase molecule of the Janus Kinase (Jak2) family of receptors (Munzberg, et al., 2005). It is believed that the neuroendocrine function of leptin is based in the arcuate, dorsomedial, and ventromedial nuclei (Munzberg et al., 2005). In the arcuate nucleus LRb is found within 2 populations of neurons. The first inhibits neuropeptide Y and agouti related peptide (AgRP). The second synthesizes pro-opiomelanocortin (POMC), which is processed to produce α-melanocytestimulating-hormone (Munzberg et al., 2005). This hormone signals anorexia. Neuropeptide Y acts within the brain to stimulate feeding (orexigenic) and decrease energy expenditure (Griffin & Ojeda, 2004). Agouti related protein is an antagonist to α-melanocyte-stimulating-hormone (αMSN) (Munzberg et al., 2005). These interactions act as a feedback mechanism to alter appetite.
15
Three distinct pathways of leptin signaling have been identified in the neuroendocrine system, all of which appear to be dependent on the Jak2 pathway, including the phosphorylation of 2 tyrosine residues: Tyr985 and Tyr1138 (Munzberg et al., 2005). Tyr1138 stimulates the transcription of POMC. The Jak2, Tyr985, and Tyr1138 pathways are all attenuated by suppressor of cytokine signaling (SOCS3) pathway. POMC activates SOCS3 (Munzberg et al., 2005). Therefore, as anorexia is stimulated by the production of POMC, a feedback loop is activated where the LRb receptor is blocked and ultimately appetite is stimulated. Leptin Resistance The discovery of leptin combined with related human studies provide an adequate description of the phenomenon of LR. This term encompasses a complex interaction of pathophysiological mechanisms. Central LR is a process whereby leptin reception is inhibited at the hypothalamic level. This process affects the physiologic mechanisms described earlier with metabolism. Peripheral LR has can injure peripheral tissues and systems including, liver, pancreas, platelets, vasculature, and myocardium (Martin, Qasim, & Reilly, 2008). Leptin resistance is dependent on a complicated interplay of pathways. Because leptin functions in many body tissues, a single explanation for LR may not be appropriate. Banks (2008) states that LR may be part of three mechanisms including the blood-brain barrier (BBB), receptor/post-receptor activation, and a downstream neuronal circuit (pp. 1607). Martin and colleagues described five possible mechanisms of LR including circulating regulators, self regulation, genetic mutation, limited tissue access, and cellular regulators (Martin et al., 2008). A genetic mutation for LR has been found and demonstrated in animal models (the Ob/Ob mouse model). Similar dysfunction has also been seen in humans, but is extremely rare (Considine et al., 1996). It is extremely unlikely that a genetic mutation would be acquired by
16
such a large and growing percentage of the population over a short period of time according to Mendelian principles. Martin and coauthors proposed that that polygenetic-inheritance patterns may still play a role in LR, but have yet to be adequately explained (Martin et al., 2008).
17
NPY
IRS Tyr
P
Jak-2
SHP-2
Tyr 985 P
Reproduction & Growth
PI3K
?
Satiety, Energy Expenditure SOCS3
SNS
Tyr 1138
P
STAT3
POMC
Thyroid
Figure 1: Model 1 for activation of the leptin receptor and pathway of anorexia versus appetite stimulation.
18
Arcuate Nucleus
Lrb
Pro-Opiomelanocortin (POMC) Neuropeptide-Y (NPY)
α-Melanocyte Stimulating Hormone (α-MSN)
Agouti-related Peptide
Melanocortin-4
Anorexia
Appetite
Figure 2: Model 2 of activation of the leptin receptor and pathway of anorexia versus appetite stimulation.
Resistance at the BBB has been described (Hileman et al., 2002). The short form of the Ob-R receptor appears to be associated with leptin reception at the blood brain barrier in rodents (Hileman et al., 2002). A principal objective of their study was to determine the relative expression of the short Ob-R iso forms at the blood-brain barrier. Another objective was to 19
determine whether Ob-R iso forms were required for normal brain uptake of leptin. Reported results demonstrated uptake of leptin by the brain was decreased in both polygenic and a dietinduced obese rodents (Hileman et al., 2002). This information suggests LR at the BBB. Research evidence suggests that LR may be associated with a self-regulatory mechanism (Martin et al., 2008). Zhang and Scarpace (2006) discussed three mechanisms of central LR associated with self-regulation: an inability of peripheral leptin to reach the hypothalamus, decreased hypothalamic leptin receptor number and an impaired leptin signal transduction (Zhang & Scarpace, 2006). In a series of studies, the pair of investigators described how these scenarios for LR were demonstrated (Zhang & Scarpace, 2006). The first study described young lean rats compared to genetically-modified rats designed to acquire adult onset obesity, similar to what occurs in humans. The aged obese rats and lean controls were both given a central and peripheral leptin infusion. The results demonstrated a “markedly blunted” response in the agedobese rats to both central and peripheral leptin administration. This response was measured by evaluating levels of STAT3 phosphorylation and P-STAT3 transcription factor binding to test hypothalamic signaling (pp. 250). The authors also reported a study in which diet-induced down regulation of leptin receptors was induced by a high-fat diet. The study rats which were fed a high-fat diet were compared to rats which were fed a balanced diet. These two groups were then given a dose of leptin. This generated a greater than 6-fold increase in leptin STAT3 phosphorylation as compared to only a 2-fold increase in the obese rats fed a high fat diet. The obese rats were then placed on a calorie-restricted diet and subsequently given the same dose of leptin. The animals demonstrated a similar leptin response to the non-obese rats with a balanced diet. These results suggest that leptin receptors are down regulated in high-fat diet-induced obesity. The researchers
20
stated that this may be an instance of leptin acting as a “self-regulator” (Zhang & Scarpace, 2006). The group also conducted a third study to determine whether regulated leptin transgene expression achieved the same degree of leptin signaling as seen in chronic transgene expression. The researchers designed a rat model that allowed regulation of hypothalamic leptin expression by administration of an antibiotic. The rats with chronic transgene expression had less hypothalamic leptin expression than the group with regulated transgene expression (Zhang & Scarpace, 2006). The researchers asked whether leptin induces LR. The leptin gene was delivered to the third ventricle of the brain in lab rats through transfection. The exposed animals initially responded with less food intake but over time the effect decreased when compared to a control group. At 140 days the two groups had similar responses. This showed that while in the exposed group initially had a stronger response to central hyperleptin levels over time, the response was blunted (Zhang & Scarpace, 2006). Circulating regulators of the leptin signaling system can also interfere with leptin reception. Yang and colleagues (2009) suggested that LR may be related to interruption of downstream signaling of STAT-3 (G. Yang et al., 2009). As discussed earlier, this mechanism of resistance would explain hypothalamic LR. It also demonstrates that resistance may be related to a transporter interaction. Banks (2008) suggests that leptin transport is enhanced by insulin, glucose and epinephrine, while inhibited by loss of ovarian function, obesity, starvation, treatment with a lipopolysaccharide and hypertriglyceridemia . Cellular-level LR mechanisms are described in a study of mice lacking leptin (ob/ob) or a functional leptin receptor (db/db) (Barouch et al., 2003). They found that leptin was an independent determinant of LVH. In leptin-deficient mice (ob/ob) when leptin was replenished,
21
there was complete reversal of gross cardiac hypertrophy. Furthermore, in a study of leptindeficient (ob/ob) and leptin-resistant (db/db) mice, (Raju et al., 2006) found that mice that received ciliary neurotrophilic factor (CNF)—a previously undescribed signaling pathway—had reversal of gross hypertrophy. The researchers concluded that CNF was responsible for downstream leptin signaling. Finally, a study of pediatric cardiac myocites reported that attenuation of Jak2, as well as, STAT and MAP kinases altered leptin action in these cells (Madani, De Girolamo, Munoz, Li, & Sweeney, 2006). Extracellular circulating factors also exist that may affect leptin’s action and availability according to a study reporting on the attenuating effects of C-reactive protein on leptin (Procopio, Andreozzi, & Sesti, 2007). CRP is an acute phase reactant stimulated by IL-6, which binds to a phosphocholine molecule bonded to the surface of dead or dying cells. When CRP binds to phosphocholine it activates the compliment system. The purpose of this inflammatory cascade is the clearance of necrotic and apoptotic cells. In a study by Procopio and colleagues (2007), preincubated leptin was saturated in human C-reactive protein (CRP) for 30 minutes prior to treating human cells. Down-stream regulators of leptin function were impaired alluding to the likelihood that leptin function may be regulated by the body’s immune system. The suggested relationship between leptin and the immune system could explain LR because the leptin receptor has been found in the IL-6 family of class 1 cytokine receptors (Tartaglia, 1997). The process of a chronic inflammatory state in association with obesity has also been described by contemporary research, initially due to the discovery of white blood cells in atheromatous plaques. As early as the 1990’s, researchers were identifying possible links between inflammatory processes and atherosclerosis (Danesh, Collins, & Peto, 1997). Additionally, coronary artery disease has been associated with elevated levels of CRP. This
22
discovery suggests the possibility of stronger inflammatory connection with diseases associated with obesity than previously thought. Left Ventricular Hypertophy and Leptin Left ventricular hypertrophy has been linked in adult humans and animal models to a lack of leptin reception. Kartal and colleagues (2008), reported a study of adult hypertensive patients (N = 80) and found that those with LVH had significantly higher levels of leptin than those without LVH (Kartal et al., 2008). They also reported that serum leptin levels were related to LVH independent of BMI and BP. This study generates an important question: If LVH is apparently associated with lack of leptin reception, why do adults with elevated leptin levels have LVH? For example, in some animal models where subjects are genetically modified with the inability to produce leptin, the test subjects have LVH as well (Kartal et al., 2008). Also, in a comparative study of leptin deficient (ob/ob) mice and control mice subjected to transverse aortic constriction, the injection of leptin into the ob/ob mice resulted in protection from ventricular hypertrophy by activating the NFATc4 DNA binding activity allowing increased cardioprotective markers. These results allow us to conclude that leptin possibly provides a protective mechanism against LVH in animal models (Mascareno, Beckles, Dhar-Mascareno, & Siddiqui, 2009). To answer the above question, while leptin is abundant in obesity LR prevents it from functioning as intended. It may be considered that leptin acts an independent determinant of left ventricular hypertrophy (LVH) in leptin deficient mice as described earlier (Barouch et al., 2003). In that study, when leptin was replenished in the leptin deficient mice (ob/ob), there was a complete reversal of gross cardiac hypertrophy. This result has never been duplicated in human models because the prevalence of genetically leptin deficient humans is very low.
23
Obese children have shown evidence of LVH. Gutin and colleagues reported a study of children aged 7 to 13 years (N = 62), reports that for LVM/height 2 .7, when controlling for age, partial correlation with percentage of body fat existed in the sample (r = .25). Multiple regression analysis revealed that independent proportions of the variance were explained by gender (boys > girls), ethnicity (black > white), and percentage of fat.When controlling for age, non-normalized LVM was correlated with fat-free mass (r = .76) and fat mass (r = .58). Multiple regression analysis also suggested that fat-free mass explained independent proportions of the variance in LVM. Percentage of fat was correlated, when controlling for age, with greater relative wall thickness (r = .34) and lower mid-wall fractional shortening (r = -.37) (Gutin et al., 1998). Evidence of hyperleptinemia in obese children and adolescents was reported in a study of 40 obese and lean adolescents, which concluded that mean fasting 24-hour leptin levels were significantly higher in obese boys and girls than in lean control subjects (Heptulla et al., 2001). The authors also reported no difference in leptin amplitude over a 24 hour period in obese boys or girls. IL-1RA and LVH in Obese Children and Adolescents Recent research suggests that the cytokines interleukin-1 (IL-1), IL-6, IL-10, and IL1-RA may be associated with obesity related diseases such as metabolic syndrome. (K.-C. Huang et al., 2003; Mendall et al., 1997; Okamoto et al., 2000). No study references were found within the body of scientific literature identifying how chronic inflammation affects heart size in obese children and adolescents. Research documenting leptin resistance linked to cytokine function in the body serves as a contextual precursor for our study of LR and LVH in obese children and adolescents (Munzberg et al., 2005; H. Yang et al., 2005). No study documentation could be found which focuses on the existence of LR attenuated by cytokines in children. The proposed
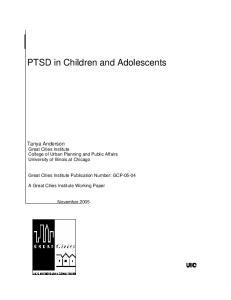
24
hypotheses are based on the assertion that IL-1RA plays an integral role in this process. Figure 3 demonstrates the possible processes that explain leptin resistance and LVH in obesity in obese children.
IL-1 Immune Response
IFN
IL-6
Obesity
Elevated Leptin
a t t e n u a t e d
IL-1RA ? Leptin Resistance
Left Ventricular Hypertrophy Figure 3. Proposed model of leptin resistance.
One premise for this study asserts that obesity causes an increase in IL-1RA. For this study, it is hypothesized that IL-1RA antagonizes cytokine pathways that activate the leptin receptor. Research has suggested strong evidence for LVH relating to LR in obese individuals (Barouch et al., 2003; Pladevall et al., 2003).
25
Meier and colleagues analyzed leptin and IL-1RA levels in humans (Meier et al., 2002). Three groups of individuals were evaluated. One group included 20 morbidly obese non-diabetic women, 15 of whom were evaluated before and after gastric bypass surgery. A second group included 10 non-morbidly obese women matched for weight, age and height with the group of obese women. A third group had 5 moderately obese patients (30 < BMI
35). The obese
subjects from group one underwent gastric bypass surgery. The results indicated that serum IL1RA concentrations were increased 6.5-fold in the obese patients (p < 0.001) these subjects experienced a significant decrease in IL-1RA 6 months after bypass surgery (p < 0.02) was also reported (p. 1185). The db/db mouse model provides an ideal model for leptin resistance in obesity. These mice have a point mutation within the leptin receptor gene. One scientific analysis of mice that lack this functional leptin receptor (db/db) suggests administration of leptin increases IL-1RA transcription in db/db mice in a similar fashion as in the hypothalamus of normal animals (Hosoi, Okuma, & Nomura, 2002). In a study of genetically obese rats, investigators found that administration of leptin caused a significant increase (p = .001) in the hypothalamic levels of IL-1, compared with placebo treated rats (Luheshi, Gardner, Rushforth, Loudin, & Rothwell, 1999). Peripheral administration of leptin also induced a rise in IL-1that was significantly higher than IL-1� levels of placebo treated animals. Injection of leptin into lean rats decreased food intake while injection of IL-1RA alone did not significantly affect food intake. The authors also discovered that coadministration of leptin and IL-1RA attenuated (by 60%) the suppression of food intake seen in leptin-treated rats, so that food intake was returned to within 70% of respective controls. These data support the concept that IL-1RA suppresses the affects of leptin in the hypothalamus.
26
Relationship Between Leptin and Chronic Inflammation Obesity is alternatively described as a chronic inflammatory state that may be linked to chronic disease. Chronic inflammation may be an indicator of long-term risk of the metabolic syndrome in obese teens. Research supporting this hypothesis showed increased proinflammatory cytokines IL-6 TNF and alpha, along with CRP levels in obese men (N = 198) (Mendall et al., 1997). Esposito and colleagues (2003) reported a comparative study of 50 obese and 50 non-obese women showing significantly elevated levels of IL-10—a potent antiinflammatory cytokine found in the obese women (Esposito et al., 2003). The authors stated that those with low levels of IL-10 had metabolic syndrome. Combined, these outcomes suggest that possibly anti-inflammatory cytokines offer some protection from certain chronic diseases. This supports a theoretical model for a compensatory mechanism in the body driving it toward homeostasis by antagonizing the affects of inflammatory cytokines. The association of a chronic inflammatory state with obesity has been described (Chida, Osaka, Hashimoto, & Iwakura, 2006; Loffreda et al., 1998). One study of mice genetically engineered to suppress IL-1 and IL-6, reported well-developed obesity within 6 months (Chida, et al., 2006). The study’s authors concluded that interaction between IL-6, IL-1, and IL-1RA is responsible for lipid metabolism (p. 976). Additionally, an animal-based in-vitro/in-vivo model of the effects of leptin on the secretion of cytokines suggests that leptin induces the secretion of several pro-inflammatory cytokines (Loffreda, et al., 1998). Further evidence suggesting that leptin induces the release of inflammatory markers in the human body was reported in a study of 20 healthy, normal-weight women of reproductive age by Canavan and colleagues (Canavan, et al., 2005). Study participants were enrolled in a randomized, double-blinded, placebo-controlled trial of leptin administration. The investigators
27
found that the inflammatory protein, C-reactive protein (CRP), showed a statistically significant increase (p = .04) in the treatment group compared to the control group (Canavan, et al., 2005). Leptin’s effects on IL-1ß and IL-1RA were studied further in human endometrial tissue isolated from women undergoing hysterectomy (Gonzalez, Leary, Petrozza, & Leavis, 2003). Functional leptin receptors were analyzed for effect on secretion of IL-1ß and IL-1RA. The authors learned that leptin, while acting through its functional receptor, triggers the secretion of IL-1ß and IL-1RA (Gonzalez et al., 2003). A blockade of the functional leptin receptor ameliorated the effect of leptin on the IL-1 system (Gonzalez et al., 2003). Later, Pinteaux and colleagues found that leptin induced the production of IL-1 and IL-1RA during an in-vitro examination of microglial cells (Pinteaux et al., 2007). Other research has implied that leptin also stimulates production of pro-inflammatory cytokines IL-6 and tumor necrosis factor in macrophages and circulating monocytes, both in animals and humans (Zarkesh-Esfahani et al., (2001). These studies collectively prompt the assumption that leptin only plays a role in the production of pro-inflammatory cytokines. Yet, further evidence suggests that while leptin promotes cytokine production, leptin is also stimulated by pro-inflammatory cytokines. Grunfeld and colleagues reported a study about the effects of IL-1, and TNF-alpha on Leptin mRNA expression (Grunfeld et al., 1996). Their animal model revealed that injection of these inflammatory cytokines increased leptin mRNA levels in adipose tissue, suggesting evidence of a feedback loop between leptin and inflammatory cytokines (Grunfeld et al., 1996). A secondary hypothesis for LR was generated for our study based on the previously described agonist/antagonist relationship that exists among cytokines when obesity is present. An
28
increase in levels of these cytokines may directly impede the physiologic effects of leptin (Luheshi, et al., 1999). Interferon-γ (IFN-γ) is one such pro-inflammatory cytokine that has been shown to activate the Jak2 receptor and associated tyrosine kinases. Little is known about IFN-γ and its relationship to obesity, the activation of the pathway in the arcuate nucleus, or LR. It is not known whether IFN-γ levels are very high in anorexia and an antagonistic relationship has been demonstrated with the anti-inflammatory cytokines IL-10 and IL-1RA. A study of human subjects with anorexia, bulimia and obesity found that IFN-γ levels became elevated in people with anorexia while remaining very low in obese people (Raymond et al., 2000). Additionally, a study of mice with induced myasthenia gravis revealed that IL-1RA suppressed IFN-γ and IL-6 (H. Yang et al., 2005). These studies described the suppressor-activator role of pro- and antiinflammatory cytokines in the body. The leptin receptor is found in the pro-inflammatory IL-6 family of cytokine receptors. This leads to the assumption that IL-1RA may block this receptor since it suppressed the IL-6 receptor (Luheshi et al., 1999; Raymond et al., 2000; H. Yang et al., 2005). Further evidence that leptin is associated with inflammatory and immune system processes was reported in obese children with a homozygous frame-shift mutation in the ob gene (ΔG133) (Farooqi et al., 2002). This mutation resulted in an unsecreted and truncated leptin protein. These children were significantly obese with profound abnormalities in T-cell function. Administration of leptin to the obese children resulted in secretion of primarily Th1 cytokines, which may in turn directly influence antibody production.
29
Interleukin-1 Receptor Antagonist (IL-1RA ) Interleukin-1 receptor antagonist is an anti-inflammatory cytokine released to antagonize pro-inflammatory cytokines in the body by binding molecules with IL-1 receptors. In this way the body maintains homeostatic balance. Multiple sites of IL-1RA production in the body include immune cells, epithelial cells, skin keratinocytes, stromal cells and adipocytes (most important to the current study) (Perrier, Darakhshan, & Hajduch, 2006). Action of IL-1 is inhibited by a naturally occurring receptor antagonist, IL-1RA , which blocks IL-1 from binding to its signaling receptor (Dinarello, 1997). Activation of IL-1 signaling in the brain serves as an important regulator of systemic host defense response to infection and inflammation (Horai et al. 1998; Josephs et al., 2000). This includes suppression of food intake and fever (e.g. increased thermogenesis) (Horai et al., 1998; Josephs et al., 2000). This evidence supports the idea that as a person’s weight increases, the body releases leptin to suppress appetite and increase the metabolism in its endless attempt to maintain homeostasis (Munzberg et al., 2005). It is possible that obesity causes an inflammatory response in the body: As inflammatory cytokines rise, the body releases anti-inflammatory cytokines to ameliorate the affects of the inflammatory process. Scientific evidence supporting this hypothesis includes a study of 20 morbidly obese non-diabetic people and 10 age- and sex-matched lean adults/children. The authors found a 6.5-fold increase in serum IL-1RA in the obese subjects. IL-1RA was also positively correlated in a linear manner with leptin levels (Munzberg et al. 2005). Ljung and colleagues reported that IL1-ra was correlated with leptin in both women with Rheumatoid Arthritis and their matched controls (Ljung et al., 2007). Luheshi and colleagues (1999) reported that the administration of IL-1RA into rats suppressed leptin induced expression of appetite decrease and temperature increase. Perrier and colleagues (2006) contended that IL30
1RA has both protective and deleterious effects within the body. They concluded that leptin mediates central resistance, increases adipogenesis, and elevated serum levels have been associated with DM-2 (p. 6291). IL-1RA has an important role in the body regarding adipogenesis and appetite control. Studies have documented that IL-1RA deficient mice are lean. Many researchers suspect this results from anorexogenic affects of IL-1 going unchecked (Somm et al., 2005). Another study reported adult onset obesity in mice lacking the IL-1R1 gene combined with resistance to the anorexogenic affects of leptin (Garcia et al., 2006). Luheshi and colleagues (1999) found that administration of IL-1RA into the brain of normal rats abolishes the anorexic effect of leptin. This evidence establishes the framework for hypothesizing that when inflammatory response increases with obesity, leptin receptors might be antagonized by IL-1RA, leading to hyperleptinemia (see Figure 1). Mean Arterial Pressure (MAP) and Left Ventricular Hypertrophy (LVH) A number of research studies form the basis for a secondary hypothesis: LVH in obese children may be associated with BP rather than leptin resistance. As discussed earlier, LVH may be an adaptive response by the body to increased chamber wall stress. Hypertension has been found to be a significant predictor of LVM in adults and children. Several studies in adults and children have demonstrated that obesity is a predictor of LVM independent of BP (Kono et al., 1994; Paolisso et al., 2001; Rasooly & Rasooly, 1996; Yoshinaga et al., 1995). However, Feola et al., in a study of 35 adults with untreated essential hypertension and LVH found that systolic blood pressure was significantly correlated with LV-mass. According to Alpert (2001), ventricular hypertrophy in obesity is related to an increase in blood volume and cardiac output. Increased blood volume increases preload and systemic vascular resistance. Thus, the heart
31
stretches more during diastole and pumps harder during systole. Alpert (2001) concluded that increased cardiac output and blood volume leads to ventricular dilation and increased wall stress resulting in hypertrophy of the cardiac muscle as a compensatory mechanism. Several studies have linked hypertension to increased LVM. Adolescents with essential hypertension (N = 175) were reported to have cardiovascular damage that included increased LVM (Litwin et al., 2006). Blood pressure and central adiposity were independently associated with an increase in LVM in a sample of 399 obese adults (Norton et al., 2009). Research in children shows that MAP is statistically associated with IL-1RA , insulin, and leptin levels (Mauno, Hannu, & Esko, 2008; Rosello-Lleti et al., 2009). These results allow the assumption that BP is more closely associated with LVH in children than previously thought. A study of normotensive rats found that the infusion of IL-1β was associated with bradycardia and hypotension providing even stronger support for the existence of this association (Mollace et al., 2001). Recall that IL-1RA is produced abundantly by white adipose tissue (Somm et al., 2005). Adiponectin, an adipose derived secretory protein, suppresses inflammatory response by inducing the production of IL-1RA and IL-10 (Wolf et al., 2004). Adiponectin is an adipocyte-specific protein, that stimulates nitric oxide production (Pena et al., 2009). Nitric oxide binds with vascular endothelium causing vasodilatation. A study of 88 obese children found they had lower circulating levels of adiponectin (Pena et al., 2009). Another study of 59 obese adults detected a negative correlation between adiponectin and LVM (Ebinc et al., 2008). One is led to deduce that IL-1RA production in obese people may be an antagonist of another process. One explanation may be that IL-1β, which normally has significant anorectic effects, is quite elevated in obese people, prompting IL-1RA secretion in response as a compensatory mechanism. IL1RA has been shown to mediate the function of inflammatory cytokines (H. Yang et al., 2005),
32
and may lead to an increase in BP by blocking the effects of adiponectin or antagonizing the hypotensive effect of IL-1β. A study of 250 hypertensive patients (142 with LVH, 109 without) reports that individuals with LVH had increased cytokine levels (Rosello-Lleti et al., 2009). A prospective study of middle-aged normotensive men and women (N = 396, 249) found that those with elevated baseline cytokine levels of IL-1β and IL-1RA were more likely to develop hypertension within six years (Vanhala, Kautiainen, & Kumpusalo, 2008). Other research supports the agonist/antagonist effect theory of inflammatory cytokines and IL1-RA on BP. In a study of rabbits injected with S. epidermidis to induce hypotensive shock, rabbits infused with IL1-RA showed increases in MAP and systemic vascular resistance compared to non-infused specimens (Aiura, Gelfand, Burke, Thompson, & Dinarello, 1993). Prolonged exposure to elevated arterial BP leads to an increase in LVM. Examining MAP as an independent factor in LVH in obese children and adolescents is a characteristic difference between this study of pediatric patients and previous adult studies showing that leptin was an independent determinant of LVM despite BP (Kono et al., 1994; Paolisso et al., 2001; Yoshinaga et al., 1995) Rasooly & Rasooly, 1996; Paolisso et. al, 1999). Figure 4 explains this process.
33
Adipose Tissue IL-1RA
Hypertension
LVH
Leptin
Blockade
Elevated Inflammatory Cytokines (TNF-α, sTNF-R1, IL-6, IL-1β)
Adiponectin
NO3
Vasodilation Figure 4: Alternative Hypothesis for LVH
34
Summary Obesity is rapidly gaining recognition as a top preventable cause of morbidity and mortality in the United States, where 21% of the U.S. annual healthcare expenditure can be attributed to the epidemic (Cawley & Meyerhoefer, 2012). Leptin is an adipokine secreted in an effort to increase metabolism and decrease appetite. Contrasting with results from animal-based models, obese humans have elevated levels of leptin, and the metabolic affects of leptin are not present in obese humans. This concept is also known as leptin resistance. Some animal models include genetically modified specimens designed without the ability to manufacture leptin. This allows researchers to explore long-term effects of leptin deficiency in the body. Leptin deficiency has been suggested as a cause of cardiac left ventricular hypertrophy. In obese adult humans the phenomenon of LVH has been associated with LR. There are no studies reported in scientific literature documenting this phenomenon in obese children and adolescents. There are many theoretical causes for LR. Methodology for measuring LR has not gained a common consensus still. This study explored the likelihood that left ventricular hypertrophy— as a direct result of leptin resistance—is associated with the anti-inflammatory cytokine interleukin-1 receptor antagonist. No previous studies have investigated this possibility in human models. The current research also seeks to answer the question of whether or not LVH is associated with an increase in BP present in obese children and adolescents, and evaluated the possibility of an association between IL-1RA and hypertension.
Specific Aims Aim 1: Demonstrate that leptin explains a significant proportion of the variance in left ventricular mass in obese children and adolescents. 35
Aim 2 - Demonstrate that IL-1RA is related to LV-mass and that leptin mediates this relationship in obese children and adolescents. Aim 3: Demonstrate that mean arterial pressure explains a significant proportion of the variance in left ventricular mass in obese children and adolescents. Aim 4: Demonstrate that IL-1RA explains a significant proportion of the variance in Mean Arterial Pressure in children and adolescents.
36
Chapter 3 Methods
Overview This study used a descriptive cross-sectional design consisting of two parts. First, to determine whether an association existed between IL-1RA and LVM mediated by leptin, LVM, IL-1RA, and leptin levels were measured in a sample of obese children and adolescents (n = 20). In part, the aim was to determine if lack of reception of leptin at the cellular level (leptin resistance) leads to an increased LVM; suspect that IL1-RA inhibits leptin expression. To determine whether or not LVH was associated with IL1-RA, a sample of 20 children from a primary-care clinic (PCC) in a suburban-metropolitan city in the western United States were evaluated. To do this leptin, IL1-RA, and insulin and LVM measured by echocardiogram were simultaneously measured. Second, to determine whether or not MAP accounts for a proportion of the variance in LVM among children, MAP and IL-1RA were compared between a group of obese children and a group of normal weight children. Finally this study tested the hypothesis that IL-1RA is significantly correlated with MAP. Study Design Part 1 of this study focused on children aged ten to 17 years of age with a BMI greater than or equal to the 80th percentile when accounting for age and sex. This subsample represented a group of children with obesity. Three participant-recruitment procedures were used: 1) A letter describing the study was mailed to the families of a PCC asking parents to telephone if they were interested in having their child participate in the study. Out of over 3,000 letters mailed, 103 (3.4%) respondents called the PCC to enroll. The respondents heard a summary explanation of
37
the study by telephone, and were invited to make an appointment for an enrollment evaluation. Of the respondents who called, 37 (1.2%) scheduled an enrollment evaluation appointment. Twelve respondents of the 37 people who participated in enrollment evaluation appointments qualified to participate and gave informed consent; 23 were not interested and 2 did not meet inclusion criteria. Of the 12 participants, one subject did not complete data collection. Exclusion criteria prohibited children from participating who had known chronic inflammatory disease (e.g. asthma, juvenile rheumatoid arthritis, diabetes, Hashimoto’s thyroid disease, collagen vascular disease) or any genetic disorder known to contribute to obesity (e.g. trisomy 21, Prater Willi syndrome, or metabolic deficiency), sleep apnea (often associated with RVH), and hypertension. Of the 37 patients who presented for an enrollment evaluation appointment, two were excluded due to asthma. The primary care providers in the clinic were educated to the study criteria and the patients’ designated primary care provider was the only person to perform a computerized or hard copy medical record review. After evaluation of the patient’s history during routine clinic visits, the primary care providers described the study to the parents and, if interested in learning more about the study, provided them with the letter described in the first approved procedure, describing the research and how to contact the investigator. Once contact was made, it was determined if the subject was eligible and the study was described in further detail. The last approved method of recruitment was for direct contact of potential subjects by the researcher during the subjects regular primary care visits with him. All procedures regarding the information letter, eligibility, and contact were followed by the researcher. Nine of the 20 study participants (42.9%) were recruited through learning about the study during a routine visit to the clinic.
38
Procedures Part 1 Once interest was expressed and initial contact was made with the researcher an appointment was scheduled with the potential child subject and the parent or guardian to describe the study procedures and obtain informed consent. The study’s potential risks and benefits were described in detail. For those participating in the first part of the study, the research was described as a project to evaluate the thickness of the child’s heart muscle in association with the hormones insulin and leptin, and a chemical in the body called interleukin 1 receptor antagonist. Those participating in the second arm of the study were told that IL-1RA was being measured to explore whether there was a correlation with mean arterial pressure. The parent/guardian and child subject were informed that the study would not help the child lose weight or determine how to help weight loss. Whereas no known harmful side-effects could result from the study, parents/guardians were informed that if any health problems were identified, particularly in the echocardiogram, the results would be immediately provided to the child’s primary care provider for prompt, appropriate follow-up. Written informed consent and assent were obtained from the parent/guardian and child subject, respectively. Once written consent and assent were obtained, a review of the study criteria was conducted with the parent/guardian to confirm the child for qualification. As part of the written consent, the parent/guardian was asked for consent to review past medical records of the child in the event the medical history required clarification. The child’s weight, height, and demographic information were obtained and appointments were scheduled for obtaining fasting serum samples and an echocardiogram. Each child subject received two movie tickets for participating. Figure 3 summarizes the procedures. For part 2 of the study, Oregon Health and Science University granted IRB approval to sample 30 more patients collecting data on BMI of normal weight subjects, MAP, and fasting IL-
39
1RA levels. Study participants were recruited from the patient registry of a pediatric PCC by the researcher in a similar manner explained above for children recruited by the researcher personally during the subjects’ regular primary care visits with him. Many patients were approached to participate during routine appointments. The majority of those who did not participate, refused due to fear over a blood draw. All procedures regarding eligibility and contact were followed by the researcher. Children aged 10 to 17 years were screened for eligibility and chronic conditions prior to inquiring about their interest in participation. For part 2 of the study, BMI categorization was not applied to the group in order to have greater variance for this measure. Individuals in this group were classified by actual weight—a continuous variable. The second part of the study built upon the results of the first and included those initial 20 subjects. Therefore the second part of the study had a sample of fifty children and adolescents to address the subsequent aims.
40
Primary Care Clinic
Parent receives letter in mail (n=3000) describing study and contacts Dallen Ormond for further details (n=103) If parent and child were interested further an appointment was scheduled (n=37) where a full description was given medical history reviewed and the consent/assent process done if parent and child wanted to continue and study qualifications are met.
Approached by PCP during routine visit (Not Tracked). Study qualifications reviewed prior to approach. Study described, given written materials. (n=9) subjects part 1 & n=30 from part 2) (Part 2 used this approach only).
Not Interested
Confirmatory Screen (n=39)
No Further Contact
Not interested n= 23. Not qualified n=2.
Confirmatory Screen (n=12)
No Further Contact
In person interview Assent/Consent signed (n=50).
One patient failed to complete.
Fasting Labs
Cardiology (Part 1 only)
Medical records available if discrepancies occur.
Figure 5: Study Participation, consent, and qualification model.
41
Variables Demographics. Demographic information was obtained to describe the study sample, including Race/Ethnicity (measured by self report categorized as Latino/Hispanic, Native American/Alaskan Native, Asian, Native Hawaiian or Pacific Islander, White/Non-Hispanic, and African Decent), age in years, and gender (male/female) were data collected on each child. Body composition. Weight and height were measured with a standardized electronic scale and stadiometer. BMI was calculated using standardized methods: weight [kg]/ [height (m)]2. Mean arterial pressure (MAP).Blood pressure was assessed using a Dynamap automated blood pressure monitor. Mean arterial pressure is approximated by: (2 x diastolic pressure) + systolic pressure/3. LV-Mass. For the twenty subjects in the first phase of the study, LV-Mass measurements were made using echocardiographic methods validated for children with normal hearts based on the following formula: (gm) = 0.80 [1.04 x [1.04 x [(IVSD + LVIDD + LVPWD)3 – (LVEDD)3] + 0.06] where IVSD = intraventricular septal dimension, LVIDD = LV internal dimension during diastole, and LVPWD = LV posterior wall dimension (Daniels, Meyer, et. al., 1988). Echocardiograms were performed by a board certified pediatric echocardiographer. Leptin. Leptin was measured using the Human Leptin RIA Kit (Linco Research, USA). The required sample volume was 100 microliters of serum. This sample was a fasting sample with a minimum fast of 8 hours. Specificity of human leptin was measured at 100% compared to other hormones and other mammalian leptin serum tested. Analysis was performed by the University of Utah, Government Clinical Research Center. Cytokines. Fasting IL-1RA was evaluated using a Lincoplex cytokine assay. Sensitivity was 0.5-16 pg/ml, using Luminex technology. These tests are considered the standard for
42
measurement within the industry (Linco Research, USA). This analysis was performed at the University of Utah, Government Clinical Research Center for the subjects in the first arm of the study and the analysis for the second group of subjects was performed at Oregon Health and Sciences University using the same protocol. Statistical Analysis All variables were evaluated for normality and outliers. The joint distributions of the study variables were evaluated for linearity in accordance with the assumptions of multiple regression analysis. Aim 1: Demonstrate that leptin explains a significant proportion of the variance in left ventricular mass in obese children and adolescents. This hypothesis was tested on the initial sample, n = 20, through regression analysis of leptin as a predictor of LV-mass. Covariates in this model included age and gender. Aim 2 - Demonstrate that IL-1RA is related to LV-mass and that leptin mediates this relationship in obese children and adolescents. To test this hypothesis, Sobel’s method for testing mediation was planned (McKinnon et al., 2005). Two regression analyses were conducted on the initial sample, n = 20. In the first, IL1RA was the independent variable and leptin was the dependent variable. In the second, leptin was the independent variable and LV-Mass was the dependent variable. The regression weight for IL-1RA from the first regression was multiplied by the regression weight for leptin from the second regression. The planned analysis was to take the product of these scores to give the mediated or indirect effect of IL-1RA through leptin on LV-mass. The following formula was to yield a z-score (McKinnon et al, 2005): [αβ/SQRT(α2σ2β+β2σ2α) Z-score] in which α is the regression coefficient from the first regression (IL-1RA regressed on leptin), β is the regression
43
coefficient from the second regression (leptin regressed on LV-mass), σ2β is the standard error of leptin regressed on LV-mass, and σ2α is the standard error of IL-1RA regressed on leptin. Covariates to be included in this model were BMI, gender, and age. Aim 3: Demonstrate that mean arterial pressure explains a significant proportion of the variance in left ventricular mass in obese children and adolescents. This hypothesis was tested on the initial sample, n = 20, through regression analysis of MAP as a predictor of LV-mass. Covariates in this model included age, BMI, and gender. Aim 4: Demonstrate that IL-1RA explains a significant proportion of the variance in Mean Arterial Pressure in children and adolescents. This hypothesis was tested on the full sample, N = 50, through regression analysis of IL1RA as a predictor of MAP. Covariates in this model included age, BMI, and gender.
44
Chapter 4 Results In this chapter, the characteristics of the sample will be described for the initial and the total sample. The results of the first three aims, analyzed for the initial study sample of n = 21, will then be reported. The final results for the total sample, N = 50, with then be described. . Characteristics of the Sample The study sample was mostly Caucasian (86%), with only three Hispanic and Asian Americans, respectively, and one African American. The initial sample was comprised of 11 males and 9 females and had limited diversity; see Table 1a.The full study sample consisted of 28 males and 23 females. The mean age of those involved in the full study was 12.35 (sd = 2.13) years old; girls were, on average, 2 years younger than boys. See Table 1b. Table 1a Descriptive Statistics by Gender (n = 20) Variable
Males
Females
Total Sample
n=9
n = 11
Age (mean, sd)
12.45 (2.25)
12.22 (2.10)
12.35 (2.13)
Race/Ethnicity
n (%)
n (%)
n (%)
Caucasian
8 (40%)
9(55%)
17 (85%)
Hispanic
0
1 (5%)
1 (5%)
African American
1 (5%)
0
1 (5%)
Asian/Pacific Islander
2 10%)
1 (5%)
3 (15%)
45
Table 1b Descriptive Statistics by Gender (N = 50) Variable
Males
Females
Total Sample
n = 28
n = 22
N = 50
Age (mean, sd)
13.3 (2.14 )
11.4 (2.47 )
12.35 (2.13)
Race/Ethnicity
n (%)
n (%)
n (%)
Caucasian
23 (45%)
21(41%)
45 (86%)
Hispanic
2 (3.5%)
1 (2.5%)
3 (6%)
African American
1 (2.5%)
0
1 (2%)
Asian/Pacific Islander
2 (3.5%)
1 (2.5%)
3 (6%)
For this study BMI served as a continuous variable, the exception was when the subjects BMI was categorized as obese vs, non-obese. Obese BMI was categorized as >24.5 for all ages. Because this was the value was equal to or exceeded the 85th percentile and is considered overweight for all ages. The BMI for the first 20 subjects ranged from 19.7 to 45.2 kg/m², and averaged 29.68 (sd = 7.65) kg/m²; the average BMI for this subsample was above the 80th percentile for BMI for age. The second 30 subjects were not selected for obesity and their BMI ranged from 15.6 to 34.3 kg/m², with an average BMI of 20.6 (sd = 4.29) kg/m². For the total sample then, the average BMI was 24.13 (sd = 7.38) kg/m². Mean arterial pressure (MAP) ranged from 68.7 to 102.0 for the total sample, and averaged 85.65 (sd = 7.32); for the initial sample of n = 20, MAP ranged from 79.3 to 98.0, and averaged 85.03 (sd = 7.65), for the second sample range 73.3-102.0, mean- . Within the total sample, the average MAP in boys was 85.26, and 85.10 in girls. Mean IL-1RA in the total sample was 552.34 (sd = 414.88) pg/ml; the averages by gender were comparable. The obese group with BMI > 24, by gender, revealed
46
MAP averages above the 95th percentile: 950.82 pg/ml for boys and 852.56 pg/ml for girls. See Table 2. Table 2a BMI, MAP, and IL 1-ra values for the subgroups. Variable BMI (mean, sd) MAP (mean, sd) IL1-ra (mean, sd)
Part 1: n = 20 29.68 kg/m² (7.65) 85.03 (7.32) 907.15 pg/ml (455.18)
Part 2: n = 30 20.6 kg/m² (4.29) 84.62 (7.96) 315.80 pg/ml (101.95)
Table 2b BMI, MAP, and IL 1-ra values for the total sample (N = 50). Variable BMI (mean, sd) MAP (mean, sd) IL1-ra (mean, sd)
Males 23.93 kg/m² (7.67) 84.25 (8.39) 552.02 pg/ml (499.65 )
Females 24.43 kg/m² (6.99) 85.58 (6.83) 552.75 pg/ml (284.01)
Total 24.13 kg/m² (7.38) 85.65 (6.32) 552.34 pg/ml (414.88)
N = 50 Leptin, insulin, and LV-Mass were assessed in the initial sample only (n = 20). Levels of leptin ranged from 10 to 78.3 averaged 34.2 (sd = 17.9) ng/ml; males averaged 30.4 ng/ml (sd = 11.8) whereas girls averaged a higher leptin level at 38.9 (sd = 23.2) ng/ml in females. These values are in contrast to normal mean leptin values of 3.4 ng/ml +/- 3.1 ng/ml (Haqq et al., 2003). Normal insulin levels are considered to be less than 120 pmol/L. Mean insulin levels for the initial sample ranged from 2.3 to 24.5 pmo/L, and averaged 12.49 (sd = 7.53) pmo/L; the average was lower for study boys at 12.3 (sd = 6.7) pmo/L and was higher for study girls at 12.7 (sd = 8.87) pmol/L. LV-Mass (LVM) ranged from 27.5 to 100.1, and averaged 60.1 (sd = 13.9). See Table 3.
47
Table 3 Leptin, Insulin, and LVM for the initial sample (n = 20) and by gender. Variable Leptin (mean, sd) Insulin (mean, sd) LVM (mean, sd) (n=21)
Males
Females
Total
30.4 ng/ml (11.8) 12.3 pmol/L (6.7) 59.42 g/m² (18.21)
38.9 ng/ml (23.2) 12.7 pmol/L (8.87) 57.72 g/m² (12.33)
34.2 ng/ml (17.9) 12.49 pmol/L (7.53) 60.1 g/m² (13.9)
Using obese vs. non-obese as a grouping variable for differences of the variables between the two populations. BMI levels (> 24.5 vs. < 24.5 ) as the grouping variable (see Table 4), t-test was used to assess for differences between groups on leptin, insulin, and LVM; no significant differences were revealed. For the entire sample (N =50), t-test demonstrated a significant difference in IL-1RA levels between the groups (t (50) = 4.386, p = 0.001) but no difference was found in MAP.
Table 4 Descriptive Statistics by BMI Group
Leptin Insulin LVM IL-1RA MAP
BMI >= 24.50 < 24.50 >= 24.50 < 24.50 >= 24.50 < 24.50 >= 24.50 < 24.50 >= 24.50 < 24.50
N 16 4 16 4 17 4 20 30 21 30
Mean 33831.25 35850.00 13.07 10.15 59.84 53.4 821.41 372.97 86.60 83.630
Std. Deviation 17791.30 20850.30 7.11 9.84 16.07 12.05025 497.72 212.89 8.15 7.22
48
Relationships between IL 1ra, Leptin, and LV-Mass
Correlation analysis was carried out among the study variables for the initial sample; see Table 5. The level of significance was set at (p < .05). Cohen's benchmark for effect size was also used to evaluate the strength of these correlations. Effect sizes are a family of indices that quantify the magnitude of a relationship between an independent and dependent variable (Cohen, 1988), and may be evaluated as small (.2), medium (.5) or large (.8).After data collection on the first 20 patients was completed, effect sizes were used to evaluate the first three study aims that concerned LV-Mass.
Table 5 Correlations among Study Variables for Initial Sample (n = 20) LVM
Leptin
IL-1RA
LVM Leptin
.024
IL-1RA
.260
.217
*p< .05
The first aim of this study was to determine whether LVH in obese children and adolescents is related to leptin resistance. Since LVH is a diagnosis based on an elevated LVMass, LV-Mass was the dependent variable in the study. It was hypothesized that LV-Mass could increase as leptin increases, suggesting that elevated leptin levels were due to blockade of the leptin receptor by IL-1RA (leptin resistance). The small effect size associated with a correlation of r = .024, p = .46 does not support this hypothesis.
49
The second aim of the study was to see if leptin mediated the predictive relationships between IL-1RA and LV-Mass. This aim could not be supported because effect sizes did not reveal a significant relationship (r = .26, p = .13). Therefore, because steps one and 2 of the mediator analysis did not show a significant correlation a regression analysis could not be completed and step 3 was not possible. This aim could not be supported. The third aim of the study was to assess whether MAP predicted LV-Mass and explained a significant portion. However, correlation analysis revealed a small to moderate effect for MAP on LV-Mass, r = .36, that was not significant (p = .06). Therefore, this aim was not supported. Correlations among Study Variables The correlations among all the study variables were reviewed in a post hoc exploratory analysis for the initial sample; see Table 6. Several correlations demonstrated a moderate to large effect size. There was a statistically significant positive correlation between body mass index and LV-Mass (r = .46, p = .018) representing a moderate effect size. Body mass index was also positively correlated with age (r = .70, p = .001) and mean arterial pressure (r = .50, p = .01), in the total sample, and leptin (r = .56, p = .005) and insulin (r = .57, p = .01) in the smaller initial sample. These correlations represent moderate effect sizes. Mean arterial pressure yielded a large correlation with IL-1RA (r = .75, p = .001) in the total sample and, in the initial sample, a moderate correlation with leptin (r =.50, p = .01). Given the large correlation between BMI and age, the partial correlations were assessed when controlling for age (see Table 6b). The partial correlations remained comparable with the exception of that between BMI and MAP, which was positively strengthened, r = .65, p = .01.
50
Table 6a Correlations Among Study Variables (n =20) LVM MAP BMI Age Leptin
MAP BMI Age Leptin Insulin IL1RA *p< .05 ** p