Hydrol. Earth Syst. Sci., 13, 1567–1582, 2009 www.hydrol-earth-syst-sci.net/13/1567/2009/ © Author(s) 2009. This work is distributed under the Creative Commons Attribution 3.0 License.
Hydrology and Earth System Sciences
Landscape scale patterns in the character of natural organic matter in a Swedish boreal stream network 1 , S. Karlsson1 , B. Allard1 , S. K¨ ¨ J. Temnerud1,* , A. Duker ohler2 , and K. Bishop3 1 Man-Technology-Environment Research Centre, Orebro ¨ ¨ University, Orebro, Sweden 2 Dept. of Applied Geosciences, Technical University of Graz, Graz, Austria 3 Dept. of Aquatic Sciences and Assessment, Swedish University of Agricultural Sciences, Uppsala, Sweden * present address: Dept. of Aquatic Sciences and Assessment, Swedish University of Agricultural Sciences, P.O. Box 7050, 75007 Uppsala, Sweden
Received: 27 March 2009 – Published in Hydrol. Earth Syst. Sci. Discuss.: 17 April 2009 Revised: 19 August 2009 – Accepted: 19 August 2009 – Published: 3 September 2009
Abstract. This paper defines landscape-scale patterns in the character of natural organic matter (NOM) and tests for relationships to catchment soil, vegetation and topography. The drainage network of a boreal catchment, subcatchment size 0.12–78 km2 , in Northern Sweden was sampled in August 2002 during a period of stable low water flow. The NOM was characterized with UV/Vis spectroscopy, fluorescence, XAD-8 fractionation (%humic substances), gel permeation chromatography (apparent molecular weight), and elemental composition (C:N). The largest spatial variation was found for C:N, absorbance ratio, and specific visible absorptivity. The lowest variation was in fluorescence index, %humic substances and molecular retention time. The variation in total organic carbon (TOC), iron and aluminium concentration was more than twice that of C:N. Between headwater and downstream sites no significant changes were distinguished in the NOM character. At stream reaches, junctions and lakes little change (60%) in these catchments, followed by peat (17 to 26%). The most common soil type is podzol with a mean humus layer thickness of 7 cm (Ivarsson and Karlsson, 1992). The riparian zone is often comprised of peat of varying thickness. The mean annual temperature is 1.0◦ C, the precipitation is 650 mm (30–45% as snow) with an annual mean discharge of 350 mm and a calculated evapotranspiration of 300 mm (Alexandersson et al., 1991 and subsequent unpublished data). Forests (approximately 82%) and mires (approximately 18%) dominate the landscape of this catchment, and there is almost no agriculture. Lakes in the area could be classified as www.hydrol-earth-syst-sci.net/13/1567/2009/
J. Temnerud et al.: Swedish boreal landscape scale pattern in the stream character of NOM polyhumic oligotrophic lakes. The dominant forest types are mixed stands of Norway spruce (Picea abies) and Scots pine (Pinus silvestris) with a minor contribution of hardwoods, mainly birch (Betula spp.). There is little overt human influence beyond low-intensity forestry. The landscape has soil frost during winter, but the extent of soil frost varies between years and is heterogeneously distributed in the landscape (Nyberg et al., 2001). The Ottervattsb¨acken stream (O) has two main branches, the western Hammonsb¨acken (O1, area 28 km2 ) and the eastern Marrab¨acken (O2, area 22 km2 ) (Fig. 1). About one third of the catchment (30%) is situated above the highest post-glacial coastline at approximately 232 m a.s.l. Minor amounts of fine grained materials, clay-silt, are found downstream from the highest post-glacial coastline. The area of arable land is small (1.6%) and lies downstream of O1 and O2, and does not influence O1 and O2. The two branches differ slightly with respect to lakes, soils and land-use: O1 has a greater percentage of lake surface coverage (4%) and sand (8%) than O2; which has 2% lakes and 0% sand. The O2 branch has a greater percentage of wetland (25%) and peat (26%) than O1, which has 10% wetland and 19% peat. Headwaters had higher median TOC-concentration (24 mg L−1 ) than downstream (15 mg L−1 ). For more details of catchment characteristics see Table 1 in Temnerud and Bishop (2005).
samples were run in a random order. The pH was measured without stirring with an electrode designed for low ionic strength waters (Orion model 9272). Both pH and electric conductivity (conductivity meter SDM 2010) were measured at 20◦ C (water bath) on the day of sampling. Unfiltered samples for metal analysis were preserved by addition of concentrated nitric acid (re-distilled from reagent grade acid) to a final concentration of 1% v/v (0.14 M). Metals were analyzed using ICP-MS (Agilent 4500) equipped with an ultrasonic nebulizer (U-6000 AT+ , CETAC). Alkalinity was measured according to a slight modified international standard by end-point titration with HCl (0.02 M) to pH 5.6 (international standard is pH 5.4 (EN ISO 9963-2)). The TOC-concentrations were quantified with a Shimadzu TOCV (combustion at 680◦ C) within a week after sampling. It has previously been shown that dissolved organic carbon (DOC) ¨ and TOC differ by less then 5% in the region of the River Ore (Ivarsson and Jansson, 1994a; K¨ohler et al., 1999), so TOC is essentially identical to DOC in these waters. Please note that samples for TOC and NOM characterization were not acidified or frozen. Storage of samples from boreal headwater sites has been found not to affect TOC concentrations when protected from light even when stored at room temperature for 12 days (cf. K¨ohler et al., 2002a). 3.2.1
3 3.1
UV/Vis spectra
Methods Sampling
The stream network of the Ottervattsb¨acken catchment was sampled during 19–22 August 2002. Sampling was performed approximately 10 m upstream and downstream of almost every stream junction (90% of those identified on the national 1:50 000 land-use maps and with running waters). A total of 63 sites were included, 19 of which were headwaters. Of these 63 sites, 31 were from O1 (10 of which were headwaters) and 27 were from O2 (9 of which were headwaters). Sites not in either O1 or O2 are denoted O3 (5 sites). On each sampling day, the runoff was measured at a site with a known stage-discharge relationship (H. Ivarsson, personal communication, 2000) close to the outlet of O (marked with a star in Fig. 1). This was complemented with discharge measurements at 41 sites using salt dilution where feasible immediately after the water sample was taken. Discharges for the remaining 22 sites were modelled (Temnerud et al., 2007). 3.2
1569
Chemical analysis
Samples were stored in the dark at 4◦ C prior to analysis. Analyses were performed within one week, with the exception of those related to XAD fractionation. Those more timeconsuming analyses were performed within one month. The www.hydrol-earth-syst-sci.net/13/1567/2009/
UV/Vis absorbance spectra in the range 190–1100 nm (1 nm interval) were recorded with a HP-DAD (diode array detector) 8453 E spectrophotometer using a 1 cm quartz cuvette. Before measurement, the filtered (0.22µm, Osmonics, the polycarbonate filters were pre-rinsed with water) samples were diluted 1:1 with 50 mM sodium phosphate buffer, pH 6.8 (Pettersson et al., 1994). The stability of the instrument was checked by running a reference solution of water after every 10 samples. Specific Absorption Ratio (SAR) is the ratio between the absorbance at 254 (A254 ) and 420 (A420 ) nm (cf. Vogt et al., 2004). The natural logarithm of the absorbance coefficients between 254–550 nm plotted versus wavelength can be approximated by a linear function (Davies-Colley and Vant, 1987), and the slope, S, is used to characterize NOM (Bertilsson and Tranvik, 2000). The aromaticity can be estimated spectrophotometrically from the specific ultraviolet absorbance (SUVA) or the molar absorptivity (εa ). SUVA is A254 normalised by the TOC-concentration (Reckhow et al., 1990). The molar absorptivity at 280 nm was also used (Chin et al., 1994). The absorbance A420 was also normalised by the concentration of TOC, hereafter denoted SVA (specific visible absorbance) (K¨ohler et al., 2002a).
Hydrol. Earth Syst. Sci., 13, 1567–1582, 2009
1570
J. Temnerud et al.: Swedish boreal landscape scale pattern in the stream character of NOM
Table 1. Map material used in FA- and PLS-analysis. Abbreviation
Explanation
Land-use map
Scale 1:20 000
Arable Clear cuts Forest Lake Open land Pasture (%) Mire
Arable field (%) Forest clear cuts (%) Coniferous and mixed forest coverage (%) Lake surface coverage (%) Other open land (%) Pasture (%) Mire (%)
Soil map
Scale 1:50 000
Clay Gravel Peat Rock Sand Silt Thin soil Till
Clay, glacial/post glacial clay (%) Gravel (%) Wetland, peat bog and mud (gyttja) (%) Archaean rock (%) Sand (%) Silt glacial/postglacial/unspecified (%) Thin or incoherent soil surface (%) Till with clay content less than 15% (%)
kNN-database
3.2.2
Birch F Age F Height Pine Spruce
The volume of birch within the subcatchment (m3 ha−1 ) The age of the forest stand (years) Average height of the forest (m) The volume of Scots pine within the subcatchment (m3 ha−1 ) The volume of Norwegian spruce within the subcatchment (m3 ha−1 )
Constructed
variables
Highest coastline Mean elevation Drainage density Highest elevation Lowest elevation Sinuosity Stream length Slope Slope B Total stream length
Percentage of catchment above the highest postglacial coastline (%) Mean elevation for the subcatchment (m a.s.l.) Stream length divided by area (km−1 ) Highest elevation for the subcatchment (m a.s.l.) Lowest elevation for the subcatchment (m a.s.l.) Stream length divided by the shortest distance between sites Stream length for the subcatchment (km) Slope across the actual stream length (%) Slope across the shortest distance between sites (%) The total stream length (km)
Gel permeation chromatography
Gel permeation chromatography (GPC) was performed with an HP Series 1100 (HPLC) equipped with a TosoHaas silica gel column (TSKgel G 2000 SW 7.5×300 mm, guard column 7.5×75 mm) and a mobile phase of 50 mM sodium phosphate buffered at pH 6.8. Each sample was filtered (0.22 µm) and the filtrate was diluted (in the vials) 1:1 with the mobile phase. The solutions were then run in duplicates, with an injection volume of 100 µl, a flow 0.6 ml min−1 and a column temperature of 20◦ C. The chromatograms were recorded with a diode array detector (HP G1315A DAD, nominal resolution 1 nm, sampling frequency 2 Hz). Absorbance at 254 nm was used to detect NOM. After every Hydrol. Earth Syst. Sci., 13, 1567–1582, 2009
tenth sample a well characterized stream fulvic acid, Siikajoki (Pettersson et al., 1997), at 50 mg L−1 (as well as one time at 10 and 100 mg L−1 ) was run. Polystyrene sulfonate standards (American Polymer Standard Corporation and Fluka) were used for calibration (1,200, 4,400, 5,900, 28,200 and 37,500 Da). A cumulative Weibull function was fitted to the calibration data (Weibull, 1951). The results are given as number-mean molecular weight (Mn ), weight-mean molecular weight (Mw ) and the ratio Mw /Mn , which is a measure of the polydispersity (Swift, 1989). The molecular weight at maximum peak height is denoted Mp , GPC-area is the total peak area, GPC-height is the height of the peak and GPC-time is the retention time. The main peak height was normalised with the total GPC-area (GPCSUVA ). The www.hydrol-earth-syst-sci.net/13/1567/2009/
J. Temnerud et al.: Swedish boreal landscape scale pattern in the stream character of NOM analysis of the Siikajoki standard indicated that these measurements were reproducible within an acceptable precision. Median of the ten subsamples (each 50 mg L−1 ), with robust coefficient of variation (CV , for explanation see Statistical methods section) in parentheses: GPC-time 18.7 min (0.3), GPC-area 53 mV ml (8.6), GPC-height 13 mV (9.1), Mp 2.22 kDa (1.3), Mn 1.30 kDa (2.5), Mw 2.33 kDa (0.9) and polydispersity 1.79 (3.0). To measure the GPC fluorescence index, GPCFLD , defined as the ratio of emission intensity at 450 and 500 nm, excitation at 370 nm (McKnight et al., 2001), a fluorescence detector (HP G1321A FLD) was appended to the DAD. The emission spectrum between 400 nm and 550 nm was recorded (step 2 nm and read time 3.1 s per spectrum). The fluorescence readings were corrected for background Raman scattering. The elution time with the highest emission at 400 nm was used. 3.2.3
Fluorescence spectra
A Spex FluoroMax-2 fluorospectrophotometer was used for fluorescence measurements. All samples were diluted to 5.0 mg L−1 DOC with water. The samples were excited in the range of 250–400 nm at 15-nm increments. The resulting emissions were recorded in the range 400–550 nm at 1nm increments. Variations in xenon lamp intensity were accounted for by normalizing the fluorescence signal to a reference signal, the xenon emission peak at 467 nm. The emission spectrometer was calibrated using the emission of water at a wavelength of 397 nm after excitation at 350 nm. The intensity of the water Raman scatter peak (Ex/Em 275/303 nm) obtained daily was used to normalize the spectra to account for the decay in lamp intensity over time. Fluorescence index (FLD) is the ratio of emission intensity (450 nm:500 nm) at 370 nm-excitation (McKnight et al., 2001). 3.2.5
performed according to Malcolm (1991) with some modifications. Samples were acidified with concentrated H3 PO4 to pH 2 and sparged for 10 min with He(g) through a glass fritted bubbler prior to fractionation. The XAD-8 was replaced with DAX-8, as recommended by Peuravuori et al. (2001). Before each sample run the resin was reconditioned with 0.1 M NaOH at a flow rate of 4 ml min−1 until the eluting solution became alkaline. Then, the column was treated with 0.1 M HCl until acidic. This was repeated two more times. Before analysis, the samples were filtered through precombusted Whatman GF/C glass fibre filters (1.2 µm) and analyzed for DOC on a Shimadzu TOC-5050A. The same amount of DOC was run on each column. The first bed volume (12 ml) of effluent was labelled the NHS-fraction. The HS-fraction was then eluted by back-flushing the column with at least 60 ml 0.1 M NaOH at a flow rate of 2 ml min−1 . The NHS and HS fractions were weighed, and then analyzed for DOC. The median recovery was 93% (robust CV of 10).
Analyses at the INSTAAR-lab
Characterization involving XAD-8 fractionation, total dissolved nitrogen (TDN) analysis, and fluorescence spectroscopy (Excitation-Emission-Matrix EEM) were conducted on a subset of 28 samples (marked with X in Fig. 1) at the University of Colorado Institute of Arctic and Alpine Research laboratory (INSTAAR-lab). All samples analyzed at INSTAAR-lab were filtered through precombusted (475◦ C for 4 h) Whatman GF/C glass fibre filters (1.2 µm) before further preparation. TDN was analyzed using chemiluminescent emission (Antek 9000 N Nitrogen Analyser). 3.2.4
1571
XAD-8 fractionation
Operationally, humic substances (HS) can be defined as the DOC fractions which adsorb on XAD-8 (a macroporous nonionic resin) at low pH, and desorb at high pH (e.g. Aiken, 1985). The fractions not adsorbed on the XAD-8 are denoted non-humic substances (NHS). XAD-8 analysis was www.hydrol-earth-syst-sci.net/13/1567/2009/
3.3
Map material
To relate NOM-character to catchment character, we used land-use maps on the scale 1:20 000 (SNLS, 2002) and 1:50 000 soil maps (SGU, 2001), along with the kNNdatabase of vegetation that contains forestry variables estimated from Landsat 2000 satellite photos (Reese et al., 2003) (Table 1). The variable “organic soil type” is referred to as “peat” in the study. The percentage of each variable on each catchment from the land-use map and soil map were used in the modelling. In addition to the data read directly from the map, six variables were calculated from the map information: stream length (km), drainage density (km−1 ), sinuosity, slope (%), percentage above the highest coastline (%) and elevation (m). Drainage density is the ratio of the total length of streams within a catchment to the total area of the catchment. Sinuosity (a measure of meandering) is given by dividing the stream length with the shortest distance between two sampling sites. A stream with the sinuosity of 1 is completely straight with no bends, and with a ratio over 1.4 the stream has numerous closely spaced bends i.e. very meandering. For more information see Temnerud (2005). 3.4
Statistical methods and tests for transformation of NOM
Most variables did not have normal distributions (distribution tested using one-sample Kolmogorov-Smirnov test) and the number of sites in each group (headwater or downstream sites) are in most cases fewer than 19, so non-parametric methods are used. Wilcoxon W (2-tailed, α = 0.05) was used for testing significant differences between groups; headwaters and downstream, upstream and downstream from stream junctions, stream reaches and lakes. The parametric and more robust Student’s t-test assuming unequal variances were also used to check for differences between groups. Hydrol. Earth Syst. Sci., 13, 1567–1582, 2009
1572
J. Temnerud et al.: Swedish boreal landscape scale pattern in the stream character of NOM
As an estimate of variables variability robust coefficient of variation (CV ) is used, robust CV = 100 × normalised IQR/median, where IQR is interquartile range (75–25 percentile), and normalised IQR is IQR multiplied by 0.7413 (PTA, 2006). The factor 0.7413 makes IQR comparable to standard deviation, if the distribution is normal, normalised IQR values would equal standard deviation. Since the data is not normally distributed and there are generally few samples, normalised IQR will be used. Statistical power analysis was performed using GPOWER (version 2, Erdfelder et al., 1996). The post hoc analysis of the difference in means between headwaters and downstream using the two-tailed Student t-test was run in accuracy mode calculation. H0 was that there is no different between headwater and downstream sites. H1 was that there is a difference. The statistical power (1-β) gives the probability that the hypothesis is correctly rejected. Statistical power above 80% indicates that the H0 was correctly rejected. Bootstrap, with replacements, was performed for the parameters that were indicated to have a significant difference between headwaters and downstream sites using Wilcoxon W. Of the 44 downstream sites 19 cases (same number as headwaters) were randomly chosen 1000 times and the randomizations were compared to the original headwater values using Student’s t-test. The same procedure was done for the branches O1 and O2. If both the statistical power analysis (>80%) and more than 80% of the t-tests based on the bootstrapping sampling procedure indicate a significant difference between headwater and downstream sites, the difference was deemed to be strong and valid. Common factor analysis (FA) was performed to check for latent structures between TOC, NOM character and physical parameters, using the oblique (non orthogonal) rotation method Oblimin (δ = 0.6) and Kaiser normalisation (SPSS for Windows v16.02). In FA the variance of a single variable is decomposed into common variance that is shared by other variables included in the model and unique variance that is unique to a particular variable (Gauch, 1982). Principal component analysis (PCA), a similar multivariate procedure, considers the total variance and makes no distinction between common and unique variance (Gauch, 1982). Oblique rotation allows the factors to correlate, if the factors are truly uncorrelated, orthogonal and oblique rotation produces similar results (Costello and Osborne, 2005). Partial least square regression (PLS) was used to check which physical parameters (Table 1) could be use to model TOC and the NOM character (SIMCA for Windows v10.5, Umetrics) (Geladi and Kowalski, 1986). All data were centred by mean normalization and weighted by dividing the variables with the standard deviation prior to PLS. To prevent negative values of predictions and to normalize the distribution of each variable all the variables were natural logarithm transformed. The results of the prediction were tested using cross validation, with three randomly chosen sites omitted 20 times.
Hydrol. Earth Syst. Sci., 13, 1567–1582, 2009
The criteria for testing the models were the differences between measured and modelled values. The root mean square error (RMSE) is a measure of the average difference between measured and predicted values. The maximum RMSE for an acceptable model was set to the value of the 5th percentile for the whole data matrix for each variable. Besides the RMSE, we also required an acceptable model to reproduce the observed variability. This was evaluated by the slope of the regression line between measured and modelled values. Values between 0.7 and 1.3 were considered to be acceptable. The Pearson correlation coefficient, r, between measured and modelled values is another measure of model performance. Values above 0.6 were considered to indicate a good model. The Pearson correlation for the calibration is denoted as R and for the validation Q. For the models derived using PLS the variance in the data matrix explained by the 1st and 2nd principal component (PC) can be used as a measure of how good the model is. A value above 60% was set as the limit for an acceptable model. In the first model all physical parameters were included, but only variables with significant contribution (α = 0.05, Hotelling T2) to the model were used in the final model for that variable. 3.4.1
Stream junctions
At 14 stream junctions in O, including 7 from branch O1 and 6 from branch O2, the percentage difference between two upstream tributaries and the sampling site immediately below the confluence was determined as the deviation from volumeweighted conservative mixing of the tributaries. Volumeweighted differences in TOC, Fe and Al have been published (Temnerud et al., 2007). A negative difference indicate a decrease in that variable. The relative differences in catchment size were calculated, the tributary with the smallest catchment size divided by the combined size of the two tributaries catchments. The same approach was used for discharge, with the smallest site discharge being compared to the sum of both. 3.4.2
Stream reaches
A stream reach is demarcated by an upstream and downstream junction, with no additional streams entering the stream according to the map (scale 1:50 000). In O, there were 20 stream reaches, 9 from O1 and 7 from O2. The length of the stream between the sampling sites at the start and end of each reach, as well as the differences in catchment sizes and discharge were calculated. The measured variables were compared for differences upstream and downstream from each reach, without taking discharge differences into account. Negative differences indicate a decrease in that variable. For TOC, Fe and Al comparison of mass differences along each reach have also been made (Temnerud et al., 2007). www.hydrol-earth-syst-sci.net/13/1567/2009/
J. Temnerud et al.: Swedish boreal landscape scale pattern in the stream character of NOM
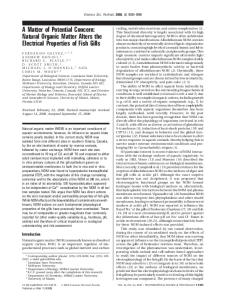
Fig. 2. Optical properties: UV/Vis data at pH 6.8 and 50 mM NaPO4 (GPC-buffer): (a) SUVA (254 nm/TOC) (b) SVA (420 nm/TOC) (c) S (absorbance 250–550 logarithmic slope) and (d) SAR (254/420 nm) variation with catchment size. Apparent molecular weight from GPC-data at pH 6.8 and 50 mM NaPO4 : (e) polydispersity, (f) Mw , (g) Mn and (h) Mp variation with catchment size. See Methods for more details and abbreviations. Data for catchment O, with the branches O1 ( ) and O2 (4), and O3 (�).
3.4.3
Lakes
The inputs from all measured streams draining to each lake were compared to the lake outlet. The percentage difference between inlets and outlet were the ratio of the conservative mixing of inlets based on respective discharges. Negative differences indicate a decrease in that variable. Such comparisons have already been presented for TOC, Fe and Al (Temnerud et al., 2007). Five lakes were investigated in O, three of which were in O1 and one in O2.
4
Results
The weather was warm and sunny, without any rain, during the sampling period. The groundwater table was low, which is common at that time of year. The specific discharge (q) was rather different between the two branches, due to differences in the occurrence of lakes (Temnerud et al., 2007). O1 had a median q of 2.1 L s−1 km−2 , while in O2 the median value was 0.45 L s−1 km−2 . Median stream temperature was 17◦ C in O1 and 15◦ C in O2. The streams had low electric conductivity with a median of 0.003 S m−1 . www.hydrol-earth-syst-sci.net/13/1567/2009/
1573
Fig. 3. Aquatic humic substances (n = 28): (a) Percentage aquatic humic substances (HS) of DOC (%HS), (b) Fluorescence index (FLD) is the ratio of emission intensity (450 nm: 500 nm) at 370 nm-excitation and (c) C:N variation with catchment size. Data for catchment O, with the branches O1 ( ) and O2 (4), and O3 (�). See Methods for more details and abbreviations.
4.1
Variability of chemical variables
Considering the whole catchment the robust CV for Fe, Al and TOC were 123, 120 and 80, respectively. GPC-height, -area, A420 and A254 had robust CV ’s similar to those for TOC, with a median of 78. The robust CV (value in parentheses) for other NOM character measured and pH was in decreasing order: C:N (32), SVA (22), SAR (15), Mn (14), Mw (14), εa (11), polydispersity (10), S (7.1), pH (7.1), SUVA (6.4), Mp (4.9), GPCSUVA (4.4), FLD (4.0), HS% (3.9), GPCFLD (1.5) and GPC-time (1.0). For each branch, when the catchment size surpassed approximately 5 km2 , the TOC, Fe and Al concentration were less variable (TOC visualized in Fig. 2, Temnerud et al., 2007). The variability in NOM character did not noticeably lessen when the catchment size for each branch surpassed 5 km2 (Figs. 2–3). The robust CV was lower at downstream sites compared to headwater sites for q, Fe, Al, SAR, S, SVA, Mn , Mw , polydispersity, GPCSUVA , GPCFLD and FLD (Table 2). For the other NOM character variables in Table 2 robust CV was the same or higher when comparing downstream sites with headwaters. Please note the overlap in catchment size between headwater and downstream sites, refer to the section Characteristics of the study site for more details. Hydrol. Earth Syst. Sci., 13, 1567–1582, 2009
1574
J. Temnerud et al.: Swedish boreal landscape scale pattern in the stream character of NOM
Table 2. NOM character and associated parameters for the stream Ottervattsb¨acken (O). Median values with robust coefficient of variation (CV ) grouped into headwaters and downstream. Bold values are significance difference with statistical power analysis >80%. Group
19 Headwaters
Statistical Catchment size Specific discharge Lakes pH TOC Fe Al
km2 L s−1 km−2 surface% mg L−1 mg L−1 mg L−1
Aa254 Aa420 SARa Sa SUVAa SVAa εaa
m−1 m−1
GPC-time GPC-area GPC-height Mp Mn Mw Polydispersity GPCSUVA GPCFLD
min min mV mV kDa kDa kDa Mw :Mn min−1
−1000 L mg−1 m−1 L mg−1 m−1 L mol−1 cm−1
C:N FLD m% DOC
HS NHS NHS+HS
44 Downstream
Median
CV
Median
CV
WT
Boot
Power
0.8 1.0 0.0 6.1 24 2.5 0.12
74 112 0.9IQR 4.9 56 202 156
13 1.7 3.2 6.5 15 1.4 0.08
78 82 157 6.8 84 135 137
W,T W,T W W,T
41 82 35 48
65 93 49 79
108 13 8.5 12.8 4.8 0.57 464
80 86 20 9.5 6.9 26 8.5
73 7.8 9.7 13.0 4.4 0.48 416
80 87 14 6.7 10 19 10
W,T W,T W,T
55 62 60
79 81 13
W W,T W
13 28 46
17 70 37
18.5 54 17 2.36 1.31 2.45 1.94 2.7 1.43
0.6 79 81 3.1 13 16 12 9.1 4.1
18.6 38 10 2.26 1.21 2.11 1.85 2.7 1.45
0.7 80 81 4.1 12 12 7.8 4.0 1.5
W,T
46
54
W,T
53
66
W,T
50
73
40b 1.3b 82b 11b 94b
34 4.6 11 27 9.4
42c 1.4c 74c 14c 85c
34 4.3 16 25 13
Index a denotes absorbance at pH 6.8 and 50 mM NaPO4 (GPC-buffer). Index b indicates 17 headwaters and index c indicates 11 downstream sites. Index IQR = normalised interquartile range (since median is null). HS = Humic Substances, NHS = non humic substances. m% DOC = mass percentages HS and NHS of whole-water sample DOC. Entries in column “WT” denotes a significant difference (α = 0.05) between headwater and downstream for respective catchments using Wilcoxon W (W), or Student’s t-test independent sample test assuming unequal variances (T). Boot is bootstrapping with replacement, 100% is all randomizations (1000) that have a significant difference using Student t-test (α = 0.05). Power is statistical power analysis in percentage. For more details see Methods.
4.2
FA- and PLS-analysis
In the factor analysis, the first factor identified was a cluster of NOM character parameters including TOC concentration, absorbance (A254 and A420 ), absorptivity (SUVA, SVA and εa ), most of the apparent molecular weight measurements (GPC-height, GPC-area, Mn , Mw , Mp ) and HS% that were positively clustered together along the first factor (Fig. 4a). Hereafter this cluster is termed FAChar 1+. The C:N ratio also fell along this axis, but not as far from the origin. Negatively correlated to FAChar 1+, at the other end of the first factor axis, were SAR, S, GPC-time and GPCFLD (FAChar 1-). Hydrol. Earth Syst. Sci., 13, 1567–1582, 2009
These clusters were the easiest to identify. At the positive end of the second factor (opposite of FAChar 1) were polydispersity and GPCSUVA (Fig. 4a), closer to the origin than GPCSUVA was FLD. When adding the physical parameters (Table 1 plus q and catchment size) to the NOM character matrix a different pattern was revealed (FLD, C:N and HS% was omitted from analysis since they made the matrix indefinite, i.e. the eigenvalues were not positive). Along the first factor forest, lake, thin soil, rock, highest height and q were clustered together with FAChar 1− (Fig. 4b). At the other end of factor 1 is mire, peat and drainage density clustered together with FAChar 1+ (except SUVA and εa ). www.hydrol-earth-syst-sci.net/13/1567/2009/
J. Temnerud et al.: Swedish boreal landscape scale pattern in the stream character of NOM
1575
Temnerud et al. 2009
Using PLS-models the available physical parameters (lake 875 and mire coverage) were able to predict TOC satisfactorily (see Methods for criteria, Fig. 5). None of the NOMcharacters were modelled to the same high degree as TOC: this means that R 2 , Q2 and regression slope between 0.4– 0.5, RMSE above the 5th percentiles for that variable, and that PC1 and PC2 explained between 60–40%. Of the NOM character measured SAR was modelled best (mire and altitude, Fig. 5), followed by SVA, S, Mw , Mp and HS%. PLS-models did not work out for SUVA, εa , Mn , polydispersity, GPCSUVA , GPCFLD , FLD and C:N. The significant parameters that were most common in each PLS-model were (in decreasing order): lake surface coverage, mire coverage, stream drainage density, forest coverage and altitude. Lake surface coverage itself could explain more than 20% of the variation in SVA, HS%, Mp , Mn , Mw , TOC, SAR and GPC-time. For the last three of these parameters the correlation was negative, i.e. with increasing lake surface coverage, TOC, SAR and GPC-time values were lower. Mire surface coverage could also explain over 20% of A420 , SVA, HS%, SAR and FLD. The last two parameters had negative correlations. Forest coverage itself explained more than 20% of the variation in FLD, and the correlation was positive.
4.3
Headwaters compared to downstream
No significant differences between headwater and downstream sites were observed for the NOM character variables 876 (Figs. 2–3). When headwaters were compared with downstream sites pH was higher and A420 nm lower downstream (using bootstrapping and power analysis) (Table 2). When examining the stream branches separately branch O1, TOC and Fe showed a significant decrease in concentration downstream, while pH increased (using bootstrapping and power analysis). No significant changes were observed in O2 for any measured chemical or NOM character variables.
4.4
Fig. 4
Fig. 4. Common factor analysis plots (based on the structure matrix using Oblimin rotation, δ = 0.6) for (a) TOC and NOM character where the factor 1 explains 52%46and factor 2, 12% of the variation and (b) physical parameters (from Table 1 plus specific discharge (q) and catchment size) together with TOC and NOM character where factor 1 explains 30% and factor 2, 12% of the variation. See Methods for more details and abbreviations.
Stream junctions
When tributaries met, the smaller one was in median 72% of the size of the larger tributary and the specific discharge was 84% of the larger tributary (Table 3). At the four sites with large loss of TOC (volume weighted median difference −33%, from Temnerud et al., 2007), there was a decrease in absorbance (A420 and A254 by −51 and −50%, respectively), GPC-height (−47%) and GPC-area (−46%). The other NOM character changes were small at these four sites, as well as for all NOM character variables at the other ten junctions (change under 10%, mostly under 5% and not significant), and the direction (+/−) of the character change varied (Table 3).
www.hydrol-earth-syst-sci.net/13/1567/2009/
Fig. 5. Plots showing measured and modelled values using partial least square (PLS) models (solid line) for (a) natural logarithm (Ln) of TOC and (b) LnSAR (specific absorption ratio (254/420 nm)). For the TOC PLS model, the factors lake coverage and mire coverage were included, while for the PLS model of SAR, mire coverage and altitude were used. See Methods and Results for more details.
Hydrol. Earth Syst. Sci., 13, 1567–1582, 2009
1576
J. Temnerud et al.: Swedish boreal landscape scale pattern in the stream character of NOM
Table 3. NOM character and associated parameters for the stream Ottervattsb¨acken (O). Median percentage differences, with robust CV , between the NOM character variables (1) along stream reaches, (2) of tributaries entering a junction compared to that of water downstream from that stream junction and (3) between the water entering a lake and the outlet of that lake. The ratio of the mixing is based on discharge. No significant differences in character were observed below junctions, reaches or lakes. For details of the statistical tests used, see the Methods section. Group Numbers Catchment size Specific discharge pH TOC Fe Al
km2 L s−1 km−2 mg L−1 mg L−1 mg L−1
Aa254 Aa420 SARa Sa SUVAa SVAa εaa
m−1 m−1
GPC-time GPC-area GPC-height Mp Mn Mw Polydispersity GPCSUVA GPCFLD
min min mV mV kDa kDa kDa Mw :Mn min−1
−1000 L mg−1 m−1 L mg−1 m−1 L mol−1 cm−1
(1) Reaches Median
19 CV
(2) Junctions Median
14 CV
(3) Lakes Median
5 CV
4.7 −1.9 0.0 0.9 2.8 4.1
121 −1291 3.5IQR 709 1334 577
72 84 0.5 −3.8 −12 −13
60 125 222 −531 −313 −308
64 24 3.4 −17 −24 −4.2
291 482 128 −143 −313 −1712
0.9 −0.6 2.1 2.0 −4.5 0.6 0.2
2380 -6504 493 616 311 833 2449
−6.4 −6.1 −2.0 −0.1 0.5 1.7 1.5
−569 −846 −412 −4390 1878 1387 790
−12 −17 5.3 3.0 3.6 0.2 1.8
−228 −245 738 885 263 16815 637
−0.1 −0.9 −1.6 0.4 3.0 0.3 −1.4 −0.1 0.8
−1033 −3897 -2512 544 524 2883 −547 −1785 668
−0.1 −5.5 −6.9 0.2 0.7 0.1 −1.7 0.2 0.2
−1021 −838 −662 1611 1402 8780 −687 4054 906
0.8 −10 −12 −4.0 −6.5 −13 −6.9 −1.6 0.19
95 −271 −226 −97 −198 −134 −124 −156 2879
Index a denotes absorbance at pH 6.8 and 50 mM NaPO4 (GPC-buffer). Index IQR = normalised interquartile range (since median is null). For more details see Methods.
4.5
Stream reaches
The median catchment size increased by 4.7% and specific discharge decreased by −1.9%, along stream reaches (Table 3). The median distance between sites along stream reaches was 661 m. For NOM character parameters the percent changes along reaches were small (under 10%, mostly under 5% and not significant), and the direction (+/−) of the character change varied (Table 3). Four reaches had increases in both TOC concentration (median 35%) and flux (96%) that were more than 10% (Temnerud et al., 2007). These reaches also had increases in absorbance (median 40% for A420 and A254 36%) and in GPC-height (19%). At two reaches there were decreases in TOC concentration (−28%) and small increases in flux (10%) (Temnerud et al., 2007). These also had decreases in absorbance (−34% for A420 and A254 −29%), GPC-height (−25%) and GPC-area (−22%). At those six stream reaches just mentioned no other large changes were observed in NOM character. Hydrol. Earth Syst. Sci., 13, 1567–1582, 2009
4.6
Lakes
The increase in catchment size between the incoming streams and the outlet of each lake was in median 64%, while specific discharge increased by 24%. Downstream from the lakes the concentration was less but the flux increased for Al, Fe and TOC (Temnerud et al., 2007). For most NOM character parameters the percent changes at lakes were small (under 10%, mostly under 5% and not significant), and the direction (+/−) of the character change varied (Table 3). Exceptions were the following parameters that had roughly the same percentage decreases (∼ −14%): absorbance (A254 and A420 ), GPCarea, GPC-height and Mw . The 28 sites analyzed for nitrogen, GPC and FLD; were chosen to make comparison of the differences in these variables possible for the largest lake, just downstream of O2 (Fig. 1). The changes, before and after that lake, for C:N was −3.8%, for %HS 7.7% and for FLD −2.8%. www.hydrol-earth-syst-sci.net/13/1567/2009/
J. Temnerud et al.: Swedish boreal landscape scale pattern in the stream character of NOM 5
Discussion
With increasing subcatchment size, and longer hydraulic retention time, we hypothesized that if the NOM character changes from headwaters to downstream sites it would result in lower C:N ratio, lower molecular weight and less aromaticity per TOC. Using both bootstrapping analysis and power analysis no significant differences in the character of NOM were detected between headwaters and downstream sites in O (Table 2). Instead we were able to identify at which catchment size (>5–10 km2 ) it is possible to identify NOM character values that are representative for the average NOM that is mobilized in this stream network. If the mobilization mechanism of NOM of specific character is of interest then a detailed sampling campaign as this one may help to identify landscape mosaics. If instead the average NOM character of a larger landscape is to be obtained, sampling of NOM at small streams is of little value and the sampling effort should be concentrated on the higher order streams. The variation in Fe, Al and TOC concentration was also more than twice (robust CV range 123 to 80) the variation compared to all measured NOM characteristics not directly related to TOC concentration (range 32 to 1). Earlier work on TOC concentrations had found declines along the O1 branch, but not on the O2 branch (Temnerud and Bishop, 2005; Temnerud et al., 2007). There were significant downstream increases in pH along O and the branch O1, while A420 decreased in O and TOC, Fe, C:N, A254 and A420 decreased downstream along O1. Lack of powerful significant differences in many NOM characters between headwater and downstream along both O1 and O2 is an initial suggestion that in-stream processes are not shaping the boreal landscape variation of NOM character at the mesoscale (Figs. 2–3). We speculate that the cause of some changes in one branch but not the other was associated with the significant decrease of TOC and Fe concentration in lakes, since there were more lakes higher up in the O1 stream network than along O2. We do not find any support, either in our data or in the literature (e.g. Lara et al., 1998; K¨ohler et al., 2002a), for photochemical breakdown of NOM along stream reaches or interactions with the hyporheic zones in first order boreal streams, but they can not be ruled out either. However, soil water that just enters the stream is more sensitive to photochemical breakdown of NOM (K¨ohler et al., 2002a). The residence time of TOC in surface water is much higher in the catchments with lakes. 5.1
Comparison of the NOM character
The range of character observed on O is consistent with values from other studies in the boreal zone. The values of S (median 13) and SAR (median 9.5) are in line with those found by earlier studies (Blough and Green, 1995; Vogt et al., 2004). The SUVA (median 4.6) in the present study is similar compared to other studies which usually report www.hydrol-earth-syst-sci.net/13/1567/2009/
1577
values between 4–5 (Pettersson et al., 1994; Vogt et al., 2004). Data from 11 large catchments (catchment size 21– ¨ basin, sampled at 5 occasions 2939 km2 ) in the River Ore (C. Pettersson, personal communication, 2002) were analyzed for SUVA and %HS using similar methods as in this study. Due to the seasonal variation in this region (Ivarsson and Jansson, 1994b), data from Petterson’s (2002) sampling in August 1995 was chosen for comparison (TOC 5 to 11 mg L−1 , SUVA 4.4 to 4.9, %HS 79 to 89%). These August data indicate no clear character change with catchment size either. The results from our study could have been different if we had sampled at high flow. The detailed information necessary for a quantitative and meaningful interpretation of varying the sources of water during high flow however is not available for our study. However an indication of how this flow variation affects character can be found in a study from this region evaluating the temporal variation of SUVA and A254 /A365 (similar to SAR), in nine different catchments ˚ (with one lake) (Agren et al., 2008). SUVA was high in mire streams and decreased during spring flood, forest streams had lower SUVA which increased during spring flood compared to base flow (winter and summer). The opposite pattern was observed for the absorbance ratio A254 /A365 . The ratio was higher in forest streams and increased during spring flood in forest streams. Mire streams had lower absorbance ratio and it increased during spring flood. These observations of SUVA and A254 /A365 could be coupled to temporal variation in molecular weight (Scott et al., 2001) and different temporal responses were found in mire and forest streams. Thus while there were distinct changes in TOC concentration and NOM character as flow rates changed, the spatial variation of TOC (Buffam et al., 2008) and to some extent even NOM ˚ character (Agren et al., 2008); has been found to be less during high discharge situations than during low flow. Previously reported GPC-analyses on XAD-8 isolated fulvic acids from watercourses in the region (Pettersson et al., 1994; Ephraim et al., 1996) with similar DOC-concentration as well as Mn and Mw -ranges (1250–1750 Da and 1850– 2650 Da, respectively; cf. Fig. 2), are also similar to those in the present study (Table 2). The similarity in molecular weight, between the studies, could be interpreted as the majority of TOC in the present study being stream water fulvic acids. The similarity in the acid/base properties and molecular weight in the stream network corresponds to earlier observations for molecular weight and acid/base properties in southern Sweden by Ephraim et al. (1996). The organic acid model developed by K¨ohler et al. (2002b) also proved applicable to a wide range of streams and lakes in Sweden, indicating little variability in the effective acid/base character of NOM in surface waters. The O2 headwaters had about the same high C:N ratios as in two nearby catchments (Ivarsson and Jansson, 1994b; Bertilsson et al., 1999). The deposition of inorganic nitrogen deposition is low, ca. 2–3 kg ha−1 yr−1 in the study area. Hydrol. Earth Syst. Sci., 13, 1567–1582, 2009
1578 5.2
J. Temnerud et al.: Swedish boreal landscape scale pattern in the stream character of NOM NOM character clusters
In most comparisons, A420 , A254 , GPC-height and -area showed the same spatial pattern as TOC, such as at headwater vs. downstream sites, stream junctions, reaches and lakes. These analyses are essentially measuring the same quantity, the concentration of TOC. In this study SAR and S positively correlate with GPC-time and negatively with SUVA, SVA, εa , Mn , Mw , Mp polydispersity and HS% (Fig. 4a). This suggests that low SAR is expected for NOM with high molecular weight, which is consistent with other studies (Hautala et al., 2000). Weishaar et al. (2003) observed a correlation between SUVA and the degree of aromaticity, measured by 13 C NMR. Peuravuori and Pihlaja (1997) concluded that εa correlated better to aromaticity than SUVA. In this study SUVA, εa and SVA are all used to estimate the degree of aromaticity. An increase in SVA could reflect a less aromatic and more aliphatic character of the NOM (Vogt et al., 2004). C:N and FLD are not clustered close by each other (Fig. 4a), although they are both an estimate of the degree of terrestrially derived NOM. Higher values for C:N indicate a more terrestrial origin (approximately >30), while lower values indicate a more aquatic origin of the organic matter (Campbell et al., 2000; Lovett et al., 2000). In this study median C:N was 41, indicating most NOM was terrestrial. The FLD ratio in this study indicates that most of the TOC in the streams is terrestrially derived (median 1.34), the same level of FLD (median 1.30) as observed by McKnight et al. (Table 2, 2001) in 4 watercourses in the USA. Higher FLD (∼1.9) reflect a more aquatic derived NOM. It is interesting to note that FLD and GPCFLD were clustered together (Fig. 4a), while GPCSUVA is orthogonal to SUVA in Fig. 4a. 5.3
Transformations of NOM
The present study did not indicate any systematic NOM character change along the stream reaches. This also fits with the idea that in-stream changes are not large. Kothawala et al. (2006) and Wu et al. (2007) found that the NOM character changed at beaver ponds but were stable downstream from the ponds. The theoretical hydraulic retention time instream was estimated to one day during this sampling period (with very low specific discharge), from headwater to the outlet of O (Temnerud et al., 2007). At higher flows, the residence times will be even shorter. The riparian zone was often shaded by forest. This, in combination with short retention time, limits the possibility of solar radiation affecting the NOM character along stream reaches. It has been argued that in-stream processes begins to dominate over the TOC inputs in watercourses larger than stream order 6 (Naiman et al., 1987; Ford et al., 1990). The outlet in Ottervattsb¨acken is stream order 4.
Hydrol. Earth Syst. Sci., 13, 1567–1582, 2009
At sites with longer retention time, lakes with TOC concentration (and absorbance, GPC-time and -area) decrease (>10%), the only decrease larger then 10% in NOM character was for Mw but this was not significant. In lakes, biological transformations as well as photochemical breakdown of NOM have more time to act (Algesten et al., 2004). Solar radiation could effect the utilization of NOM, and influence different size classes of NOM in different ways (Brisco and Ziegler, 2004). The small change in NOM character could result from a combination of chemical precipitation, solar radiation and biological transformation but their combined effect does not significantly influence the NOM character in this study. At sites with fast mixing zones such as stream junctions, no change in NOM character was observed (Table 3), not even at the four sites which showed decreases of more than 30% in TOC. The factor analysis was made separately on the differences above and below stream junctions, reaches and lakes (data not shown). These showed essentially similar clusters of NOM character at junctions and reaches as for all 63 sites, but above and below lakes, there were differences compared to the others. The lack of significant difference between headwater and downstream sites, in combination with the different clusters of NOM character for stream junctions, reaches and lakes, indicate that either there were no strong in-stream processes in the catchment or that the processes at stream junctions, reaches and lakes even out their effect on NOM character at the mesoscale. 5.4
Mosaic of the landscape
As mentioned in the Introduction, lake surface coverage was one of the most important factors governing TOC, but this holds true only to a smaller degree for the NOM character. The presence of lakes in O1 has a significant effect on the concentration of TOC and Fe, but only for one of the NOM character measures (C:N) not directly related to TOC concentration. Another unexpected feature was the lack of significant decrease in absorptivity (SUVA, SVA and εa ), especially downstream from the lakes (Meili, 1992; Larson et al., 2007). Although the lakes in the catchments are polyhumic both TOC and absorbance (A254 and A420 ) were lower below the lakes (the absorbance for higher wavelengths decreasing more), absorbance decreased just slightly more relative to TOC, leading to small changes in absorptivity (SUVA and εa ). Schumacher et al. (2006) observed that both spatial and temporal differences in NOM character between five catchments in Scandinavia were minor, which supports our findings that there are small changes in the NOM character. One exception in the literature to the generally low degree of NOM character variability in the landscape is the recent discovery of differences in the bioavailable fraction of DOC from mires and forest (Berggren et al., 2007). Although this was a very small fraction of the DOC (up to 1%), it was www.hydrol-earth-syst-sci.net/13/1567/2009/
J. Temnerud et al.: Swedish boreal landscape scale pattern in the stream character of NOM found to correlate to absorbance ratio (A254 /A365 ). That absorbance ratio is similar to SAR in this study where SAR was modelled better by mire coverage than forest (as in Berggren et al., 2007). The sampling was done during a dry summer, and forest areas contribute more stream water during ˚ wet situations/high discharge (K¨ohler et al., 2008; Agren et al., 2008). Lakes increased the specific discharge (Fig. 4b), but q is also influenced by mires (mire is negatively correlated to q in Fig. 4b). The spatial variations of the very low specific discharge were correlated with the NOM character (absorptivity and C:N) but not with the TOC-concentration in the mire rich branch O2. This would be consistent with an older TOC at lower flow, with lower SUVA and C:N (Hood et al., 2006). Mires have also been found to exhibit a temporal variation in the influence on the molecular weight in streams, with higher apparent molecular weight during summer (Scott et al., 2001). During the dry summer 2002 there was a decrease in specific discharge (power analysis 76% and bootstrapping 48%) between headwaters and downstream sites along O2, which coincided with decreases in SUVA, SVA and εa , as well as for C:N, but not in molecular weight. However, no systematic decrease in absorptivity was observed along stream reaches in O2. TOC concentration was better modelled by map information than NOM character in this study, which is similar to the findings of Frost et al. (2006). We were not able to create satisfactory PLS models of SUVA and εa , though PLS-models worked out better for SVA in O. To some degree this could be due to smaller variation (robust CV ) in SUVA and εa compared to SVA (Table 2). Mire and forest coverage are the second most important factors in PLS-modelling after lakes. In this boreal landscape these three factors (lakes, forest and mires) are the dominant landscape features and have been shown to govern TOC in watercourses (Bishop et al., 2004; ˚ Laudon et al., 2004), SUVA and A254 /A365 (Agren et al., 2008), as well as the bioavailable fraction of DOC (Berggren et al., 2007). It is our belief that if we could model TOC and NOM character in the headwaters we could better model NOM character downstream, where water usually is used by society (e.g. for drinking purposes).
6
Conclusions
The sampling period during summer with very low specific discharge provided a good opportunity to observe the influence of different boreal landscape elements on the character of NOM. No significant changes were observed in most NOM characteristics between headwaters and downstream. The variability of Fe, Al and TOC concentration was more than twice of that of NOM character measures, such as C:N and SAR. At stream junctions, along stream reaches, and upstream/downstream lakes, NOM character changes were less than 10% relative to what would be predicted by conservawww.hydrol-earth-syst-sci.net/13/1567/2009/
1579
tive mixing, even at those sites which had TOC decreases of greater than 10%. The lack of significant downstream changes in NOM character could be due to lack of strong in-stream processes or that processes (in combination with inputs of new NOM downstream) at these different stream junctions, reaches and lakes affect NOM character in different ways so their effects even out. Even though there are no consistent downstream trends, the variability that does exist derives from the mosaic of landscape elements (the mix of water originating from lakes, forest soil and mires) that provides a range of NOM characteristics to a boreal stream network where there are small net in-stream changes in character at some stream reaches, junctions and lakes. Acknowledgements. Financial support for this research was provided by the Knowledge Foundation, and Johan’s travel to USA was supported by The Royal Swedish Academy of Sciences. We are very grateful for Diane McKnight giving us the opportunity to use the INSTAAR-lab; especially Rose Cory and Kurt Chowanski are deeply appreciated for their expert help in the laboratory. We thank our fellow collaborators for excellent field- and laboratory work: Rose Cory, Tobias Eriksson, Evastina Grahn, Matthias Heinz, Ulf Juto, Anna Stenberg and Rasmus Sørensen. Many thanks also to Mats Jansson, and co-workers, as well as Anders ¨ ask L¨ofgren with family for making it possible to use the “Ortr¨ laboratory facilities”. Earlier drafts of the manuscript improved after discussions with Ishi Buffam. Catharina Pettersson is acknowledged for sharing her data with us and Ulf Grandin for statistical advice. Edited by: A. Ghadouani
References ˚ Agren, A., Buffam, I., Jansson, M., and Laudon, H.: Importance of seasonality and small streams for the landscape regulation of dissolved organic carbon export, J. Geophys. Res.-Biogeo., 112, G03003, doi:10.1029/2006JG000381, 2007. ˚ Agren, A., Buffam, I., Berggren, M., Bishop, K., Jansson, M., and Laudon, H.: Dissolved organic carbon characteristics in boreal streams in a forest-wetland gradient during the transition between winter and summer, J. Geophys. Res.-Biogeo., 113, G03031, doi:10.1029/2007JG000674, 2008. Aiken, G. R.: Isolation and concentration techniques for aquatic humic substances, in: Humic Substances in Soil, Sediment, and Water, edited by: Aiken, G. R., McKnight, D. M., Wershaw, R. L., and MacCarthy, P., John Wiley, New York, USA, 363–385, 1985. Alexandersson, H., Karlstr¨om, C., and Larsson-McCann, S.: Temperaturen och nederb¨orden i Sverige. Referensnormaler. (Temperature and precipitation in Sweden 1961–90, Reference normals, in Swedish with an English summary), Swedish Meteorological and Hydrological Institute, Norrk¨opingReport Meteorologi nr 81, 88, 1991. ˚ Algesten, G., Sobek, S., Bergstr¨om, A. K., Agren, A., Tranvik, L. J., and Jansson, M.: Role of lakes for organic carbon cycling in the boreal zone, Glob. Change Biol., 10, 141–147, 2004.
Hydrol. Earth Syst. Sci., 13, 1567–1582, 2009
1580
J. Temnerud et al.: Swedish boreal landscape scale pattern in the stream character of NOM
Baker, A., and Spencer, R. G. M.: Characterization of dissolved organic matter from source to sea using fluorescence and absorbance spectroscopy, Sci. Total Environ., 333, 217–232, 2004. Berggren, M., Laudon, H., and Jansson, M.: Landscape regulation of bacterial growth efficiency in boreal freshwaters, Glob. Biogeochem. Cycle, 21, GB4002, doi:10.1029/2006GB002844, 2007. Bertilsson, S., Stepanauskas, R., Cuadros-Hansson, R., Graneli, W., Wikner, J., and Tranvik, L.: Photochemically induced changes in bioavailable carbon and nitrogen pools in a boreal watershed, Aquat. Microb. Ecol., 19, 47–56, 1999. Bertilsson, S. and Tranvik, L. J.: Photochemical transformation of dissolved organic matter in lakes, Limnol. Oceanogr., 45, 753– 762, 2000. Bishop, K., Seibert, J., K¨ohler, S., and Laudon, H.: Resolving the Double Paradox of rapidly mobilized old water with highly variable responses in runoff chemistry, Hydrol. Process., 18, 185– 189, 2004. Blough, N. V., and Green, S. A.: Spectroscopic characteristics and remote sensing of nonliving organic matter, in: Role of Nonliving Organic Matter in the Earth’s Carbon Cycle. Report from the Dahlem Workshop in Berlin 1993, 12–17 September, edited by: Zepp, R. G. and Sonntag, C., Environmental Sciences Research Report ES 16, John Wiley, Chichester, UK, 23–45, 1995. Bourbonniere, R. A.: Distribution pattern of dissolved organic matter fractions in natural waters from eastern Canada, Org. Geochem., 14, 97–107, 1989. Brisco, S. and Ziegler, S.: Effects of solar radiation on the utilization of dissolved organic matter (DOM) from two headwater streams, Aquat. Microb. Ecol., 37, 197–208, 2004. Buffam, I., Laudon, H., Seibert, J., M¨orth, C.-M., and Bishop, K.: Spatial heterogeneity of the spring flood acid pulse in a boreal stream network, Sci. Total Environ., 407, 708–722, 2008. Campbell, J. L., Hornbeck, J. W., McDowell, W. H., Buso, D. C., Shanley, J. B., and Likens, G. E.: Dissolved organic nitrogen budgets for upland, forested ecosystems in New England, Biogeochemistry, 49, 123–142, 2000. Chin, Y. P., Aiken, G., and Oloughlin, E.: Molecular-weight, polydispersity, and spectroscopic properties of aquatic humic substances, Environ. Sci Technol., 28, 1853–1858, 1994. Costello, A. B., and Osborne, J. W.: Best practices in exploratory factor analysis: four recommendations for getting the most from your analysis, Practical Assessment, Res. Evaluat., 10, 1–9, 2005. Davies-Colley, R. J. and Vant, W. N.: Absorption of light by yellow substances in freshwater lakes, Limnol. Oceanogr., 32, 416–425, 1987. Dillon, P. J., and Molot, L. A.: Effect of landscape form on export of dissolved organic carbon, iron, and phosphorus from forested stream catchments, Water Resour. Res., 33, 2591-2600, 1997. Ephraim, J. H., Pettersson, C., and Allard, B.: Correlations between acidity and molecular size distributions of an aquatic fulvic acid, Environ. Int., 22, 475-483, 1996. Erdfelder, E., Faul, F., and Buchner, A.: GPOWER: A general power analysis program, Behav. Res. Meth. Ins. C., 28, 1–11, 1996. Fisher, H., Sachse, A., Steinberg, C. E. W., and Pusch, M.: Differential retention and utilization of dissolved organic carbon by bacteria in river sediments, Limnol. Oceanogr., 47, 1702–1711,
Hydrol. Earth Syst. Sci., 13, 1567–1582, 2009
2002. Ford, T. E., Ford, S. A., Lock, M. A., and Naiman, R. J.: Dissolved organic-carbon concentrations and fluxes along the Moisie River, Quebec, Freshw. Biol., 24, 35–42, 1990. Frost, P. C., Larson, J. H., Johnston, C. A., Young, K. C., Maurice, P. A., Lamberti, G. A., and Bridgham, S. D.: Landscape predictors of stream dissolved organic matter concentration and physicochemistry in a Lake Superior river watershed, Aquat. Sci., 68, 40–51, 2006. Gauch Jr., H. G. : Multivariate Analysis in Community Ecology, Cambridge studies in ecology ; 1, Cambridge University Press, Cambridge, UK, 298 pp., 1982. Geladi, P., and Kowalski, B. R.: Partial least-squares regression - a tutorial, Anal. Chim. Acta, 185, 1–17, 1986. Hautala, K., Peuravuori, J., and Pihlaja, K.: Measurements of aquatic humus content by spectroscopic analyses, Water Res., 34, 246–258, 2000. Heikkinen, K.: Organic matter, iron and nutrient transport and nature of dissolved organic matter in the drainage basin of a boreal humic river in northern Finland, Sci. Total Environ., 152, 81–89, 1994. Hood, E., Williams, M. W., and McKnight, D. M.: Sources of dissolved organic matter (DOM) in a Rocky Mountain stream using chemical fractionation and stable isotopes, Biogeochemistry, 74, 231–255, 2005. Hood, E., Gooseff, M. N., and Johnson, S. L.: Changes in the character of stream water dissolved organic carbon during flushing in three small watersheds, Oregon, J. Geophys. Res.-Biogeosci., 111, G01007, doi:10.1029/2005JG000082, 2006. Hope, D., Billett, M. F., and Cresser, M. S.: A review of the export of carbon in river water – fluxes and processes, Environ. Pollut., 84, 301–324, 1994. Ivarsson, H., and Karlsson, L.-I.: Geological and geochemical con¨ drainage basin, Northern Sweden, Geogditions in the River Ore raphy Department, Ume˚a University, Ume˚aGerum report nr.15, 1992. Ivarsson, H., and Jansson, M.: Regional variation of dissolved organic matter in running waters in central Northern Sweden, Hydrobiologia, 286, 37–51, 1994a. Ivarsson, H., and Jansson, M.: Temporal variations in the concentration and character of dissolved organic matter in a highly colored stream in the coastal zone of Northern Sweden, Arch. Hydrobiol., 132, 45–55, 1994b. K¨ohler, S., Hruˇska, J., and Bishop, K.: Influence of organic acid site density on pH modelling of Swedish lakes, Can. J. Fish. Aquat. Sci., 56, 1461–1470, 1999. K¨ohler, S., Buffam, I., Jonsson, A., and Bishop, K.: Photochemical and microbial processing of stream and soilwater dissolved organic matter in a boreal forested catchment in Northern Sweden, Aquat. Sci., 64, 269–281, 2002a. K¨ohler, S., Hruˇska, J., J¨onsson, J., L¨ovgren, L., and Lofts, S.: Evaluation of three organic equilibrium models using an in-situ titration of an organic rich stream in Northern Sweden., Water Res., 36, 4487–4496, 2002b. K¨ohler, S. J., Buffam, I., Laudon, H., and Bishop, K. H.: Climate’s control of intra-annual and interannual variability of total organic carbon concentration and flux in two contrasting boreal landscape elements, J. Geophys. Res.-Biogeosci., 113, G03012, doi:10.1029/2007JG000629, 2008.
www.hydrol-earth-syst-sci.net/13/1567/2009/
J. Temnerud et al.: Swedish boreal landscape scale pattern in the stream character of NOM Kothawala, D. N., Evans, R. D., and Dillon, P. J.: Changes in the molecular weight distribution of dissolved organic carbon within a Precambrian shield stream, Water Resour. Res., 42, W05401, doi:10.1029/2005WR004441, 2006. Lara, R. J., Rachold, V., Kattner, G., Hubberten, H. W., Guggenberger, G., Skoog, A., and Thomas, D. N.: Dissolved organic matter and nutrients in the Lena River, Siberian Arctic: Characteristics and distribution, Mar. Chem., 59, 301–309, 1998. Larson, J. H., Frost, P. C., Zheng, Z., Johnston, C. A., Bridgham, S. D., Lodge, D. M., and Lamberti, G. M.: Effects of upstream lakes on dissolved organic matter in streams, Limnol. Oceanogr., 52, 60–69, 2007. Laudon, H., K¨ohler, S., and Buffam, I.: Seasonal TOC exports from seven boreal catchments in Northern Sweden, Aquat. Sci., 66, 223–230, 2004. Lovett, G. M., Weathers, K. C., and Sobczak, W. V.: Nitrogen saturation and retention in forested watersheds of the Catskill Mountains, New York, Ecol. Appl., 10, 73–84, 2000. Malcolm, R. L.: Factors to be considered in the isolation and characterization of aquatic humic substances, in: Humic Substances in the Aquatic and Terrestrial Environment. Proceedings of an International Symposium in Link¨oping, Sweden, August 21–23, 1989, edited by: Allard, B., Bor´en, H., and Grimvall, A., Lecture Notes in Earth Sciences 33, Springer-Verlag, Berlin, Germany, 9–36, 1991. McKnight, D. M., Boyer, E. W., Westerhoff, P. K., Doran, P. T., Kulbe, T., and Andersen, D. T.: Spectrofluorometric characterization of dissolved organic matter for indication of precursor organic material and aromaticity., Limnol. Oceanogr., 46, 38–48, 2001. Meier, M., Chin, Y. P., and Maurice, P.: Variations in the composition and adsorption behavior of dissolved organic matter at a small, forested watershed, Biogeochemistry, 67, 39–56, 2004. Meili, M.: Sources, concentrations and characteristics of organic matter in softwater lakes and streams of the Swedish forest region., Hydrobiologia, 229, 23–41, 1992. Mulholland, P. J.: Large-scale patterns in dissolved organic carbon concentration, flux, and sources, in: Aquatic Ecosystems: Interactivity of dissolved organic matter, edited by: Findlay, S. and Sinsabaugh, R., Academic Press, San Diego, USA, 139–159, 2003. Naiman, R. J., Melillo, J. M., Lock, M. A., Ford, T. E., and Reice, S. R.: Longitudinal patterns of ecosystem processes and community structure in a subarctic river continuum, Ecology, 68, 1139– 1156, 1987. Nyberg, L., St¨ahli, M., Mellander, P.-E., and Bishop, K. H.: Soil frost effects on soil water and runoff dynamics along a boreal transect: 1 Field investigations, Hydrol. Process., 15, 909–926, 2001. Pettersson, C., Ephraim, J., and Allard, B.: On the composition and properties of humic substances isolated from deep groundwater and surface waters, Org. Geochem., 21, 443–451, 1994. Pettersson, C., Allard, B., and Bor´en, H.: River discharge of humic substances and humic-bound metals to the Gulf of Bothnia, Estuar. Coast. Shelf Sci., 44, 533–541, 1997. Peuravuori, J., and Pihlaja, K.: Molecular size distribution and spectroscopic properties of aquatic humic substances, Anal. Chim. Acta, 337, 133–149, 1997. Peuravuori, J., Ingman, P., Pihlaja, K., and Koivikko, R.: Compar-
www.hydrol-earth-syst-sci.net/13/1567/2009/
1581
isons of sorption of aquatic humic matter by DAX-8 and XAD-8 resins from solid-state C-13 NMR spectroscopy’s point of view, Talanta, 55, 733–742, 2001. PTA: Guide to Proficiency Testing Australia, Proficiency Testing Australia, Silverwater, 27 pp, 2006. Reckhow, D. A., Singer, P. C., and Malcolm, R. L.: Chlorination of humic materials: Byproduct formation and chemical interpretations., Environ. Sci Technol., 24, 1655–1664, 1990. Reese, H., Nilsson, M., Granqvist Pahl´en, T., Hagner, O., Joyce, S., Tingel¨of, U., Egberth, M., and Olsson, H.: Countrywide estimates of forest variables using satellite data and field data from the national forest inventory, Ambio, 33, 542–548, 2003. Schumacher, M., Christl, I., Vogt, R. D., Barmettler, K., Jacobsen, C., and Kretzschmar, R.: Chemical composition of aquatic dissolved organic matter in five boreal forest catchments sampled in spring and fall seasons, Biogeochemistry, 80, 263–275, 2006. Schwarzenbach, R. P., Gschwend, P. M., and Imboden, D. M.: Environmental Organic Chemistry, 2 edn., John Wiley, Hoboken, USA, 1313 pp., 2003. Scott, M. J., Jones, M. N., Woof, C., Simon, B., and Tipping, E.: The molecular properties of humic substances isolated from a UK upland peat system. A temporal investigation, Environ. Int., 27, 449–462, 2001. SGU: Soil map, 1:50 000, The Geological Survey of Sweden, Uppsala, Sweden, 2001. SNLS: Land-use map, scale 1:20 000, The Swedish National Land Survey, G¨avle, 2002. Stumm, W. and Morgan, J. J.: Aquatic Chemistry: Chemical Equilibria and Rates in Natural Waters., 3 edn., John Wiley, New York, USA, 1022 pp., 1996. Swift, R. S.: Molecular weight, size, shape, and charge characteristics of humic substances: Some basic considerations, in: Humic Substances II, edited by: Hayes, M. H. B., MacCarthy, P., Malcolm, R. L., and Swift, R. S., John Wiley, New York, USA, 451–465, 1989. Temnerud, J.: Spatial Variation of Dissolved Organic Carbon along Streams in Swedish Boreal Catchments, Doctoral thesis, Depart¨ ¨ ment of Natural Sciences, Orebro University, Orebro, 41 pp., 2005. Temnerud, J., and Bishop, K.: Spatial variation of streamwater chemistry in two Swedish boreal catchments: Implications for environmental assessment, Environ. Sci Technol., 39, 1463– 1469, 2005. Temnerud, J., Seibert, J., Jansson, M., and Bishop, K.: Spatial variation in discharge and concentrations of organic carbon in a catchment network of boreal streams in Northern Sweden, J. Hydrol., 342, 72–87, 2007. Vannote, R. L., Minshall, G. W., Cummins, K. W., Sedell, J. R., and Cushing, C. E.: The river continuum concept, Can. J. Fish. Aquat. Sci., 37, 130–137, 1980. Vogt, R. D., Akkanen, J., Andersen, D. O., Br¨uggemann, R., Chatterjee, B., Gjessing, E., Kukkonen, J. V. K., Larsen, H. E., Luster, J., Paul, A., Pflugmacher, S., Starr, M., Steinberg, C. E. W., ´ Key site variables governSchmitt-Kopplin, P., and Zsolnay, A.: ing the functional characteristics of Dissolved Natural Organic Matter (DNOM) in Nordic forested catchments, Aquat. Sci., 66, 195–210, 2004. Weibull, W.: A statistical distribution function of wide applicability, J. Appl. Mechanics, 18, 297–297, 1951.
Hydrol. Earth Syst. Sci., 13, 1567–1582, 2009
1582
J. Temnerud et al.: Swedish boreal landscape scale pattern in the stream character of NOM
Weishaar, J., Aiken, G., Bergamaschi, B. A., Fram, M. S., Fujii, R., and Mopper, K.: Evaluation of specific UV absorbance as an indicator of the chemical content of dissolved organic carbon, Environ. Sci Technol., 37, 4702–4708, 2003. Wetzel, R. G.: Limnology. Lake and River Ecosystems, 3 edn., Academic Press, London, UK, 1006 pp., 2001.
Hydrol. Earth Syst. Sci., 13, 1567–1582, 2009
Wu, F. C., Kothawala, D. N., Evans, R. D., Dillon, P. J., and Cai, Y. R.: Relationships between DOC concentration, molecular size and fluorescence properties of DOM in a stream, Appl. Geochem., 22, 1659–1667, 2007.
www.hydrol-earth-syst-sci.net/13/1567/2009/