Key Performance Measures for the Ontario Diabetes Strategy Final Report June 2013 Health Analytics Branch
Ontario Ministry of Health and Long‐Term Care Health System Information Management and Investment Division Health Analytics Branch About the Health Analytics Branch The Health Analytics Branch (HAB), in the Ministry of Health and Long‐Term Care, provides high quality information, analyses and methodological support to enhance evidence‐based decision making in the health system. As part of the Health System Information Management and Investment (HSIMI) Division, HAB manages health analytics requests, identifies methods, and creates reports and tools to meet ministry, LHIN and other client needs for accurate, timely and useful information. Health Analytics Branch: Evidence you can count on. For more information, please contact: Soma Mondal Capacity Planning and LHIN Support Unit Health Analytics Branch, HSIMI, MOHLTC
[email protected]
Table of Contents Purpose of Report
4
Development of Key Performance Measures
5
Results
7
1. Diabetes prevalence 2. Physical inactivity 3. Overweight / Obesity 4. Attached diabetes patients 5a. Diabetes patients registered with Health Care Connect 5b. Diabetes patients referred to family health care providers by Health Care Connect 6a.Utilization of Diabetes Management Incentive code (Q040) 6b.Utilization of Diabetes Management Assessment code (K030) 6c. Utilization of any Diabetes Management code 7. Haemoglobin A1c (HbA1c) testing frequency 8. Low Density Lipoprotein Cholesterol (LDL‐C) testing frequency 9. Retinal Eye Exam testing frequency 10. All 3 tests within guideline periods (composite indicator) 11. Emergency visits for hyper/hypoglycemia 12. Renal replacement therapy rates 13. Infection, ulcer, amputation rates 14. Hospitalization rate for heart attacks 15. Ocular procedure rate (vitrectomy & laser photocoagulation)
Appendices Appendix A: Performance measures for future consideration Appendix B: Technical notes for indicator calculations
9 13 15 17 18 18 20 20 20 22 24 26 28 32 34 36 39 41
44 45 47
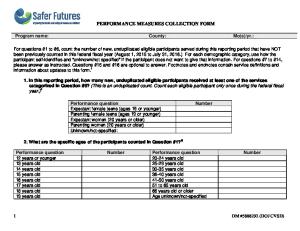
Purpose of Report The purpose of this report is to provide information on the key performance measures (indicators) for the Ontario Diabetes Strategy (ODS). Monitoring these indicators provides information on the progress of improving care and health outcomes for Ontarians with diabetes. The report includes: i) A brief description of the indicator selection and development; ii) Information on each indicator using the most recently available data; and iii) Technical specifications for each indicator. The first key performance measures report was prepared and distributed in May 2010. The second and third reports were distributed in October 2010 and October 2011, respectively. This is the fourth and final report and it provides updates for all performance measures except for the indicator, attached diabetes patients (See Box 1 on page 8 for more information). Figure 1 shows the reporting time period for each of the 15 indicators in this and previous performance measures reports. Figure 1: Point‐in‐time reported for each key performance indicator 2008/09
Q3
2009/10
2010/11
2011/12
2012/13
Q4 Q1 Q2 Q3 Q4 Q1 Q2 Q3 Q4 Q1 Q2 Q3 Q4
Prevalence
Physically inactive
Overweight or obese
Attached to family doctor
Diabetes management incentives
HbA1c test in past six months
LDL‐C test in past year
Retinal eye exam within past two years All 3 tests within guideline periods
Emergency visits for hyper or hypoglycemia
Registered with Health Care Connect
Renal replacement therapy rate
Infections, ulcers, amputations rate
Heart attack (acute myocardial infarction) rate
Ocular procedure rates Key performance measure is current as of this time period: May 2010 report October 2010 report October 2011 report June 2013 (current report)
Ontario Diabetes Strategy, Key Performance Measures (June 2013)
Q1
4
Development of Key Performance Measures The Key Performance Measures for the Ontario Diabetes Strategy (ODS) were developed to enable the ministry to monitor progress in improving care and health outcomes for Ontarians with diabetes. To this end, the IM/IT Expert Reference Group of the Diabetes Expert Panel identified a core set of indicators that should be included in a diabetes registry. These indicators, along with a preliminary set of indicators approved by Cabinet, were reviewed by a sub‐group of the Expert Panel1 (see list in Appendix A) in terms of their importance, relevance and feasibility. The group also provided advice on technical specifications, suggested targets, and proposed new indicators. These recommendations were brought forward to the Expert Panel2 for further discussion and approval. Several of the indicators were acknowledged as being crucial for monitoring diabetes care, but not feasible at the time because of lack of data. It was anticipated that a diabetes registry would eventually be the appropriate source for many of these measures, however due to delays the Diabetes Registry was cancelled by eHealth Ontario in September 2012. Progress in other ODS initiatives, such as the Baseline Diabetes Dataset Initiative, has since fulfilled many of the functional “value propositions” originally associated with the registry. The key performance measures are also described in Appendix A. Subsequent to the discussions with the Expert Panel members, additional changes were made to the ODS Key Performance Measures. First, to round out the list, it was decided that population‐based information on diabetes prevalence and risk factors should be monitored on a regular basis. Second, indicators which examine the use of the diabetes management codes were added to provide information on the clinical management of diabetes patients. Finally, amendments were made to the indicators which relate to clinical practice guidelines to ensure better alignment between the ODS measures and those that were being proposed by the Baseline Diabetes Dataset Initiative (BDDI)3. The resulting set of performance measures constitutes the ODS Key Performance Measures. These measures provide information on access to care for persons with diabetes, processes of diabetes care (i.e., clinical management of diabetes patients), as well as intermediate and long‐term outcomes. For example, measures that look at whether, or the frequency with which tests such as HbA1c or LDL were done provide information about the quality of the process of care. As well, for example indicators that present the proportion of the diabetes population hospitalized for an acute myocardial infarction (AMI) provide information on outcomes of care (Kerr et al., 2004; National Quality Forum 2006; Nicolucci, Greenfield, Mattke et al., 2006). These intermediate and long‐term outcome measures reflect overall health system performance. Unlike the process and intermediate care outcomes, these measures should not be related back to individual providers. Following the distribution of the first performance measures report in May 2010, it was decided that ‘Emergency visits for hyper or hypoglycemia’ should be included as a key performance measure, and that indicators on ocular outcomes should be developed and included in future reporting. Table 1 lists the revised measures and shows how they align to the broad goals of the ODS. Technical specifications for the calculation of each indicator are provided in Appendix B.
Meeting held July 8th, 2009. Meetings held August 12th and October 5th, 2009. 3 The BDDI was developed by e‐Health; the BDDI project team developed a set of measures (to be included in reports to physicians, LHINs and province) independently of the ODS Performance Measurement workgroup. 1 2
Ontario Diabetes Strategy, Key Performance Measures (June 2013)
5
Table 1. Key Performance Measures for the Ontario Diabetes Strategy (ODS), population age 18+ OBJECTIVE Outcome
Reduce risk for diabetes
Short –term
► Percent of Ontarians who are overweight or obese
Improve management of diabetes
►Percent of Ontarians with diabetes who ► Percent of Ontarians with diabetes for whom the Diabetes Management have a family doctor Incentive (Q040) was claimed in the past ► Number of Ontarians with diabetes year registered with Health Care Connect ► Percent of Ontarians with diabetes for ► Number of Ontarians with diabetes whom the Diabetes Management referred by Health Care Connect to Assessment (K030) was claimed in the past Family Health Care Providers year ► Percent of Ontarians with diabetes for whom any Diabetes Management code was claimed in the past year Management of diabetes according to Clinical Practice Guidelines ►Percent of Ontarians with diabetes who had: HbA1c test in the past six months LDL‐C test in the past year Retinal eye exam in the past two years All three tests within the guideline periods
Intermediate or long‐term
Reduced risk and improved management / care coordination lead to decreased burden and better health outcomes
► Percent of Ontarians who are physically inactive
Increase access to diabetes care
Reduce diabetes burden ► Prevalence of diabetes in the Ontario population
Ontario Diabetes Strategy, Key Performance Measures (June 2013)
Reduce complications of diabetes ► Rate of emergency visits for high or low blood sugar levels (hyper or hypoglycemia) per 100,000 Ontarians with diabetes ► Rate of renal replacement therapy per 100,000 Ontarians with diabetes ► Hospitalization rates for infections, ulcers or amputations per 100,000 Ontarians with diabetes ► Hospitalization rates for heart attack (acute myocardial infarction) per 100,000 Ontarians with diabetes ► Rate of ocular procedures (vitrectomy & laser photocoagulation) per 100,000 Ontarians with diabetes 6
Results An indicator summary including reporting frequency, most recent available results and population targets (where applicable) is provided in Table 2. All indicators have been updated since the previous key performance report published in October 2011, unless noted in the box below. Any modifications made in this report are also provided in Box 1 below. Detailed results for each indicator are shown in the pages that follow. These are provided at both the provincial and LHIN level (for the LHIN’s population) and include historical trends where available. As well, the time periods of reporting and highlights for the findings are provided for each indicator. SubLHIN level analysis for two indicators (diabetes prevalence; all 3 tests completed within guideline periods) is provided in Appendix C. Unless otherwise stated, all analyses presented in this report are for the population age 18+. Table 2: Overview of ODS performance measures and most recent results
Current Results
Reporting frequency
Date
Result
Target
Annual
Apr 2012
10.2% 1,100,696
n/a
2 Percent of Ontarians who are physically inactive
Annual
2011
48.2%
n/a
3 Percent of Ontarians who are overweight/obese
Annual
2011
52.1%
n/a
4 Percent of Ontarians with diabetes who have a regular family doctor
Annual
Sep 2010
96.9%
5 (a) Number of Ontarians with diabetes registered with Health Care Connect (b) Number and percent of Ontarians with diabetes referred to Family Health Care Provider by Health Care Connect
Annual
Jul 31, 2012
14,374 11,501 (80%)
n/a
Indicator 1 Diabetes prevalence in Ontario population
Modifiable Risk Factors for Diabetes
Measures of Access to Care
Clinical Management Measures 6 (a) Percent of Ontarians with diabetes for whom a Diabetes Management Incentive (Q040) code was submitted in the past year (b) Percent of Ontarians with diabetes for whom a Diabetes Management Assessment (K030) code was claimed in the past year (c) Percent of Ontarians with diabetes for whom any Diabetes Management code was claimed in the past year
Annual
7 Percent of Ontarians with diabetes who received at least one HbA1c test in the past six months
Annual
28.8% 31.8%
n/a
40.6%
8 Percent of Ontarians with diabetes who received an LDL‐C test in past year
Annual
9 Percent of Ontarians with diabetes who received a retinal eye exam in the past two years
Annual
10 Percent of Ontarians with diabetes who received all three tests within the guideline periods
Annual
Ontario Diabetes Strategy, Key Performance Measures (June 2013)
Mar 31, 2012
Mar 31, 2012
56.9%
80%
Mar 31, 2012
69.0%
80%
Mar 31, 2012
66.7%
80%
Mar 31, 2012
39.2%
80%
7
Current Results
Reporting frequency
Date
11 Emergency visit rate for hyperglycemia or hypoglycemia among Ontarians with diabetes (per 100,000)
Annual
2011/12
991/100,000
n/a
12 Renal replacement therapy rate among Ontarians with diabetes (per 100,000)
Annual
2011/12
836/100,000
Maintain at current level
13 Hospitalization rate for infections, ulcers or amputations among Ontarians with diabetes (per 100,000)
Annual
2011/12
3,390/100,000
Reduce by 10%
14 Hospitalization rate for heart attacks among Ontarians with diabetes (per 100,000)
Annual
2011/12
1,018/100,000
Reduce by 10%
15 Ocular procedure rate (vitrectomy & laser photocoagulation) among Ontarians with diabetes (per 100,000)
Annual
2011/12
3,183/100,000
n/a
Indicator
Result
Target
Complications, Outcomes of Care
Box 1: Additions/Deletions and Modifications in this report: The methodology for calculating prevalence has been refined to capture all persons with diabetes at the start of each fiscal year (April 1). (See Appendix B for details). These fiscal year cohorts are then used as denominators for all performance indicators with the exception of those calculated from the Community Care Health Survey (CCHS) and the Health Care Connect Database (Indicators 2‐5). In addition to providing more recent data, all previous numbers have been updated for comparability and consistency (Indicators 6‐15). The indicator, attached diabetes patients, has not been updated due to changes in 2010 in the administration of the Primary Care Access Survey (PCAS). In addition, data collection for the PCAS ended on September 30, 2011 and a revised survey, the Health Care Experience Survey (HCES) was implemented in October 2012. However, sufficient data for more focused reporting will only be available late‐2013 (Indicator 4). The Diabetes Management Incentive code now includes two recently introduced fee schedule codes, K045 (Diabetes management by a specialist) and K046 (Diabetes Team Management). These codes are included alongside codes Q040 and K030 in the indicator, 6c: Percentage of Ontarians with diabetes (age 18+) for which any diabetes management code was claimed within the past year. The two new codes are not reported separately due to their infancy and current volumes are low. (Indicator 6). A LHIN level trend column was added to all outcome indicators (Indicators 11‐15), which compared the 2011/12 age‐adjusted rate to the 2009/10 age‐adjusted rate. Testing rates for confirmed and all diabetes patients have been removed since updates on diabetes patients have not been received as a result of the BDDI project completion.
Ontario Diabetes Strategy, Key Performance Measures (June 2013)
8
Prevalence
Risk factors
Access
Management
Outcomes
1. Diabetes prevalence Description:
Number and percent of the Ontario population (age 18+) with diabetes (type 1 or type 2)
Rationale:
Prevalence provides information on the existing burden of diabetes
Data Source: Historical estimates: Ontario Diabetes Database (ODD), Institute for Clinical Evaluative Sciences (ICES). Current estimates: Baseline Diabetes Dataset Initiative (BDDI), MOHLTC Target:
Not applicable
Provincial results Table 1.1: Diabetes prevalence among Ontario adults (age 18+) per 100 population, 2002/03 to April 2012 Time period # %
ICES ‐ historical
BDDI
2002/03
694,330
7.5
2003/04
743,639
7.9
2004/05
799,953
8.3
2005/06
865,760
8.9
2006/07
938,768
9.5
2007/08
999,442
10.0
Apr 2008
857,810
8.4
Apr 2009
911,637
8.8
Apr 2010
979,898
9.3
Apr 2011
1,042,450
9.8
Apr 2012
1,100,696
10.2
As of April 2012, there are 1,100,696 Ontarians with diabetes (age 18+); this represents a 28.3% increase (242,886 Ontarians) compared to April 2008.
The growing prevalence may be due to more newly diagnosed cases and/or persons with diabetes living longer (Hux and Tang, 2003).
The historical diabetes prevalence numbers from ICES are based on analysis of administrative data that identified probable diabetes patients using a validated algorithm. They are provided for reference and should not be compared directly with prevalence numbers/rates based on BDDI.
BDDI prevalence numbers were refined based on physicians’ review of their list of diabetes patients in 2010. Administrative data and a previously validated algorithms developed by ICES were used to identify all potential adults in Ontario with diabetes. Patient lists were sent for validation to all Primary Care Providers (PCP) to confirm whether those identified by the algorithm did have diabetes, and to allow PCPs to identify any patients with diabetes who may have been missed (i.e., add new patients). The feedback from PCPs was used to establish a more refined prevalence estimate than previously available. BDDI prevalence estimates continued to be revised and updated with each iteration of the BDDI process until the project closed in November 2012. The BDDI algorithm is current as of April 1, 2012. See Appendix B for details.
Ontario Diabetes Strategy, Key Performance Measures (June 2013)
9
LHIN results Table 1.2: Diabetes prevalence number and rates (per 100 population age 18+) by LHIN, April 2010 to April 2012
Change in % points 2010 vs. 2012
As of Apr 2010
As of Apr 2011
As of Apr 2012
#
%
#
%
#
%
Erie St. Clair
51,242
10.1%
54,321
10.7%
57,043
11.1%
1.1%
South West
67,964
9.0%
72,114
9.4%
76,015
9.8%
0.9%
Waterloo Wellington
46,324
7.9%
49,632
8.3%
52,636
8.7%
0.8%
HNHB
103,843
9.2%
109,560
9.6%
114,894
10.0%
0.7%
Central West
68,582
10.9%
73,948
11.6%
79,175
12.2%
1.3%
Mississauga Halton
78,464
8.7%
84,056
9.1%
89,460
9.5%
0.8%
Toronto Central
80,106
8.6%
84,790
9.0%
89,216
9.5%
0.9%
Central
124,858
9.0%
133,766
9.4%
142,535
9.7%
0.8%
Central East
128,569
10.2%
136,701
10.6%
143,758
10.9%
0.7%
South East
38,683
9.7%
41,228
10.2%
43,311
10.6%
1.0%
Champlain
83,817
8.4%
88,949
8.8%
93,661
9.1%
0.7%
North Simcoe Muskoka
30,356
8.3%
32,382
8.7%
34,307
9.1%
0.8%
North East
53,833
11.7%
56,760
12.3%
59,040
12.8%
1.1%
North West
21,220
11.3%
22,558
11.9%
23,783
12.5%
1.2%
LHIN unknown
2,037
1,685
1,862
979,898
9.3%
1,042,450
9.8%
1,100,696
10.2%
0.8%
LHIN
ONTARIO
The lowest and highest percentages are bolded.
As of April 2012, diabetes prevalence varies across LHINs from 8.7% in the Waterloo Wellington LHIN to 12.8% in the North East LHIN.
Since April 2010, diabetes prevalence has been increasing in all LHINs, increases ranging from 0.7% (Champlain) to 1.3% (Central West).
There is considerable variation in diabetes prevalence within LHIN areas as well as between LHIN areas. SubLHIN areas are geographic areas below the scale of LHINs. They are defined by the individual LHINs for their local planning purposes. SubLHIN area prevalence rates range from 5.7% to 18.9% (see Figures 1.1 &1.2).
Figure 1.2 shows diabetes prevalence, per 100 population age 18+ by subLHIN area. The highest prevalence rates are seen in seen in parts of Hamilton Niagara Haldimand Brant, Central West, South East North West and North East LHINs.
Ontario Diabetes Strategy, Key Performance Measures (June 2013)
10
Figure 1.1: Histogram for Diabetes prevalence rates (per 100 population age 18+) by subLHIN as of April 1, 2012 LHIN, subLHIN Erie St. Clair LHIN 101 Essex 102 Chatham‐Kent 103 Lambton South West LHIN 201 Bruce 202 Grey 203 Huron 204 Perth 205 Middlesex 206 Oxford‐Norfolk 207 Elgin Waterloo Wellington LHIN 301 Urban Waterloo & Rural Waterloo South Urban Guelph 302 303 Rural Waterloo 304 Rural‐South Grey and North Wellington 305 Rural Wellington Hamilton Niagara Haldimand Brant LHIN 401 Brant and Brantford 402 New Credit and Six Nations 403 Haldimand and Norfolk 404 Burlington 405 East Niagara 406 North Niagara 407 South Niagara 408 West Niagara 409 Stoney Creek 410 Glanbrook 411 Ancaster 412 Flamborough 413 Dundas 414 Hamilton Urban Core 415 Hamilton Outer Core Central West LHIN 501 Dufferin County 502 Malton (Mississauga) Caledon 503 504 Brampton 505 Rexdale (Toronto) 506 Woodbridge (Vaughan) Mississauga Halton LHIN 601 Milton Halton Hills 602 603 Oakville 604 Northwest Mississauga 605 Southeast Mississauga 606 South Etobicoke‐Toronto Toronto Central LHIN 701 West 702 North West 703 South West 704 North Toronto 705 South East 706 East 707 North East
Prevalence rate 11.4 12.0 10.1
IIIIIIIIIII IIIIIIIIIIII IIIIIIIIII
10.7 10.4 11.6 9.0 9.2 10.9 11.5
IIIIIIIIII IIIIIIIIII IIIIIIIIIII IIIIIIIII IIIIIIIII IIIIIIIIII IIIIIIIIIII
9.2 8.2 8.3 11.0 6.8
IIIIIIIII IIIIIIII IIIIIIII IIIIIIIIIII IIIIII
10.8 18.9 12.4 7.7 11.1 10.0 11.3 9.1 9.8 11.9 7.9 5.7 8.7 11.9 10.6
IIIIIIIIII IIIIIIIIIIIIIIIIII IIIIIIIIIIII IIIIIII IIIIIIIIIII IIIIIIIII IIIIIIIIIII IIIIIIIII IIIIIIIII IIIIIIIIIII IIIIIII IIIII IIIIIIII IIIIIIIIIII IIIIIIIIII
7.3 16.2 6.5 12.8 14.5 11.9
IIIIIII IIIIIIIIIIIIIIII IIIIII IIIIIIIIIIII IIIIIIIIIIIIII IIIIIIIIIII
10.0 8.2 7.7 8.4 11.8 10.7
IIIIIIIIII IIIIIIII IIIIIII IIIIIIII IIIIIIIIIII IIIIIIIIII
8.1 11.5 9.8 6.7 10.3 8.4 12.4
IIIIIIII IIIIIIIIIII IIIIIIIII IIIIII IIIIIIIIII IIIIIIII IIIIIIIIIIII
LHIN, subLHIN Central LHIN 801 South Simcoe & Northern York Regi on 802 Centra l York Regi on 803 Ri chmond Hi l l 804 South Wes t York Regi on 805 North York Wes t 806 North York Centra l 807 North York Ea s t 808 Ma rkha m Central East LHIN 901 North Ea s t Cl us ter 902 Durha m Cl us ter 903 Sca rborough Cl us ter South East LHIN 1001 Addi ngton, N&C Frontena c 1002 Bel l evi ll e 1003 Brockvi ll e 1004 Centra l Ha s ti ngs 1005 Ga na noque, Leeds 1006 Ki ngs ton & Is l a nds 1007 North Ha s ti ngs 1008 Pri nce Edwa rd County 1009 Qui nte Wes t, Bri ghton 1010 Ri dea u La kes 1011 SE Leeds & Grenvi l l e 1012 Smi ths Fa l l s , Perth, La na rk 1013 South Frontena c 1014 Stone Mi l l s , Loya l i s t 1015 Tyendi na ga , Na pa nee Champlain LHIN 1101 Otta wa Centre 1102 Otta wa Ea s t 1103 Otta wa Wes t 1104 Renfrew County 1105 North La na rk / North Grenvi l l e 1106 Ea s tern Counti es North Simcoe Muskoka LHIN 1201 Col l i ngwood a nd Area 1202 Ba rri e a nd Area 1203 Ori l l i a a nd Area 1204 Mi dl a nd a nd Peneta nguis hene Area 1205 Mus koka North East LHIN 1301 Al goma 1302 Ja mes a nd Huds on Ba y Coa s ts 1303 Ni pi s s i ng 1304 Pa rry Sound 1305 Ma ni toul i n‐Sudbury 1306 Ti mi s ka mi ng 1307 Cochra ne North West LHIN 1401 Kenora 1402 Ra i ny River 1403 Thunder Ba y Di s tri ct 1404 Thunder Ba y Ci ty
Prevalence rate 9.3 8.2 9.1 10.0 13.6 8.3 10.7 10.3
IIIIIIIII IIIIIIII IIIIIIIII IIIIIIIIII IIIIIIIIIIIII IIIIIIII IIIIIIIIII IIIIIIIIII
10.6 9.7 12.7
IIIIIIIIII IIIIIIIII IIIIIIIIIIII
13.4 11.9 12.0 12.4 11.0 9.3 15.7 11.3 10.9 6.9 11.0 11.2 7.9 10.0 13.3
IIIIIIIIIIIII IIIIIIIIIII IIIIIIIIIII IIIIIIIIIIII IIIIIIIIII IIIIIIIII IIIIIIIIIIIIIII IIIIIIIIIII IIIIIIIIII IIIIII IIIIIIIIII IIIIIIIIIII IIIIIII IIIIIIIII IIIIIIIIIIIII
7.7 9.6 8.1 10.2 10.1 12.6
IIIIIII IIIIIIIII IIIIIIII IIIIIIIIII IIIIIIIIII IIIIIIIIIIII
11.4 8.3 11.5 8.7 10.0
IIIIIIIIIII IIIIIIII IIIIIIIIIII IIIIIIII IIIIIIIIII
13.3
IIIIIIIIIIIII
data not shown
12.5 9.5 12.9 13.3 12.8
IIIIIIIIIIII IIIIIIIII IIIIIIIIIIII IIIIIIIIIIIII IIIIIIIIIIII
14.0 11.5 13.1 11.5
IIIIIIIIIIIIII IIIIIIIIIII IIIIIIIIIIIII IIIIIIIIIII
Ontario Diabetes Strategy, Key Performance Measures (June 2013)
11
Figure 1.2: Diabetes prevalence rates, population age 18+, by subLHIN area, April 2012 LHIN boundaries are shown in white. SubLHINs with higher prevalence of diabetes are shown as darker colours. Lower prevalence areas are shown in lighter shading.
Ontario Diabetes Strategy, Key Performance Measures (June 2013)
12
Prevalence
Risk factors
Access
Management
Outcomes
2. Physical inactivity Description:
Percent of Ontarians (age 18+) who are physically inactive
Rationale:
Physical inactivity is an independent risk factor for diabetes. Research strongly supports the benefits of physical activity in the prevention of type 2 diabetes. There is also reasonable evidence to suggest physical inactivity contributes to excess weight (which in turn contributes to diabetes). In Ontario, approximately 16% of all type 2 diabetes cases can be attributed to physical inactivity (Health System Intelligence Project/MOHLTC 2006; Ezzati, Lopez, Rodgers and Murray 2004). The burden of diabetes could be reduced substantially if physically inactive adults became moderately active.
Data Source: Canadian Community Health Survey, Statistics Canada Target:
Not applicable
Provincial results Table 2.1: Percent of Ontarians (age 18+) who are physically inactive, 2003‐2004 to 2011
a. b.
Time perioda
%
95% CIb
2003 ‐ 2004
50.8
50.0 ‐ 51.6
2005 ‐ 2006
49.4
48.5 ‐ 50.2
2007
52.5
51.3 ‐ 53.6
2008
52.6
51.4 ‐ 53.7
2009
51.2
50.0 ‐ 52.4
2010
51.0
49.6 ‐ 52.4
2011
48.2
46.9 – 49.6
The Canadian Community Health Survey collected and released data in biannual cycles from 2001‐2006; starting in 2007 data are available annually. The confidence interval indicates the degree of variability associated with an estimate; 95% confidence interval includes the estimate within its upper and lower bounds 19 times out of 20.
In 2011, just under half (48.2%) of the Ontario adult (age 18+) population were physically inactive.
Between 2003‐04 and 2011, the proportion of physically inactive adults has fluctuated within four percentage points, with the proportion being lowest (showing improvement) in 2011.
Ontario Diabetes Strategy, Key Performance Measures (June 2013)
13
LHIN results Table 2.2: Percent of adults (age 18+) who are physically inactive, by LHIN, 2008 to 2011
Time period LHIN
Change in % points 2008 vs. 2011
2008
2009
2010
2011
% (95% CI)a
% (95% CI)
% (95% CI)
% (95% CI)
Erie St. Clair
56.2 (52.3 ‐ 60.1)
53.1 (48.7 ‐ 57.6)
51.3 (46.6‐56.0)
52.2 (47.6‐56.8)
‐4.0
South West
50.6 (47.3 ‐ 53.9)
52.6 (49.3 ‐ 55.9)
49.5 (45.8‐53.2)
47.3 (43.4‐51.2)
‐3.3
Waterloo Wellington
53.7 (49.7 ‐ 57.7)
52.1 (46.9 ‐ 57.2)
44.6 (40.4‐48.7)
46.6 (42.1‐51.1)
‐7.1
HNHB
49.4 (46.4 ‐ 52.4)
47.2 (44.0 ‐ 50.4)
49.4 (45.0‐53.7)
44.6 (40.6‐48.6)
‐4.8
Central West
64.4 (58.9 ‐ 69.9)
62.8 (58.2 ‐ 67.4)
62.6 (57.6‐67.6)
57.6 (52.8‐62.4)
‐6.8
Mississauga Halton
53.9 (49.4 ‐ 58.3)
50.8 (45.8 ‐ 55.7)
51.3 (45.1‐57.5)
49.6 (43.6‐55.6)
‐4.3
Toronto Central
52.1 (47.6 ‐ 56.6)
52.3 (47.5 ‐ 57.1)
52.6 (46.7‐58.5)
43.4 (38.3‐48.5)
‐8.7
Central
57.4 (53.3 ‐ 61.4)
55.2 (50.6 ‐ 59.9)
56.3 (51.2‐61.4)
55.3 (50.8‐59.8)
‐2.1
Central East
56.5 (52.2 ‐ 60.7)
56.4 (52.3 ‐ 60.5)
56.5 (52.2‐60.8)
52.9 (48.4‐57.4)
‐3.6
South East
46.6 (43.0 ‐ 50.2)
43.3 (38.8 ‐ 47.7)
40.7 (36.2‐45.2)
43.9 (39.2‐48.7)
‐2.7
Champlain
43.2 (39.0 ‐ 47.4)
42.9 (38.7 ‐ 47.0)
44.4 (40.4‐48.3)
40.1 (36.1‐44.1)
‐3.1
North Simcoe Muskoka
48.1 (43.2 ‐ 53.1)
42.6 (37.1 ‐ 48.1)
44.3 (37.1‐51.4)
37.0 (31.6‐42.4)
‐11.1
North East
47.9 (44.7 ‐ 51.0)
46.8 (43.3 ‐ 50.3)
43.9 (40.3‐47.5)
45.9 (42.1‐49.8)
‐2.0
North West
41.6 (37.5 ‐ 45.8)
41.1 (36.3 ‐ 45.9)
44.2 (39.2‐49.2)
38.6 (32.9‐44.3)
‐3.0
ONTARIO
56.2 (52.3 ‐ 60.1)
53.1 (48.7 ‐ 57.6)
51.3 (46.6‐56.0)
48.2 (46.9‐49.6)
‐8.0
a.
The confidence interval indicates the degree of variability associated with an estimate ‐ 95% confidence interval includes the estimate within its upper and lower bounds 19 times out of 20. The lowest and highest percentages are bolded.
In 2011, in all LHINs, at least 3 out of 10 adults (age 18+) were physically inactive; the proportion was highest in the Central West LHIN (57.6%) and lowest in the North Simcoe Muskoka LHIN (37%).
From 2008 to 2011, the proportion of physically inactive adults decreased (i.e., showed improvement) in all LHINs. The largest improvement was seen among residents in North Simcoe Muskoka LHIN.
Ontario Diabetes Strategy, Key Performance Measures (June 2013)
14
Prevalence
Risk Factors
Access
Management
Outcomes
3. Overweight / Obesity Description:
Percent of Ontarians (age 18+) who are overweight or obese
Rationale:
Excess weight (determined by elevated levels of Body Mass Index (BMI)) is strongly related to an increased risk of type 2 diabetes. In Ontario, over 50% of type 2 diabetes can be attributed to obesity and an additional 27% can be attributed to overweight (Health System Intelligence Project/MOHLTC 2006; Ezzati, Lopez, Rodgers and Murray 2004).
Data Source: Canadian Community Health Survey, Statistics Canada Target:
Not applicable
Provincial results Table 3.1: Percent of Ontarians (age 18+) who are overweight or obese, 2003‐2004 to 2011
a. b.
Time perioda
%
95% CIb
2003 ‐ 2004
49.6
48.8 ‐ 50.4
2005 ‐ 2006
49.8
49.0 ‐ 50.7
2007
51.8
50.7 ‐ 52.8
2008
51.8
50.5 ‐ 53.0
2009
51.7
50.4 ‐ 52.9
2010
53.0
51.6 ‐ 54.4
2011
52.1
50.7 – 53.5
The Canadian Community Health Survey collected and released data in biannual cycles from 2001‐2006; starting in 2007 data are available annually. The confidence interval indicates the degree of variability associated with an estimate; 95% confidence interval includes the estimate within its upper and lower bounds 19 times out of 20.
In 2011, over half (52.1%) of Ontarians (age 18+) were overweight (BMI of 25.0‐29.9 kg/m2) or obese (BMI=30.0 kg/m2 or more).
The proportion of adults who are overweight/obese has increased from 49.6% to 52.1%since 2003‐04.
Ontario Diabetes Strategy, Key Performance Measures (June 2013)
15
LHIN results Table 3.2: Percent of Ontarians (age 18+) who are overweight or obese by LHIN, 2008 to 2011
Time period LHIN
2008
Change in % points 2008 vs. 2011
2009
2010
2011
% (95% CI)
% (95% CI)
% (95% CI)
% (95% CI)
Erie St. Clair
57.7 (54.0 ‐ 61.4)
61.9 (58.6 ‐ 65.3)
62.1 (57.7 ‐ 66.5)
58.8 (53.8‐63.7)
1.1
South West
56.0 (53.0 ‐ 59.0)
56.7 (53.4 ‐ 59.9)
55.2 (51.5 ‐ 59.0)
55.5 (51.6‐59.3)
‐0.5
Waterloo Wellington
53.9 (49.7 ‐ 58.0)
54.2 (49.5 ‐ 58.9)
51.2 (46.6 ‐ 55.8)
54.0 (49.2‐58.8)
0.1
HNHB
59.7 (56.9 ‐ 62.4)
56.4 (53.2 ‐ 59.6)
56.5 (52.7 ‐ 60.3)
58.1 (55.0‐61.2)
‐1.6
Central West
51.4 (45.7 ‐ 57.1)
51.0 (45.7 ‐ 56.3)
52.9 (47.4 ‐ 58.4)
52.2 (46.5‐57.9)
0.8
Mississauga Halton
49.7 (45.2 ‐ 54.3)
45.4 (40.9 ‐ 50.0)
51.3 (46.1 ‐ 56.5)
47.3 (41.6‐53.0)
‐2.4
Toronto Central
41.8 (36.9 ‐ 46.6)
37.3 (32.3 ‐ 42.4)
38.0 (33.1 ‐ 42.9)
44.1 (38.3‐50.0)
2.3
Central
43.3 (38.7 ‐ 47.8)
47.8 (43.5 ‐ 52.0)
47.7 (43.1 ‐ 52.3)
48.2 (42.9‐53.4)
4.9
Central East
49.4 (45.5 ‐ 53.3)
48.7 (44.5 ‐ 52.9)
56.7 (51.6 ‐ 61.8)
51.7 (47.1‐56.4)
2.3
South East
55.9 (52.3 ‐ 59.6)
61.7 (56.9 ‐ 66.5)
55.3 (51.0 ‐ 59.5)
53.8 (49.0‐58.6)
‐2.1
Champlain
51.1 (47.1 ‐ 55.0)
52.0 (48.2 ‐ 55.9)
55.8 (52.1 ‐ 59.5)
48.4 (44.6‐52.2)
‐2.7
North Simcoe Muskoka
57.3 (53.2 ‐ 61.4)
55.9 (50.9 ‐ 60.9)
57.4 (52.0 ‐ 62.9)
58.9 (54.2‐63.6)
1.6
North East
61.2 (58.2 ‐ 64.2)
65.0 (61.7 ‐ 68.2)
58.3 (53.9 ‐ 62.6)
57.7 (53.5‐61.8)
‐3.5
North West
59.7 (55.3 ‐ 64.1)
59.9 (56.0 ‐ 63.9)
61.7 (57.4 ‐ 66.1)
64.5 (59.5‐69.4)
4.8
ONTARIO
51.8 (50.5 ‐ 53.0)
51.7 (50.4 ‐ 52.9)
53.0 (51.6 ‐ 54.4)
52.1 (50.7‐53.5)
0.3
a
a.
The confidence interval indicates the degree of variability associated with an estimate ‐ 95% confidence interval includes the estimate within its upper and lower bounds 19 times out of 20. The lowest and highest percentages are bolded.
In 2011, in all LHINs (with the exception of the Mississauga Halton, Toronto Central, Central and Champlain LHINs), at least half of the adults were either overweight or obese. The proportion was highest in the North West LHINs (64.5%) and lowest in the Toronto Central LHIN (44.1%).
Since 2008, the proportion of overweight or obese adults has increased in eight LHINs. The largest increase is in the Central and North West LHINs (increase of 4.9 and 4.8 percentage points, respectively).
Ontario Diabetes Strategy, Key Performance Measures (June 2013)
16
Prevalence
Risk factors
Access
Management
Outcomes
4. Attached diabetes patients Description:
Percent of Ontarians (age 18+) with diabetes who are attached (i.e., have a family doctor)
Rationale:
People with diabetes who do not have access to a family physician can be less likely to seek education and counseling aimed at helping them manage their condition more effectively compared to those who receive primary care (Shah and Booth 2009).
Data Source: Primary Care Access Survey (PCAS), MOHLTC
Provincial results Table 4.1: Percent of Ontarians (age 18+) who have family doctors, Jan 2008 to Sep 2010
All Ontarians
Ontarians with diabetes
% (95% CI)a
% (95% CI)
January 2008 – December 2008
92.9 (92.2 ‐ 93.6)
96.4 (94.8 ‐ 98.0)
April 2008 – March 2009
93.2 (92.5 ‐ 93.9)
96.7 (95.3 ‐ 98.2)
July 2008 – June 2009
93.2 (92.5 ‐ 93.9)
96.8 (95.4 ‐ 98.1)
October 2008 – September 2009
93.3 (92.6 ‐ 94.0)
97.2 (95.9 ‐ 98.4)
January 2009 – December 2009
93.1 (92.3 ‐ 93.8)
97.6 (96.5 ‐ 98.7)
April 2009 – March 2010
93.4 (92.6 ‐ 94.1)
96.4 (94.4 ‐ 98.4)
July 2009 – June 2010
93.5 (92.7 ‐ 94.2)
96.7 (95.0 ‐ 98.4)
October 2009 ‐ September 2010
93.2 (92.4 ‐ 93.9)
96.9 (95.2 ‐ 98.6)
Time perioda
a. b.
PCAS collects data quarterly. To increase the precision of estimates, four consecutive quarters are combined to create a rolling year. The confidence interval indicates the degree of variability associated with an estimate. A 95% confidence interval includes the estimate within its upper and lower bounds 19 times out of 20.
As of September 2010, 97% of Ontarians (age 18+) with diabetes had a family doctor; therefore, the attachment rate remained high.
From January 2008 to September 2010, the attachment rate was consistently higher (3.0% ‐ 4.5%) among those with diabetes than in the overall population.
LHIN results The sample size is insufficient to calculate the LHIN estimates.
Ontario Diabetes Strategy, Key Performance Measures (June 2013)
17
Prevalence
Risk Factors
Access
Management
Outcomes
5a. Diabetes patients registered with Health Care Connect 5b. Diabetes patients referred to family health care providers by Health Care Connect Description:
5a: Number of Ontarians with diabetes registered with Health Care Connect from inception in February 2009
5b: Number and percent of Ontarians with diabetes registered with Health Care Connect who have been referred to Family Health Care Providers from inception in February 2009 Rationale:
People with diabetes who do not have access to a family physician can be less likely to seek education and counseling aimed at helping them manage their condition more effectively compared to those who receive primary care (Shah and Booth, 2009).
Data Source: Health Care Connect Database, MOHLTC Target:
Not applicable
Provincial results Table 5.1: Ontarians (age 18+) with diabetes registered and referred by Health Care Connect, February 2009 to July 31, 2012
Registered
#
4,768
10,335
14,374
#
2,852
6,510
11,501
%
59.8%
63.0%
80.0%
Referred
As of June 30, 2010
As of July 31, 2011
As of July 31, 2012
As of July 31, 2012, a total of 14,374 Ontarians (age 18+) with diabetes have been registered with Health Care Connect (HCC), and 80% of all persons with diabetes registered with HCC had been referred to a family health care provider.
Between June 30, 2010 and July 31, 2012, an additional 9,606 Ontarians (age 18+) with diabetes have been registered with HCC, and an additional 8,649 have been referred to a family health care provider.
Ontario Diabetes Strategy, Key Performance Measures (June 2013)
18
LHIN results Table 5.2: Ontarians (age 18+) with diabetes registered and referred by Health Care Connect, by LHIN, February 2009 to July 31, 2012
As of June 30, 2010
Registered
LHIN
As of July 31, 2011
Referred
Registered
As of July 31, 2012
Referred
Registered
Referred
#
#
%
#
#
%
#
#
%
Erie St. Clair
256
221
86.3
583
532
91.3
920
871
94.7
South West
558
447
80.1
955
713
74.7
1,509
1,296
85.9
Waterloo Wellington
151
102
67.5
365
227
62.2
499
333
66.7
HNHB
161
124
77
371
345
93
609
596
97.9
Central West
139
112
80.6
315
304
96.5
491
476
96.9
Mississauga Halton
82
71
86.6
153
125
81.7
226
214
94.7
Toronto Central
119
58
48.7
254
120
47.2
319
206
64.6
Central
180
129
71.7
387
318
82.2
604
580
96.0
Central East
560
326
58.2
1308
820
62.7
1,573
1,338
85.1
South East
392
374
95.4
738
668
90.5
1,132
1,056
93.3
Champlain
580
223
38.4
1172
567
48.4
1,450
987
68.1
North Simcoe Muskoka
243
97
39.9
750
332
44.3
1,131
1,012
89.5
North East
1,122
507
45.2
2,467
1261
51.1
3,217
2,251
70.0
North West
183
45
24.6
443
152
34.3
627
226
36.0
4,768
2,852
59.8
10,335
6,510
63
14,374
11,501
80.0
a
ONTARIO a.
Ontario totals include patients with unknown LHINs. The lowest and highest percentages are bolded.
The number of Ontarians (age 18+) with diabetes who have registered with HCC since the inception of the program in February 2009 differs greatly across LHIN areas ranging from 226 (Mississauga Halton LHIN) to 3,217 (North East LHIN).
Similarly, the number of registered diabetes patients who have been referred to a family health care provider since the inception of HCC ranges from 206 (Toronto Central LHIN) to 2,251 (North East LHIN).
Ontario Diabetes Strategy, Key Performance Measures (June 2013)
19
Prevalence
Risk Factors
Access
Managemen t
Outcomes
6a.Utilization of Diabetes Management Incentive code (Q040) 6b.Utilization of Diabetes Management Assessment code (K030) 6c. Utilization of any Diabetes Management code Description: 6a: Percent of Ontarians (age 18+) with diabetes for whom a Diabetes Management Incentive code (Q040) was claimed in the past year 6b: Percent of Ontarians (age 18+) with diabetes for whom a Diabetes Management Assessment (K030) code was claimed in the past year 6c: Percent of Ontarians (age 18+) with diabetes for whom any Diabetes Management code was claimed in the past year Rationale:
Monitoring the use of the diabetes management incentive and assessment codes provides some information on the number and proportion of diabetes patients for whom coordinated care is being documented.
Data Source: Baseline Diabetes Dataset Initiative (BDDI), MOHLTC Target:
Not applicable
Provincial results Table 6.1: Number and percentage of Ontarians with diabetes (age 18+) for whom Diabetes Management (Q040), Diabetes Assessment (K030) or any Diabetes Management code was claimed at least once within the past year
Baseline Diabetes populationa
Diabetes population 2009/10b
Diabetes population 2010/11b
Diabetes population 2011/12b
Jan 1, 2009‐ Dec 31, 2009
Apr 1, 2009‐ Mar 31, 2010
Apr 1, 2010‐ Mar 31, 2011
Apr 1, 2011– Mar 31, 2012
%
%
%
%
25.5
26.5
28.6
28.8
27.5
27.9
31.0
31.8
35.9
36.3
40.1
40.6
Code c
Q040 d
K030 e
Any Management Code a. b. c. d. e.
Baseline Diabetes population. Refer to Appendix B for details. Diabetes populations. Refer to Appendix B for details. Q040 can be claimed for a diabetes patient once during a 12 month period. As of April 2009, all family physicians can claim Q040. K030 can be claimed for a diabetes patient a maximum of 4 times during a 12 month period. Any Diabetes Management code includes Q040 and K030 as well as two new management codes, K045 (Specialist) and K046 (Team), which were introduced in October 2010 and September 2011, respectively.
Between April 1, 2011 and March 31, 2012, Q040 and K030 were claimed for 28.8% and 31.8% of Ontarians (age 18+) with diabetes, respectively. This is an increase of over 3% and over 4%, respectively, since the January 1, 2009‐December 31, 2009 period.
The proportion for whom any diabetes management code was claimed between April 1, 2011 and March 31, 2012 was 40.6%; an increase of almost 5% since January 1, 2009 period.
Ontario Diabetes Strategy, Key Performance Measures (June 2013)
20
LHIN results Table 6.2: Percentage of Ontarians with diabetes (age 18+) for whom Diabetes Management (Q040), Diabetes Assessment (K030) and any Diabetes Management code was claimed within the past year by LHIN Baseline Diabetes population
LHIN
Diabetes population 2009/10
Diabetes population 2010/11
Diabetes population 2011/12
Change in % points Jan 1, 2009 ‐ Apr 1, 2009 ‐ Apr 1, 2010 ‐ Apr 1, 2011 – for any Dec 31, 2009 Mar 31, 2010 Mar 31, 2011 Mar 31, 2012 Mgmt Any Any Any Any codec a b a b a b a b Q040 K030 Mgmt Q040 K030 Mgmt Q040 K030 Mgmt Q040 K030 Mgmt Baseline codec codec codec codec vs. 2011
Erie St. Clair
26.1
32.0
37.4
26.7
31.9
37.5
27.4
34.7
40.8
26.5
32.0
38.2
0.8
South West
33.0
40.6
47.6
34.5
41.5
48.3
37.4
44.5
52.0
36.0
43.6
50.9
3.3
Waterloo Wellington
35.7
44.2
51.0
36.4
43.6
50.6
38.4
44.5
51.9
34.7
43.7
51.4
0.4
HNHB
27.9
32.4
40.7
29.3
32.1
40.5
30.6
34.0
43.2
31.0
34.2
43.3
2.6
Central West
19.5
18.8
26.9
20.1
19.7
27.9
22.4
23.6
32.8
23.1
25.9
34.1
7.2
Mississauga Halton
22.1
25.2
32.7
23.0
26.0
33.3
25.0
28.5
36.0
24.7
28.9
36.7
4.0
Toronto Central
17.1
18.2
25.3
17.9
18.7
26.1
20.2
22.2
30.8
21.4
24.2
32.3
7.0
Central
22.1
18.7
29.0
23.7
19.4
29.9
26.3
23.8
35.5
27.3
26.4
37.4
8.4
Central East
23.5
24.9
33.0
24.5
25.6
33.8
26.7
29.8
38.2
27.8
32.2
40.2
7.2
South East
36.5
39.3
48.3
38.1
39.8
49.4
38.8
41.5
51.7
38.4
41.8
52.1
3.8
Champlain
25.3
24.8
34.6
25.2
25.3
34.3
27.5
27.8
38.2
28.7
28.7
38.4
3.8
North Simcoe Muskoka
29.8
39.4
46.1
30.8
39.1
45.4
34.4
42.5
50.2
35.1
40.9
48.9
2.8
North East
32.3
31.1
43.2
34.1
31.0
43.9
36.3
35.1
47.4
35.9
33.5
46.3
3.1
North West
18.0
16.5
24.7
18.9
16.8
25.0
20.2
19.3
27.4
19.9
20.2
26.5
1.8
LHIN unknown
27.0
26.6
36.7
20.3
20.5
27.7
24.0
26.6
34.6
25.9
29.6
37.9
1.2
ONTARIO
25.5
27.5
35.9
26.5
27.9
36.3
28.6
31.0
40.1
28.8
31.8
40.6
4.7
a. b. c.
Q040 can be claimed for a diabetes patient once during a 12 month period. As of April 2009, all family physicians can claim Q040. K030, K045 and K046 can be claimed for a diabetes patient a maximum of 4 times during a 12 month period. Any Diabetes Management code includes Q040 and K030 as well as two new management codes, K045 (Specialist) and K046 (Team), which were introduced in October 2010 and September 2011, respectively. The lowest and highest percentages are bolded.
Between April 1, 2011‐March 31, 2012, the proportion of Ontarians (age 18+) with diabetes for whom: Q040 was claimed ranged from 19.9% (North West LHIN) to 38.4% (South East LHIN); K030 was claimed ranged from 20.2% (North West LHIN) to 43.7% (Waterloo Wellington LHIN); Any diabetes management code was claimed ranged from 26.5% (North West LHIN) to 52.1% (South East LHIN). Compared to January 1‐December 31, 2009, the proportion of Ontarians with diabetes between April 2011‐March 31, 2012: increased across all LHINs for Q040 claims (except for Waterloo Wellington); increased across all LHINs for K030 claims; and increased across all LHINS for any management codes.
Ontario Diabetes Strategy, Key Performance Measures (June 2013)
21
Prevalence
Risk Factors
Access
Management
Outcomes
7. Haemoglobin A1c (HbA1c) testing frequency Description:
Percent of Ontarians (age 18+) with diabetes who received at least one HbA1c test in the past six months
Rationale:
Glycated or glycosylated hemoglobin (HbA1c) is a reliable estimate of the mean plasma (blood) glucose levels in most individuals. Regular testing of blood glucose is important in diabetes management. According to the Canadian Diabetes Association’s guidelines, “For most individuals with diabetes, A1C should be measured every 3 months to ensure that glycemic goals are being met or maintained. Testing at least every 6 months may be considered in adults during periods of treatment and lifestyle stability when glycemic targets have been consistently achieved [Grade D, Consensus]” (Pg. S34, Clinical Practice Guidelines for Diabetes, Canadian Diabetes Association 2008).
Data Source: Baseline Diabetes Dataset Initiative (BDDI), MOHLTC Target:
80%
Provincial results Table 7.1: Number and percentage of Ontarians with diabetes (age 18+) receiving at least one HbA1c test during a six‐month period, Baseline to Mar 31, 2012
Time period
#
%
Baseline Diabetes Population
July 1, 2009 ‐ Dec 31, 2009
540,014
56.2
Diabetes Patients as of April 1, 2010
Oct 1, 2009 ‐ Mar 31, 2010
556,894
56.8
Diabetes Patients as of April 1, 2011
Oct 1, 2010 ‐ Mar 31, 2011
592,047
56.8
Diabetes Patients as of April 1, 2012
Oct 1, 2011 ‐ Mar 31, 2012
625,934
56.9
a
a.
Baseline Diabetes population. Refer to Appendix B for details.
As of March 31, 2012, 56.9% of Ontarians with diabetes (age 18+) had received an HbA1c test in the past six months.
The number of people with diabetes who received an HbA1c test increased by approximately 85,900 people since baseline (i.e., between Jul 1, 2009 ‐ Dec 31, 2009). The proportion of patients receiving the test however was almost the same.
These results include only tests conducted in community laboratories; some diabetes patients may have received tests in hospital laboratories.
Ontario Diabetes Strategy, Key Performance Measures (June 2013)
22
LHIN results Table 7.2: Number and percentage of Ontarians with diabetes (age 18+) receiving at least one HbA1c test during a six‐month period, Baseline to Mar 31, 2012 by LHIN
Baseline Diabetes Populationa
Diabetes Patients as of April 1, 2010
Diabetes Patients as of April 1, 2011
Diabetes Patients as of April 1, 2012
July 1, 2009– Dec 31, 2009
Oct 1, 2009– Mar 31, 2010
Oct 1, 2010– Mar 31, 2011
Oct 1, 2011– Mar 31, 2012
LHIN
#
%
#
%
#
%
#
%
Erie St. Clair
25,774
51.2
26,861
52.4
29,701
54.7
31,919
56.0
South West
36,827
54.7
37,863
55.7
40,333
55.9
42,298
55.6
Waterloo Wellington
29,026
64.3
30,077
64.9
31,830
64.1
33,619
63.9
HNHB
59,442
58.4
61,664
59.4
64,541
58.9
67,858
59.1
Central West
37,280
56.3
38,638
56.3
41,393
56.0
44,410
56.1
Mississauga Halton
44,113
57.5
45,476
58.0
47,969
57.1
50,855
56.8
Toronto Central
41,474
52.0
41,945
52.4
43,872
51.7
46,221
51.8
Central
72,210
59.2
74,144
59.4
78,391
58.6
83,590
58.6
Central East
75,591
59.8
77,552
60.3
82,475
60.3
87,109
60.6
South East
23,773
62.8
24,946
64.5
26,275
63.7
27,530
63.6
Champlain
43,115
51.8
43,892
52.4
46,747
52.6
49,364
52.7
North Simcoe Muskoka
15,320
51.9
15,937
52.5
18,742
57.9
19,725
57.5
North East
24,319
46.2
25,232
46.9
26,477
46.6
27,392
46.4
North West
10,763
52.5
11,618
54.8
12,410
55.0
13,029
54.8
Unknown
987
‐
1,049
‐
891
‐
1,015
‐
ONTARIO
540,014
56.2
556,894
56.8
592,047
56.8
625,934
56.9
a.
Baseline Diabetes population. Refer to Appendix B for details. The lowest and highest percentages are bolded.
The proportion who received an HbA1c test in the six‐month period ending on March 31, 2012 ranged from 46.4% (North East LHIN) to 63.9% (Waterloo Wellington LHIN).
In all three reporting periods the proportion who had received an HbA1c test was consistently highest among people with diabetes in the Waterloo Wellington LHIN, and consistently lowest among those in the North East LHIN.
Compared with the baseline, the number of patients who received an HbA1c test has increased in all LHINs; however, the proportion has increased in nine of the fourteen LHINs.
These results include only tests conducted in community laboratories; some diabetes patients may have received the tests in hospital laboratories. Furthermore, there may be gaps in the completeness of lab test data from a small number of rural labs. These labs are located in Winchester, Fergus, Huntsville & Bracebridge. Although these labs account for less than 1% of all submitted lab services, it may impact the testing rates for physicians in these communities.
Ontario Diabetes Strategy, Key Performance Measures (June 2013)
23
Prevalence
Risk Factors
Access
Management
Outcomes
8. Low Density Lipoprotein Cholesterol (LDL‐C) testing frequency Description:
Percent of Ontarians (age 18+) with diabetes who have received an LDL test in the past year.
Rationale:
Vascular disease is a common complication of diabetes. Control of cholesterol is associated with a risk reduction for vascular disease including cardiovascular events. Patients with diabetes need regular monitoring of the cholesterol levels. According to the Canadian Diabetes Association’s guidelines, LDL‐C should be tested at the time of diagnosis and every 1‐3 years (Pg. S34, Clinical Practice Guidelines for Diabetes, Canadian Diabetes Association, 2008).
Data Source: Baseline Diabetes Dataset Initiative (BDDI), MOHLTC Target:
80%
Provincial results Table 8.1: Number and percent of Ontarians with diabetes (age 18+) receiving LDL‐C test during one‐ year period, Baseline to Mar 31, 2012
Time period
#
%
Baseline Diabetes Population
Jan 1, 2009 ‐ Dec 31, 2009
659,833
68.6
Diabetes Patients as of April 1, 2010
Apr 1, 2009 ‐ Mar 31, 2010
676,850
69.1
Diabetes Patients as of April 1, 2011
Apr 1, 2010 ‐ Mar 31, 2011
724,271
69.5
Diabetes Patients as of April 1, 2012
Apr 1, 2011 ‐ Mar 31, 2012
759,265
69.0
a
a.
Baseline Diabetes population. Refer to Appendix B for details.
The number of people with diabetes who received an LDL‐C test within the 12 months prior to Mar 31, 2012 increased by approximately 99,400 compared with baseline (i.e., between Jan 1, 2009 ‐ Dec 31, 2009). However, the proportion who received the test was almost the same (69.0% versus 68.6%).
These results include only tests conducted in community laboratories; some patients may have received the tests in hospital laboratories.
Ontario Diabetes Strategy, Key Performance Measures (June 2013)
24
LHIN results Table 8.2. Number and percent of Ontarians with diabetes (age 18+) receiving LDL‐C test during a one‐ year period, Baseline to Mar 31, 2012 by LHIN
Baseline Diabetes Populationa
Diabetes Patients as of April 1, 2010
Diabetes Patients as of April 1, 2011
Diabetes Patients as of April 1, 2012
Jan 1, 2009– Dec 31, 2009
Apr 1, 2009– Mar 31, 2010
Apr 1, 2010– Mar 31, 2011
Apr 1, 2011– Mar 31, 2012
LHIN
#
%
#
%
#
%
#
%
Erie St. Clair
31,661
62.9
32,735
63.9
36,309
66.8
39,094
68.5
South West
41,620
61.8
42,404
62.4
45,604
63.2
47,501
62.5
Waterloo Wellington
32,135
71.2
33,082
71.4
35,474
71.5
37,001
70.3
HNHB
72,114
70.8
74,160
71.4
78,031
71.2
81,140
70.6
Central West
48,175
72.7
49,993
72.9
54,040
73.1
57,903
73.1
Mississauga Halton
56,670
73.9
58,403
74.4
61,820
73.5
65,387
73.1
Toronto Central
52,621
66.0
53,139
66.3
55,985
66.0
58,544
65.6
Central
90,959
74.6
93,586
75.0
100,124
74.9
106,196
74.5
Central East
93,848
74.2
95,716
74.4
102,204
74.8
106,663
74.2
South East
26,623
70.3
27,406
70.8
29,302
71.1
29,902
69.0
Champlain
55,065
66.1
55,675
66.4
59,228
66.6
62,079
66.3
North Simcoe Muskoka
17,911
60.7
18,634
61.4
21,703
67.0
22,641
66.0
North East
28,014
53.2
28,730
53.4
30,400
53.6
30,785
52.1
North West
11,228
54.7
11,897
56.1
12,966
57.5
13,182
55.4
Unknown
1,189
‐
1,290
‐
1,081
‐
1,247
‐
ONTARIO
659,833
68.6
676,850
69.1
724,271
69.5
759,265
69.0
a.
Baseline Diabetes population. Refer to Appendix B for details. The lowest and highest percentages are bolded.
The proportion of people with diabetes who received an LDL‐C test in the last reported one‐year period (i.e., between Apr 1, 2011 and Mar 31, 2012) ranged from 52.1% in the North East LHIN to 74.5% in the Central LHIN. In all LHIN areas, except the North East and North West, at least 62% of those with diabetes had received an LDL‐C test in the past year.
In all LHINs, the number of patients who received an LDL‐C test within the 12 months prior to March 31, 2012 is higher than during baseline; however, the proportion of those tested improved notably in only two LHINs (Erie St. Clair and North Simcoe Muskoka).
These results include only tests conducted in community laboratories; some diabetes patients may have received the tests in hospital laboratories. Furthermore, there may be gaps in the completeness of lab test data from a small number of rural labs. These labs are located in Winchester, Fergus, Huntsville & Bracebridge. Although these labs account for less than 1% of all submitted lab services, it may impact the testing rates for physicians in these communities.
Ontario Diabetes Strategy, Key Performance Measures (June 2013)
25
Prevalence
Risk Factors
Access
Management
Outcomes
9. Retinal Eye Exam testing frequency Description: Percent of Ontarians (age 18+) with diabetes who have received a retinal eye exam within the past two years. Rationale:
Diabetic retinopathy is a common complication of diabetes. It is the leading cause of new cases of blindness among adults of working age. Effective and timely screening for diabetic retinopathy can help reduce vision loss. According to the Canadian Diabetes Association’s guidelines, “In individuals with type 2 diabetes, screening and evaluation for diabetic retinopathy by an expert professional should be performed at the time of diagnosis of diabetes. The interval for follow‐up assessments should be tailored to the severity of the retinopathy. In those with no or minimal retinopathy, the recommended interval is 1 to 2 years” (Pg. S34, Clinical Practice Guidelines for Diabetes, Canadian Diabetes Association 2008).
Data Source: Baseline Diabetes Dataset Initiative (BDDI), MOHLTC. Target:
80%
Provincial results Table 9.1: Number and percent of Ontarians with diabetes (age 18+) receiving retinal eye exam during a two‐year period, Baseline to Mar 31, 2012
Time period
#
%
Baseline Diabetes Population
July 1, 2009 ‐ Dec 31, 2009
627,838
65.3
Diabetes Patients as of April 1, 2010
Oct 1, 2009 ‐ Mar 31, 2010
640,628
65.4
Diabetes Patients as of April 1, 2011
Oct 1, 2010 ‐ Mar 31, 2011
690,504
66.2
Diabetes Patients as of April 1, 2012
Oct 1, 2011 ‐ Mar 31, 2012
734,270
66.7
a
a.
Baseline Diabetes population. Refer to Appendix B for details.
The number of people with diabetes who received a retinal eye exam within the one year prior to March 31, 2012 increased by approximately 106,400 compared to baseline (i.e. Jul 1, 2009 – Dec 31, 2009), while the proportion of those who received eye exams is 1.4 percentage points higher.
These results include only retinal eye exams where a fee‐for‐service claim was submitted; some patients may have had a retinal eye exam performed by a provider who did not submit a claim or shadow billing.
Ontario Diabetes Strategy, Key Performance Measures (June 2013)
26
LHIN results Table 9.2: Number and percent of Ontarians with diabetes (age 18+) receiving retinal eye exam during a two‐year period, Baseline to Mar 31, 2012 by LHIN
Baseline Diabetes Populationa
Diabetes Patients as of April 1, 2010
Diabetes Patients as of April 1, 2011
Diabetes Patients as of April 1, 2012
Jan 1, 2008– Dec 31, 2009
Apr 1, 2008– Mar 31, 2010
Apr 1, 2009– Mar 31, 2010
Apr 1, 2011– Mar 31, 2012
LHIN
#
%
#
%
#
%
#
%
Erie St. Clair
34,602
68.7
35,207
68.7
37,605
69.2
39,557
69.3
South West
46,429
68.9
47,126
69.3
50,709
70.3
53,756
70.7
Waterloo Wellington
31,138
69.0
32,119
69.3
34,631
69.8
36,702
69.7
HNHB
69,133
67.9
70,716
68.1
75,311
68.7
79,513
69.2
Central West
39,023
58.9
40,314
58.8
44,818
60.6
49,017
61.9
Mississauga Halton
48,300
63.0
49,369
62.9
53,487
63.6
57,407
64.2
Toronto Central
47,587
59.7
47,799
59.7
51,317
60.5
54,481
61.1
Central
76,137
62.4
77,989
62.5
84,917
63.5
91,476
64.2
Central East
82,470
65.2
83,858
65.2
90,200
66.0
95,875
66.7
South East
26,543
70.1
27,315
70.6
29,504
71.6
30,843
71.2
Champlain
54,988
66.0
55,445
66.2
59,545
66.9
63,041
67.3
North Simcoe Muskoka
19,743
66.9
20,451
67.4
22,176
68.5
23,755
69.2
North East
36,798
69.9
37,594
69.8
40,205
70.8
41,930
71.0
North West
13,831
67.4
14,146
66.7
15,080
66.8
15,830
66.6
Unknown
1,116
‐
1,180
‐
999
‐
1,087
‐
ONTARIO
627,838
65.3
640,628
65.4
690,504
66.2
734,270
66.7
a.
Baseline Diabetes population. Refer to Appendix B for details. The lowest and highest percentages are bolded.
The most recent results show that retinal eye exam testing rates are highest among diabetes patients in the South East LHIN (71.2%), and lowest among those in the Toronto Central LHIN (61.1%).
In all LHINs, the number and proportion of people with diabetes who received a retinal eye exam as of April 1, 2012 is slightly higher than during baseline.
These results include only retinal eye exams where a fee‐for‐service claim was submitted; some patients may have had a retinal eye exam performed by a provider who did not submit a claim or shadow billing.
Ontario Diabetes Strategy, Key Performance Measures (June 2013)
27
Prevalence
Risk Factors
Access
Management
Outcomes
10. All 3 tests within guideline periods (composite indicator) Description: Percent of Ontarians (age 18+) with diabetes who have received all three tests (HbA1c, LDL‐C and retinal eye exam) within the appropriate guideline periods. Rationale: The use of a composite indicator has been shown to be effective in spurring improvements in diabetes management. Other jurisdictions have seen substantial improvements in short periods of time after reporting of composite indicators for diabetes care was introduced. Rates for combined measures are lower than individual measures but this can stimulate action, focus attention on patients and emphasize a systems approach to patient care (Nolan and Berwick 2006; Amundson et al., 2007; Kelley 2007). Data Source: Baseline Diabetes Dataset Initiative (BDDI), MOHLTC. Target:
80%
Provincial results Table 10.1: Number and percent of Ontarians with diabetes (age 18+) receiving all three tests within guideline periods, Baseline to Mar 31, 2012
Time period
#
%
Baseline Diabetes Population
July 1, 2009 ‐ Dec 31, 2009
361,192
37.6
Diabetes Patients as of April 1, 2010
Oct 1, 2009 ‐ Mar 31, 2010
370,388
37.8
Diabetes Patients as of April 1, 2011
Oct 1, 2010 ‐ Mar 31, 2011
405,036
38.9
Diabetes Patients as of April 1, 2012
Oct 1, 2011 ‐ Mar 31, 2012
431,915
39.2
a
a.
Baseline Diabetes population. Refer to Appendix B for details.
Compared with the baseline (i.e. Jul 1, 2009 – Dec 31, 2009), an additional 70,700 people with diabetes had received all three tests within guideline periods by March 31, 2012, and the proportion of those who received all three tests increased from 37.6% to 39.2%.
These results include only HbA1c and LDL‐C tests conducted in community laboratories (some diabetes patients may have received HbA1c tests in hospital laboratories) and retinal eye exams where a fee‐for‐ service claim was submitted (some patients may have had a retinal eye exam performed by a provider who did not submit a claim or shadow billing).
Figure 10.2 shows the proportion of people with diabetes, age 18+, who had all three tests (HbA1c, LDL‐C and retinal eye exam) completed within guideline periods, by subLHIN area. The lowest testing rates are seen in parts of South West, North Simcoe Muskoka, North East and North West LHINs4.
4
Testing may be artificially low in some rural areas where there are few or no community labs. In these areas, patients may be receiving HbA1c and LDL‐C tests at hospitals but these are not captured in our analysis.
Ontario Diabetes Strategy, Key Performance Measures (June 2013)
28
LHIN results Table 10.1: Number and percent of Ontarians with diabetes (age 18+) receiving all three tests within guideline periods, Baseline to Mar 31, 2012 by LHIN
Baseline Diabetes Populationa
Diabetes Patients as of April 1, 2010
Diabetes Patients as of April 1, 2011
Diabetes Patients as of April 1, 2012
July 1, 2009– Dec 31, 2009
Apr 1, 2009– Mar 31, 2010
Apr 1, 2010– Mar 31, 2011
Apr 1, 2011– Mar 31, 2012
LHIN
#
%
#
%
#
%
#
%
Erie St. Clair
17,241
34.2
17,884
34.9
20,531
37.8
22,406
39.3
South West
24,568
36.5
25,252
37.2
27,786
38.5
29,369
38.6
Waterloo Wellington
19,824
43.9
20,462
44.2
22,136
44.6
23,285
44.2
HNHB
40,748
40.0
42,134
40.6
44,923
41.0
47,568
41.4
Central West
23,816
36.0
24,409
35.6
27,221
36.8
30,002
37.9
Mississauga Halton
30,029
39.2
30,727
39.2
33,075
39.3
35,652
39.9
Toronto Central
26,535
33.3
26,760
33.4
28,843
34.0
30,920
34.7
Central
48,203
39.5
49,147
39.4
53,759
40.2
58,185
40.8
Central East
51,335
40.6
52,192
40.6
57,117
41.8
60,677
42.2
South East
16,206
42.8
16,940
43.8
18,340
44.5
18,940
43.7
Champlain
29,087
34.9
29,519
35.2
32,167
36.2
34,175
36.5
North Simcoe Muskoka
9,940
33.7
10,350
34.1
12,569
38.8
13,493
39.3
North East
16,618
31.5
17,128
31.8
18,415
32.4
18,835
31.9
North West
6,387
31.1
6,819
32.1
7,549
33.5
7,758
32.6
Unknown
655
‐
665
‐
605
‐
650
‐
ONTARIO
361,192
37.6
370,388
37.8
405,036
38.9
431,915
39.2
a.
Baseline Diabetes population. Refer to Appendix B for details. The lowest and highest percentages are bolded.
The most recent results show that the number and proportion of people receiving all three tests within guideline periods has increased across all LHINs since baseline.
The proportion of diabetes patients tested within the guideline periods prior to March 31, 2012 ranged from 31.9% in the North East LHIN to 44.2% in the Waterloo Wellington LHIN.
In all four reporting periods, the proportion of people with diabetes receiving HbA1c, LDL‐C and retinal eye exam tests within guideline periods was consistently highest in the Waterloo Wellington LHIN.
The largest improvement in testing rates since baseline is for patients in North Simcoe Muskoka, Erie St. Clair, South West, Central West and Champlain LHINs.
There is considerable variation between LHIN areas (SubLHINs). The SubLHIN area testing rates range from 13.5% to 52.4% (see Figures 10.1 & 10.2).
These results include only HbA1c and LDL‐C tests conducted in community laboratories (some diabetes patients may have received HbA1c tests in hospital laboratories) and retinal eye exams where a fee‐for‐ service claim was submitted (some patients may have had a retinal eye exam performed by a provider who did not submit a claim or shadow billing).
Ontario Diabetes Strategy, Key Performance Measures (June 2013)
29
Figure 10.1: Histogram for percent of Ontarians with (age 18+) receiving all three tests within guideline periods, by subLHIN as of March 31, 2012 LHIN, subLHIN Erie St. Clair LHIN 101 Essex 102 Chatham‐Kent 103 Lambton South West LHIN 201 Bruce 202 Grey 203 Huron 204 Perth 205 Middlesex 206 Oxford‐Norfolk 207 Elgin Waterloo Wellington LHIN 301 Urban Waterloo & Rural Waterloo South 302 Urban Guelph 303 Rural Waterloo 304 Rural‐South Grey and North Wellington 305 Rural Wellington Hamilton Niagara Haldimand Brant LHIN 401 Brant and Brantford 402 New Credit and Six Nations 403 Haldimand and Norfolk 404 Burlington 405 East Niagara 406 North Niagara 407 South Niagara 408 West Niagara 409 Stoney Creek 410 Glanbrook 411 Ancaster 412 Flamborough 413 Dundas 414 Hamilton Urban Core 415 Hamilton Outer Core Central West LHIN 501 Dufferin County 502 Malton (Mississauga) 503 Caledon 504 Brampton 505 Rexdale (Toronto) 506 Woodbridge (Vaughan) Mississauga Halton LHIN 601 Milton 602 Halton Hills 603 Oakville 604 Northwest Mississauga 605 Southeast Mississauga 606 South Etobicoke‐Toronto Toronto Central LHIN 701 West 702 North West 703 South West 704 North Toronto 705 South East 706 East 707 North East
All 3 tests within guideline period (%) 40.3 41.9 33.8
IIIIIIIIIIIIIIIIIIIIIIIIIIIIIIIIIIIIIIII IIIIIIIIIIIIIIIIIIIIIIIIIIIIIIIIIIIIIIIII IIIIIIIIIIIIIIIIIIIIIIIIIIIIIIIII
18.5 33.9 37.8 44.9 41.1 41.4 39.9
IIIIIIIIIIIIIIIIII IIIIIIIIIIIIIIIIIIIIIIIIIIIIIIIII IIIIIIIIIIIIIIIIIIIIIIIIIIIIIIIIIIIII IIIIIIIIIIIIIIIIIIIIIIIIIIIIIIIIIIIIIIIIIIII IIIIIIIIIIIIIIIIIIIIIIIIIIIIIIIIIIIIIIIII IIIIIIIIIIIIIIIIIIIIIIIIIIIIIIIIIIIIIIIII IIIIIIIIIIIIIIIIIIIIIIIIIIIIIIIIIIIIIII
44.2 46.6 45.7 31.4 45.9
IIIIIIIIIIIIIIIIIIIIIIIIIIIIIIIIIIIIIIIIIIII IIIIIIIIIIIIIIIIIIIIIIIIIIIIIIIIIIIIIIIIIIIIII IIIIIIIIIIIIIIIIIIIIIIIIIIIIIIIIIIIIIIIIIIIII IIIIIIIIIIIIIIIIIIIIIIIIIIIIIII IIIIIIIIIIIIIIIIIIIIIIIIIIIIIIIIIIIIIIIIIIIII
43.0 38.0 43.7 42.6 41.6 39.1 43.3 47.1 41.1 44.6 39.4 42.7 41.0 34.6 41.4
IIIIIIIIIIIIIIIIIIIIIIIIIIIIIIIIIIIIIIIIIII IIIIIIIIIIIIIIIIIIIIIIIIIIIIIIIIIIIII IIIIIIIIIIIIIIIIIIIIIIIIIIIIIIIIIIIIIIIIIII IIIIIIIIIIIIIIIIIIIIIIIIIIIIIIIIIIIIIIIIII IIIIIIIIIIIIIIIIIIIIIIIIIIIIIIIIIIIIIIIII IIIIIIIIIIIIIIIIIIIIIIIIIIIIIIIIIIIIIII IIIIIIIIIIIIIIIIIIIIIIIIIIIIIIIIIIIIIIIIIII IIIIIIIIIIIIIIIIIIIIIIIIIIIIIIIIIIIIIIIIIIIIIII IIIIIIIIIIIIIIIIIIIIIIIIIIIIIIIIIIIIIIIII IIIIIIIIIIIIIIIIIIIIIIIIIIIIIIIIIIIIIIIIIIII IIIIIIIIIIIIIIIIIIIIIIIIIIIIIIIIIIIIIII IIIIIIIIIIIIIIIIIIIIIIIIIIIIIIIIIIIIIIIIII IIIIIIIIIIIIIIIIIIIIIIIIIIIIIIIIIIIIIIIII IIIIIIIIIIIIIIIIIIIIIIIIIIIIIIIIII IIIIIIIIIIIIIIIIIIIIIIIIIIIIIIIIIIIIIIIII
42.5 37.5 37.0 36.5 40.6 41.0
IIIIIIIIIIIIIIIIIIIIIIIIIIIIIIIIIIIIIIIIII IIIIIIIIIIIIIIIIIIIIIIIIIIIIIIIIIIIII IIIIIIIIIIIIIIIIIIIIIIIIIIIIIIIIIIIII IIIIIIIIIIIIIIIIIIIIIIIIIIIIIIIIIIII IIIIIIIIIIIIIIIIIIIIIIIIIIIIIIIIIIIIIIII IIIIIIIIIIIIIIIIIIIIIIIIIIIIIIIIIIIIIIII
37.6 40.3 42.3 39.5 40.2 38.2
IIIIIIIIIIIIIIIIIIIIIIIIIIIIIIIIIIIII IIIIIIIIIIIIIIIIIIIIIIIIIIIIIIIIIIIIIIII IIIIIIIIIIIIIIIIIIIIIIIIIIIIIIIIIIIIIIIIII IIIIIIIIIIIIIIIIIIIIIIIIIIIIIIIIIIIIIII IIIIIIIIIIIIIIIIIIIIIIIIIIIIIIIIIIIIIIII IIIIIIIIIIIIIIIIIIIIIIIIIIIIIIIIIIIIII
34.6 36.2 31.1 35.1 30.1 36.7 38.4
IIIIIIIIIIIIIIIIIIIIIIIIIIIIIIIIII IIIIIIIIIIIIIIIIIIIIIIIIIIIIIIIIIIII IIIIIIIIIIIIIIIIIIIIIIIIIIIIIII IIIIIIIIIIIIIIIIIIIIIIIIIIIIIIIIIII IIIIIIIIIIIIIIIIIIIIIIIIIIIIII IIIIIIIIIIIIIIIIIIIIIIIIIIIIIIIIIIII IIIIIIIIIIIIIIIIIIIIIIIIIIIIIIIIIIIIII
LHIN, subLHIN Central LHIN 801 South Si mcoe & Northern York Regi on 802 Centra l York Region 803 Richmond Hi ll 804 South Wes t York Region 805 North York Wes t 806 North York Central 807 North York Ea st 808 Ma rkham Central East LHIN 901 North Ea st Cl uster 902 Durha m Cl us ter 903 Sca rborough Cluster South East LHIN 1001 Addington, N&C Frontena c 1002 Bel levill e 1003 Brockvill e 1004 Centra l Ha sti ngs 1005 Gananoque, Leeds 1006 Kingston & Is lands 1007 North Ha stings 1008 Prince Edward County 1009 Qui nte West, Brighton 1010 Ridea u Lakes 1011 SE Leeds & Grenvi lle 1012 Smi ths Fal ls, Perth, Lanark 1013 South Frontena c 1014 Stone Mill s, Loyal ist 1015 Tyendinaga, Na pa nee Champlain LHIN 1101 Otta wa Centre 1102 Otta wa Eas t 1103 Otta wa West 1104 Renfrew County 1105 North La na rk / North Grenvil le 1106 Eas tern Counties North Simcoe Muskoka LHIN 1201 Col lingwood and Area 1202 Barrie a nd Area 1203 Oril lia a nd Area 1204 Midla nd a nd Peneta nguis hene Area 1205 Muskoka North East LHIN 1301 Algoma 1302 James a nd Hudson Bay Coas ts 1303 Nipiss ing 1304 Parry Sound 1305 Ma nitoulin‐Sudbury 1306 Timis ka mi ng 1307 Cochra ne North West LHIN 1401 Kenora 1402 Rai ny Ri ver 1403 Thunder Ba y Dis trict 1404 Thunder Ba y City
Ontario Diabetes Strategy, Key Performance Measures (June 2013)
All 3 tests within guideline period (%) 39.1 38.4 40.2 41.3 40.3 40.3 41.5 43.4
IIIIIIIIIIIIIIIIIIIIIIIIIIIIIIIIIIIIIII IIIIIIIIIIIIIIIIIIIIIIIIIIIIIIIIIIIIII IIIIIIIIIIIIIIIIIIIIIIIIIIIIIIIIIIIIIIII IIIIIIIIIIIIIIIIIIIIIIIIIIIIIIIIIIIIIIIII IIIIIIIIIIIIIIIIIIIIIIIIIIIIIIIIIIIIIIII IIIIIIIIIIIIIIIIIIIIIIIIIIIIIIIIIIIIIIII IIIIIIIIIIIIIIIIIIIIIIIIIIIIIIIIIIIIIIIII IIIIIIIIIIIIIIIIIIIIIIIIIIIIIIIIIIIIIIIIIII
44.9 41.3 41.7
IIIIIIIIIIIIIIIIIIIIIIIIIIIIIIIIIIIIIIIIIIII IIIIIIIIIIIIIIIIIIIIIIIIIIIIIIIIIIIIIIIII IIIIIIIIIIIIIIIIIIIIIIIIIIIIIIIIIIIIIIIII
47.8 44.4 34.8 52.4 47.2 44.7 39.9 47.1 43.8 45.4 41.4 39.7 45.2 46.5 43.7
IIIIIIIIIIIIIIIIIIIIIIIIIIIIIIIIIIIIIIIIIIIIIII IIIIIIIIIIIIIIIIIIIIIIIIIIIIIIIIIIIIIIIIIIII IIIIIIIIIIIIIIIIIIIIIIIIIIIIIIIIII IIIIIIIIIIIIIIIIIIIIIIIIIIIIIIIIIIIIIIIIIIIIIIIIIII IIIIIIIIIIIIIIIIIIIIIIIIIIIIIIIIIIIIIIIIIIIIIII IIIIIIIIIIIIIIIIIIIIIIIIIIIIIIIIIIIIIIIIIIII IIIIIIIIIIIIIIIIIIIIIIIIIIIIIIIIIIIIIII IIIIIIIIIIIIIIIIIIIIIIIIIIIIIIIIIIIIIIIIIIIIIII IIIIIIIIIIIIIIIIIIIIIIIIIIIIIIIIIIIIIIIIIII IIIIIIIIIIIIIIIIIIIIIIIIIIIIIIIIIIIIIIIIIIIII IIIIIIIIIIIIIIIIIIIIIIIIIIIIIIIIIIIIIIIII IIIIIIIIIIIIIIIIIIIIIIIIIIIIIIIIIIIIIII IIIIIIIIIIIIIIIIIIIIIIIIIIIIIIIIIIIIIIIIIIIII IIIIIIIIIIIIIIIIIIIIIIIIIIIIIIIIIIIIIIIIIIIIII IIIIIIIIIIIIIIIIIIIIIIIIIIIIIIIIIIIIIIIIIII
33.8 35.2 36.5 34.2 37.0 40.6
IIIIIIIIIIIIIIIIIIIIIIIIIIIIIIIII IIIIIIIIIIIIIIIIIIIIIIIIIIIIIIIIIII IIIIIIIIIIIIIIIIIIIIIIIIIIIIIIIIIIII IIIIIIIIIIIIIIIIIIIIIIIIIIIIIIIIII IIIIIIIIIIIIIIIIIIIIIIIIIIIIIIIIIIIII IIIIIIIIIIIIIIIIIIIIIIIIIIIIIIIIIIIIIIII
40.5 40.9 42.2 24.4 41.8
IIIIIIIIIIIIIIIIIIIIIIIIIIIIIIIIIIIIIIII IIIIIIIIIIIIIIIIIIIIIIIIIIIIIIIIIIIIIIII IIIIIIIIIIIIIIIIIIIIIIIIIIIIIIIIIIIIIIIIII IIIIIIIIIIIIIIIIIIIIIIII IIIIIIIIIIIIIIIIIIIIIIIIIIIIIIIIIIIIIIIII
43.5
IIIIIIIIIIIIIIIIIIIIIIIIIIIIIIIIIIIIIIIIIII
24.8 43.5 31.7 28.2 20.6
IIIIIIIIIIIIIIIIIIIIIIII IIIIIIIIIIIIIIIIIIIIIIIIIIIIIIIIIIIIIIIIIII IIIIIIIIIIIIIIIIIIIIIIIIIIIIIII IIIIIIIIIIIIIIIIIIIIIIIIIIII IIIIIIIIIIIIIIIIIIII
28.0 32.3 13.5 39.1
IIIIIIIIIIIIIIIIIIIIIIIIIIII IIIIIIIIIIIIIIIIIIIIIIIIIIIIIIII IIIIIIIIIIIII IIIIIIIIIIIIIIIIIIIIIIIIIIIIIIIIIIIIIII
data not shown
30
Figure 10.2: Testing rates for all 3 tests completed within guideline periods as of March 31, 2012, by subLHIN area LHIN boundaries are shown in white. SubLHINs with lower testing rates are shown as darker colours. Areas with higher testing rates are shown in lighter shading.
Ontario Diabetes Strategy, Key Performance Measures (June 2013)
31
Prevalence
Risk Factors
Access
Management
Outcomes
11. Emergency visits for hyper/hypoglycemia Description:
Rate of emergency visits for hyperglycemia or hypoglycemia per 100,000 Ontario population (age 18+) with diabetes.
Rationale:
Emergency visits for diabetes patients with blood sugar levels that are dangerously high (hyperglycemic) or dangerously low (hypoglycemic) should be largely avoidable if diabetes is effectively managed. Glycemic emergencies can be the result of variations in proper care, misadministration of insulin or failure to follow a proper diet. Improved management of diabetes patients is expected to result in better glycemic control and therefore to prevent acute hyperglycemic or hypoglycemic episodes.
Data Source: Historical estimates: Ontario Diabetes Database (ODD), Institute for Clinical Evaluative Sciences (ICES). Current estimates: Baseline Diabetes Dataset Initiative (BDDI), MOHLTC; and National Ambulatory Care Reporting System (NACRS), Canadian Institue for Health Information (CIHI). Target:
Not applicable
Provincial results Table 11.1: Number and rate of emergency visits for hyper/hypoglycemia per 100,000 Ontarians (age 18+) with diabetes, 2002/03 to 2011/12 Rate per 100,000
b ICES – historical
Diabetes patients, BDDI
Time period
#
Crude
Age‐adjusteda
2002/03
13,510
1,949
‐
2003/04
15,168
2,045
‐
2004/05
16,466
2,067
‐
2005/06
16,948
1,969
‐
2006/07
14,524
1,568
‐
2007/08
13,836
1,427
‐
2008/09
11,275
1,314
1,321
2009/10
10,491
1,151
1,161
2010/11
10,463
1,068
1,082
2011/12
10,175
976
991
a. Rates are age‐adjusted to control for differences in age composition of population over time. b. Historical analyses (from ICES) are provided for context. Results based on BDDI should not be compared with results from ICES.
During 2011/12, Ontarians with diabetes made 10,175 visits to emergency rooms for hyper or hypoglycemia.
Both the crude and age‐adjusted rates have been decreasing (i.e., improving) since 2008/09.
Ontario Diabetes Strategy, Key Performance Measures (June 2013)
32
LHIN results Table 11.2: Number and rate of emergency visits for hyper/hypoglycemia per 100,000 diabetes population (age 18+) in Ontario by LHIN, 2009/10 to 2011/12
2009/10
2010/11
Rate per 100,000
Rate per 100,000
Rate per 100,000
Trend
#
Crude
Age‐ adjusteda
#
Crude
Age‐ adjusteda
#
Crude
Age‐ adjusteda
Erie St. Clair
660
1,374
1,417
656
1,280
1,327
625
1,151
1,184
South West
947
1,497
1,558
950
1,398
1,487
913
1,266
1,341
Waterloo Wellington
448
1,053
1,061
412
889
908
418
842
855
1,263
1,301
1,352
1,300
1,252
1,309
1,136
1,037
1,097
Central West
434
691
711
516
752
784
518
700
718
Mississauga Halton
589
818
823
591
753
757
560
666
672
Toronto Central
830
1,106
1,092
901
1,125
1,116
887
1,046
1,040
Central
885
764
759
877
702
703
872
652
654
Central East
1,251
1,044
1,047
1,182
919
922
1,228
898
904
South East
656
1,822
1,958
696
1,799
1,949
722
1,751
1,920
Champlain
947
1,212
1,242
935
1,116
1,146
908
1,021
1,051
North Simcoe Muskoka
479
1,696
1,775
424
1,397
1,455
398
1,229
1,293
North East
761
1,507
1,575
703
1,306
1,371
673
1,186
1,253
North West
317
1,596
1,569
290
1,367
1,344
300
1,330
1,313
LHIN unknown
24
‐
‐
30
‐
‐
17
‐
‐
10,491
1,151
1,161
10,463
1,068
1,082
10,175
976
991
LHIN
HNHB
ONTARIO a.
2011/12
Rates are age‐adjusted to control for differences in age composition of population over time. The lowest and highest rates are bolded.
In 2011/12, the age‐adjusted rate of emergency visits for hyper or hypoglycemia varied considerably by LHIN ranging from 654 per 100,000 persons with diabetes in the Central LHIN to 1,920 in the South East LHIN.
Since 2009/10, the crude and age‐adjusted rates have been decreasing (i.e. improving) in all LHINs (with the exception of Central West LHIN).
In all three reporting periods, South East LHIN had the highest crude and age‐adjusted rates.
Ontario Diabetes Strategy, Key Performance Measures (June 2013)
33
Prevalence
Risk Factors
Access
Management
Outcomes
12. Renal replacement therapy rates Description:
Age‐adjusted rate of renal replacement therapy (renal dialysis or kidney transplant) among diabetes patients (age 18+) per 100,000 population with diabetes.
Rationale:
Diabetes is the leading cause of kidney failure requiring dialysis or a transplant. Adequate diabetes management may help lower rates of end stage renal disease (ESRD) in this patient population (Oliver et al., 2003).
Data Source: Historical estimates: Ontario Diabetes Database (ODD), Institute for Clinical Evaluative Sciences (ICES). Baseline Diabetes Dataset Initiative (BDDI), MOHLTC; Discharge Abstract Database (DAD), Canadian Institute for Health Information (CIHI); and OHIP Claims History Database, MOHLTC. Note: Analysis is based on the number of patients who receive renal replacement therapy. Target:
Maintain at current level
Provincial results Table 12.1: Number and rate of renal replacement therapy (renal dialysis or kidney transplant) per 100,000 Ontarians with diabetes, 2002/03 to 2011/12 Rate per 100,000
ICES – historicalb
Diabetes patients, BDDI
a. b.
Time period
#
Crude
Age‐adjusteda
2002/03
5,288
762
762
2003/04
5,667
762
762
2004/05
6,129
766
767
2005/06
6,702
774
774
2006/07
7,337
782
779
2007/08
7,956
796
791
2008/09
8,066
940
934
2009/10
8,485
931
922
2010/11
8,499
867
858
2011/12
8,822
846
836
Rates are age‐adjusted to control for differences in age composition of population over time. Historical analyses (from ICES) are provided for context. Results based on BDDI should not be compared with results from ICES.
In 2011/12, 8,822 Ontarians (age 18+) with diabetes were receiving renal replacement therapy (i.e., renal dialysis or kidney transplant). This is more than 300 patients compared to in 2010/11 and 2009/10 and more than 750 in 2008/09. Since 2008/09, the renal replacement therapy rate has been decreasing.
Ontario Diabetes Strategy, Key Performance Measures (June 2013)
34
LHIN results Table 12.2: Number and rate of renal replacement therapy (renal dialysis or kidney transplant) per 100,000 Ontarians with diabetes (age 18+) by LHIN, 2009/10 to 2011/12
2010/11
2011/12
Rate per 100,000
Rate per 100,000
Rate per 100,000
Trend
#
Crude
Age‐ a adjusted
Erie St. Clair
383
797
791
437
853
842
472
869
850
South West
554
876
856
548
806
792
586
813
798
Waterloo Wellington
645
1,517
1,495
408
881
872
396
798
786
HNHB
940
968
938
984
948
916
972
887
857
Central West
545
867
927
539
786
837
602
814
855
Mississauga Halton
536
745
759
587
748
762
609
725
736
Toronto Central
720
960
954
730
911
905
739
872
865
Central
970
838
825
977
782
771
1,047
783
769
Central East
1,148
958
954
1,183
920
913
1,228
898
890
South East
313
870
858
329
851
836
350
849
827
Champlain
720
922
912
728
869
860
724
814
806
North Simcoe Muskoka
279
988
974
297
978
948
292
902
873
North East
489
969
964
498
925
920
534
941
931
North West
232
1,168
1,167
245
1,155
1,149
262
1,161
1,159
LHIN unknown
11
‐
‐
9
‐
‐
9
‐
‐
8,485
931
922
8,499
867
858
8,822
846
836
LHIN
ONTARIO a.
2009/10
#
Crude
Age‐ a adjusted
#
Crude
Age‐ a adjusted
Rates are age‐adjusted to control for differences in age composition of population over time. The lowest and highest rates are bolded.
In 2011/12, the renal replacement therapy rate varied considerably across LHINs. It was highest among diabetes patients in the North West LHIN (1,159 per 100,000) and lowest among diabetes patients in the Mississauga Halton LHIN (736 per 100,000).
In both 2010/11 and 2011/12, rates were highest among diabetes patients in the North West LHIN.
Since 2009/10, rates have been decreasing in all LHINs (with the exception of the Erie St. Clair LHIN).
Ontario Diabetes Strategy, Key Performance Measures (June 2013)
35
Prevalence
Risk Factors
Access
Management
Outcomes
13. Infection, ulcer, amputation rates Description:
Age‐adjusted rate of infections, ulcers, amputations among Ontarians with diabetes, age 18+.
Rationale:
Diabetes is a major risk factor for peripheral vascular disease and neuropathy. Approximately 50% of all amputations of the lower extremity are reported to be performed in patients with diabetes. Adequate diabetes management may help to lower rates of amputation in this patient population.
Data Source: Historical estimates: Ontario Diabetes Database (ODD), Institute for Clinical Evaluative Sciences (ICES). Current estimates: Baseline Diabetes Dataset Initiative (BDDI), MOHLTC; Discharge Abstract Database (DAD), Canadian Institute for Health Information (CIHI). Note: The numbers and rates below include common infections as well as soft tissue (i.e., foot) infections. Analysis is based on hospitalizations among prevalent diabetes cases. Target:
Reduce by 10%
Provincial results Table 13.1: Number and rate (per 100,000) of hospitalizations for common infectiona, skin/soft tissue infection or amputationsb among Ontarians with diabetes (age 18+), 2002/03 to 2011/12 Rate per 100,000
ICES – historicald
Diabetes patients, BDDI
Time period
#
Crude
Age‐adjustedc
2002/03
27,239
3,923
3,923
2003/04
26,758
3,592
3,598
2004/05
28,514
3,546
3,564
2005/06
30,136
3,445
3,481
2006/07
31,736
3,313
3,381
2007/08
27,239
3,212
3,309
2008/09
29,240
3,409
3,343
2009/10
30,588
3,355
3,268
2010/11
34,050
3,475
3,368
2011/12
36,750
3,525
3,390
a. b. c. d.
Infections such as pneumonia, sepsis, or urinary tract infections. Includes minor (toe, foot) and major (ankle, knee, below knee or above knee) amputations. Rates are age‐adjusted to control for differences in age composition of population over time. Historical analyses (from ICES) are provided for context. Results based on BDDI should not be compared with results from ICES.
In 2011/12, there were 36,750 hospitalizations for a common infection, skin/soft tissue infection or amputation among Ontarians with diabetes (age 18+). This is 2,700 more patients than in 2010/11, 6,100 more than in 2009/10, and 7,500 more than in 2008/09. In 2011/12, the age‐adjusted rate was 3,390 per 100,000 Ontarians with diabetes (age 18+). The rate has increased slightly since 2008/09.
•
Ontario Diabetes Strategy, Key Performance Measures (June 2013)
36
Table 13.2: Number and rate (per 100,000) of hospitalizations for common infectiona, skin/soft tissue infection or amputationc among Ontarians with diabetes (age 18+), 2008/09 to 2011/12
Skin/soft tissue infections
Common infections
Time period
#
Amputations
Rate per 100,000
Rate per 100,000 Age‐ adjusteda Crude
Age‐ adjusteda
Rate per 100,000 Age‐ adjusteda
#
Crude
#
Crude
2008/09
24,094
2,809
2,747
4,909
572
567
1,805
210
209
2009/10
25,279
2,773
2,690
5,223
573
567
1,631
179
178
2010/11
28,559
2,914
2,813
5,607
572
565
1,596
163
161
2011/12
30,798
2,954
2,827
6,086
584
575
1,697
163
160
a. b. c.
Infections such as pneumonia, sepsis, or urinary tract infections. Includes minor (toe, foot) and major (ankle, knee, below knee or above knee) amputations. Rates are age‐adjusted to control for differences in age composition of population over time.
In 2011/12, among adults with diabetes in Ontario, there were: 30,798 hospital separations for common infections; 6,086 hospital separations for ulcers (skin/soft tissue infections) and 1,697 hospital separations for amputations.
Both the number and rate of common and skin/soft tissue infection hospitalizations among adults with diabetes increased between 2008/9 and 2011/12.
Conversely, the number and rate of amputations have decreased between 2008/9 and 2011/12.
LHIN results Table 13.3: Number and rate (per 100,000) of hospitalizations for common infection, skin/soft tissue infection or amputation among Ontarians with diabetes, by LHIN, 2009/10 and 2010/11
2009/10
2010/11
Rate per 100,000
2011/12
Rate per 100,000
Rate per 100,000
Trend
#
Crude
Age‐ adjusteda
#
Crude
Age‐ adjusteda
#
Crude
Age‐ adjusteda
Erie St. Clair
1,755
3,654
3,469
1,973
3,850
3,631
2,108
3,881
3,644
South West
2,367
3,742
3,495
2,832
4,167
3,887
3,054
4,235
3,941
Waterloo Wellington
1,346
3,165
3,072
1,490
3,216
3,107
1,574
3,171
3,040
HNHB
3,933
4,051
3,778
4,326
4,166
3,884
4,532
4,137
3,798
Central West
1,588
2,527
3,008
1,851
2,699
3,167
1,989
2,690
3,096
Mississauga Halton
1,855
2,577
2,680
2,110
2,689
2,766
2,308
2,746
2,790
Toronto Central
2,635
3,512
3,238
2,901
3,621
3,344
3,064
3,614
3,310
Central
3,096
2,673
2,569
3,387
2,713
2,595
3,665
2,740
2,609
Central East
3,440
2,871
2,837
3,721
2,894
2,837
4,114
3,009
2,924
South East
1,272
3,534
3,349
1,453
3,756
3,560
1,578
3,827
3,609
Champlain
2,799
3,583
3,478
3,175
3,788
3,651
3,390
3,811
3,648
North Simcoe Muskoka
1,179
4,174
4,012
1,234
4,065
3,862
1,373
4,240
4,013
North East
2,057
4,074
4,033
2,296
4,265
4,179
2,562
4,514
4,359
North West
1,209
6,087
6,252
1,252
5,900
6,028
1,378
6,109
6,197
57
‐
‐
49
‐
‐
61
‐
‐
30,588
3,355
3,268
34,050
3,475
3,368
36,750
3,525
3,390
LHIN
LHIN unknown ONTARIO
Lowest and highest rates are bolded.
Ontario Diabetes Strategy, Key Performance Measures (June 2013)
37
In both the current (2011/12) and previous (2010/11 and 2009/10) fiscal years, the hospitalization rate for common infection, skin/soft tissue infection or amputations varied across LHINs. Rates for common infection, skin/soft tissue infection and amputations for all three reported periods were highest in the North West LHIN and more than double the rate in the Central LHIN, the LHIN with the lowest rate.
Since 2009/10, rates have been increasing in all LHINs (with the exception of the Waterloo Wellington and North West LHIN).
Table 13.4: Number and rate (per 100,000) of hospitalizations for common infection, skin/soft tissue infection or amputation among Ontarians with diabetes, by LHIN, 2011/12 Common infections
Skin/soft tissue infections
Rate per 100,000
Amputations
Rate per 100,000
Rate per 100,000
#
Crude
Age‐ adjusteda
#
Crude
Age‐ adjusteda
#
Crude
Age‐ adjusteda
Erie St. Clair
1,785
3,286
3,055
345
635
627
94
173
171
South West
2,509
3,479
3,197
561
778
761
157
218
213
Waterloo Wellington
1,333
2,686
2,563
259
522
512
80
161
157
HNHB
3,796
3,465
3,145
767
700
674
219
200
192
Central West
1,697
2,295
2,678
299
404
434
74
100
107
Mississauga Halton
2,016
2,398
2,442
297
353
356
75
89
89
Toronto Central
2,594
3,059
2,772
497
586
564
100
118
115
Central
3,162
2,364
2,239
534
399
391
117
87
87
Central East
3,454
2,527
2,447
656
480
473
227
166
164
South East
1,275
3,093
2,876
310
752
744
86
209
204
Champlain
2,891
3,250
3,101
521
586
571
143
161
156
North Simcoe Muskoka
1,113
3,437
3,225
256
791
777
72
222
218
North East
2,037
3,589
3,444
488
860
850
169
298
289
North West
1,085
4,810
4,895
284
1,259
1,261
83
368
376
51
‐
‐
12
‐
‐
7 Average A1C among registered patients should begin with these and gradually incorporate others % of pts with target blood pressure
3
LDL Cholesterol
% of pts with LDL 55%7
Albumin to Creatinine Ratio (ACR) and Serum creatinine frequency % of people with diabetes who have had an ACR and serum creatinine test in the past year
48%8
See note
‐
‐
47%2
80%, with 10% annual improvement4 or 20% increase over 3 years5.
Indicator
ACR control % of people with diabetes with ACR