Journal of Theoretical and Applied Electronic Commerce Research ISSN 0718–1876 Electronic Version VOL 2 / ISSUE 2 / AUGUST 2007 / 48 - 60 © 2007 Universidad de Talca - Chile
This paper is Available online at www.jtaer.com
Key Drivers of Mobile Commerce Adoption. An Exploratory Study of Spanish Mobile Users Enrique Bigné1, Carla Ruiz2 and Silvia Sanz3 1
University of Valencia, Department of Marketing,
[email protected] 2 University of Valencia, Department of Marketing,
[email protected] 3 University of Valencia, Department of Marketing,
[email protected]
Received 15 January 2007; received in revised form 15 May 2007; accepted 25 May 2007
Abstract Despite dramatic differences between non-store shoppers were discovered, very limited research has been conducted to examine them. This paper analyses the background of M-commerce and key drivers of future Mcommerce decision among Spanish mobile users. Our objective is two-fold: (1) to determine the influence of relations with the Mobile (frequency of Mobile use, length of Mobile use and Mobile affinity), demographics, non-store shopping previous experience (mail, catalogue, Television and Internet) and attitude to M-commerce and its influence on the M-commerce decision and (2) to identify key drivers of future M-commerce intention. We examined data from 606 personal interviews given to Spanish mobile users (270 Mobile shoppers and 336 non Mobile-shoppers) over 14 years old. Data analysis shows that age, attitude towards M-commerce, Internet shopping previous experience and relations with the Mobile (frequency, length of Mobile use and Mobile affinity) are the main predictors of M-commerce decision while age, length of Mobile use, Mobile affinity, consumer attitude towards M-commerce and previous M-commerce experience are the most relevant factors influencing future M-commerce intention. Based on these empirical results this research enables companies to know the key drivers influencing M-commerce adoption and, therefore, what aspects to highlight in their marketing strategies.
Key words: M-commerce, Consumer behaviour, Distance shopping, Affinity, Mobile users.
48
KEY DRIVERS OF MOBILE COMMERCE ADOPTION. AN Enrique Bigné Carla Ruiz EXPLORATORY STUDY OF SPANISH MOBILE USERS Silvia Sanz
Key Drivers of Mobile Commerce Adoption. An Exploratory Study of Spanish Mobile Users
Journal of Theoretical and Applied Electronic Commerce Research ISSN 0718–1876 Electronic Version VOL 2 / ISSUE 2 / AUGUST 2007 / 48 - 60 © 2007 Universidad de Talca - Chile
This paper is Available online at www.jtaer.com
1 Introduction Information and Computer Technologies (ICTs) are currently experiencing spectacular growth and gradually entering our homes. People are becoming increasingly familiar with the use of Internet and also the new mobile terminals such as electronic diaries and mobile phones. Mobile telephony is growing fast, in combination with the development of wireless technology [31]. According to Wireless Week (2004) there were 94.9 million M-Commerce users worldwide in 2003 and the segment is expected to grow to 1.67 billion by 2008. Global income from M-Commerce was $6.86 billion in 2003 and is expected to reach $554.37 billion in 2008 [70]. At present, the Spanish mobile market has a penetration rate of 91.63% with 39.4 million mobile subscribers [48]. Spain has three mobile operators (see Table 1). With more than 18 million subscribers and a 48% market share, Telefónica MoviStar dominates the Spanish market. Around 60% of Spanish end-users are prepaid users, but the trend is downward as the result of improved contract conditions to gain user loyalty [66]. Table 1: Spanish mobile telecom operators Source: [47], [48]
Main shareholders End-user market share in millions 2001 2002 2003 2004 2005 Average Monthly Revenue per User (ARPU)/ (euros) 2004 2005
Mobile operators Vodafone (www.vodafone.es)
Amena (www.amena.es)
Grupo Vodafone
France Telecom
15.71 (55.8%) 18.10 (56.1%) 18.87 (53.5%) 18.70 (49.1%) 18.91 (48%)
7.55 (29%) 8.15 (25.3%) 9.18 (26%) 10.40 (27.4%) 12.21 (31%)
4.87 (17.3%) 6.00 (18.6%) 7.22 (20.4%) 8.90 (23.5%) 8.27 (21%)
32.4 34.2
35.4 36.0
28 29
Telefónica Móviles (www.movistar.com) La Caixa BBVA
Non-store retailing is a form of retailing in which consumer contact occurs outside the confines of the retail store, such as vending machines and electronic shopping, at home personal selling, and catalogue buying [1]. The domain of activities where direct channels use and consumer purchase behaviour overlap can be called Non-store consumer purchase behaviour. [67] defines M-commerce as the buying and selling of goods and services using wireless handheld devices such as mobile telephones or personal data assistants (PDAs). M-commerce may be thus regarded as an extension of Electronic commerce to wireless mediums [9]. This paper accordingly defines M-shopper as “the consumer who buys goods and services by using mobile access to computer-mediated networks with the help of an electronic device”. Non-store shoppers are not a homogeneous group [12], [23], [24], [32]. Although dramatic differences were discovered between non-store shoppers, there are still not enough studies that examine the demographic, behavioural and attitudinal differences among M-shoppers. While published work on M-commerce applications and technologies and the different mobile operators and their services is becoming more abundant and representative [4], [8], [9], [18], [22], [25], [36], [39], [40], there is a lack of literature on the profile of users who buy products/services through the different mobile operators and on the analysis of the factors which most influence M-shopping behaviour and the processes of adopting M-commerce [9], [43], [49], [72], [73]. This work aims to present an in-depth study of M-commerce adoption, analysing the variables which influence the Mcommerce decision. Our objective is two-fold: (1) to determine the influence of relations with the Mobile (frequency of Mobile use, length of Mobile use and Mobile affinity), demographics, non-store shopping previous experience (mail, catalogue, Television and Internet) and the attitude to M-commerce and its influence on the M-commerce decision and (2) to identify key drivers of future M-commerce intention. The study is divided in two parts. The first part includes the literature review and development of the working hypotheses. The second part includes the methodology used in the empirical study of a sample of 606 Spanish Mobile users and the data analysis. 49
KEY DRIVERS OF MOBILE COMMERCE ADOPTION. AN Enrique Bigné Carla Ruiz EXPLORATORY STUDY OF SPANISH MOBILE USERS Silvia Sanz
Key Drivers of Mobile Commerce Adoption. An Exploratory Study of Spanish Mobile Users
Journal of Theoretical and Applied Electronic Commerce Research ISSN 0718–1876 Electronic Version VOL 2 / ISSUE 2 / AUGUST 2007 / 48 - 60 © 2007 Universidad de Talca - Chile
This paper is Available online at www.jtaer.com
2 Literature Review 2.1
Mobile relationships
Several authors maintain that consumers with most exposure to new technologies are those who are more willing to adopt direct channels [5], [17], [42], [45], [61]. Distance shoppers modify their behaviour and responses to marketing actions as their experience of the new environments increases [11]. For example, expert Internet shoppers surf more rapidly, their sessions are shorter, they visit a very small number of particular websites and enjoy their surfing experience more than novice users [10], [50]. If we focus on teleshopping, it has been shown that teleshoppers watch significantly more television than non teleshoppers [19], [21] and have greater teleshopping genre exposure [28], [62]. Bearing in mind the results in the literature, we test a similar effect with the following hypotheses: H.1a) Frequency of Mobile use has a positive influence on M-commerce adoption. H.1b) Frequency of Mobile use has a positive influence on future M-commerce intention. H.2a) Length of Mobile use has a positive influence on M-commerce adoption. H.2b) Length of Mobile use has a positive influence on future M-commerce intention. A variable which captures the importance of the medium for the individual is affinity. There is evidence that the closer an individual’s relationship with a medium, the greater the probability of purchase based on the content observed [3], [16]. Previous studies have found a positive, significant association between affinity and levels of televiewing [53]. It has also been found that this variable is one of the most significant predictors for certain medium relations such as dependency or parasocial interaction [53], [58]. [58] found that there is a positive correlation between Internet affinity and Internet dependency and that Internet purchase intention can be the result of particularly intense Internet dependency relations [58]. This leads us to suggest that Mobile affinity can also help to intensify Mobile shopping. To complement findings of the literature review, we addressed the following hypothesis on the Mobile affinity/Mcommerce relation. H.3a) Mobile affinity has a favourable influence on M-commerce adoption. H.3b) Mobile affinity has a favourable influence on M-commerce intention.
2.2
Demographics
Previous research shows demographic differences among consumers using the different non-store shopping channels [7], [12], [23], [24], [32], [41], [44]. [24] compared catalogue and in-store shopper profiles and found significant differences in terms of age, education and income, while other authors such as [33] found differences in age, gender and income. If we focus on teleshopping, previous research describes the American teleshopper as a woman (normally married), middle-aged, over 35 (in the 45-50 age range) in the medium and medium-high income bracket [54], [57], [63], [65], [69], [74]. In contrast, the British shopper has been described as a younger woman with children, between 18-45 years old (the average age is around 30) [52], [54]. One of the most successful systems of direct sales is Internet. Studies focused on countries with low Internet adoption rates (such as Greece or Singapore) report that the E-shopper profile is significantly different from that of the non-shopper and is mainly a young male, with a high level of education and income [61], [68]; in countries with high Internet adoption rates (such as the United States) online shopping has increased among people with different educational and economic levels, assimilating both profiles [23], [60]. Finally, the Mobile shopper in several European countries has been described as much younger than the non Mshopper [6], [48]. The influence of demographics on M-commerce adoption has not been sufficiently studied in the literature and so, in view of the above, we propose the following hypotheses: H.4a) The individual’s demographic profile has a significant influence on M-commerce adoption. H.4b) The individual’s demographic profile has a significant influence on future M-commerce intention.
50
KEY DRIVERS OF MOBILE COMMERCE ADOPTION. AN Enrique Bigné Carla Ruiz EXPLORATORY STUDY OF SPANISH MOBILE USERS Silvia Sanz
Key Drivers of Mobile Commerce Adoption. An Exploratory Study of Spanish Mobile Users
Journal of Theoretical and Applied Electronic Commerce Research ISSN 0718–1876 Electronic Version VOL 2 / ISSUE 2 / AUGUST 2007 / 48 - 60 © 2007 Universidad de Talca - Chile
2.3
This paper is Available online at www.jtaer.com
Non-store shopping experience
[55] argues that “the adoption of one new idea may trigger the adoption of several others in a cluster which consists of one or more distinguishable elements of technology that are perceived as being interrelated”. The technology cluster concept has been used to examine the adoption of videotext [37], E-Commerce [20] and M-Commerce [73]. This concept posits that consumers are likely to adopt a technology offering the same functions as those already adopted. M-Commerce offers features, such as time saving, convenience, enjoyment and lower prices, which are similar to those offered by other non-store shopping channels. Finally, it should be highlighted that some prior experience with non-store shopping channels has a positive influence on the adoption of new direct shopping channels, since the consumer acquires skill in purchasing products with no prior physical inspection [17], [35], [59]. In view of the above, it is to be expected that consumers with non-store shopping experience (either through the mobile or other media) purchase more through Mobile and have a stronger future M-commerce intention than those who have never used non-store shopping channels. Therefore, we propose the following hypotheses: H.5a) Non-store shopping experience has a favourable influence on M-commerce adoption. H.5b) Non-store shopping experience has a favourable influence on future M-commerce intention. H.6) M-commerce experience has a favourable influence on future M-commerce intention.
2.4
Attitude towards M-commerce
The TAM model [13], [14], [15] posits that intention to use a technology is determined by the individual’s attitude towards the use of that technology. The model was developed by [13] to predict individual intention to use information technologies and has been used to predict future shopping intention towards non-store shopping channels such as Internet [51] or mobile [73]. [21] shows that the main predictor of the teleshopping decision is the relative advantage of non-store shopping over traditional channels and the compatibility of this advantage with consumer lifestyles. Studies focused on other non-store shopping channels such as Internet also show that positive or negative attitudes to distance shopping influence non-store shopping adoption [21], [26], [27],[51]. To complement the contributions of the above studies, we propose the following hypotheses: H.7a) A positive attitude to M-commerce has a favourable influence on M-commerce. H.7b) A positive attitude to M-commerce has a favourable influence on future M-commerce intention.
Mobile use (Frequency of Mobile use) Mobile use experience (Length of Mobile use)
H1b H2b
H1a H2a H3b
FUT URE MCOMMERCE INT ENT ION
Affinity H3a H5 H4b
Demographics (gender, age, education, income)
H4a
FREQUENCY M-COMMERCE
H6b Non-store shopping experience (Internet, T V, catalogue, mail)
H6a H7b H7a
Attitude towards Mobile Commerce
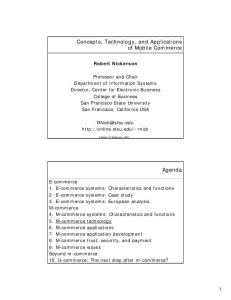
Figure 1: M-Commerce adoption model 51
KEY DRIVERS OF MOBILE COMMERCE ADOPTION. AN Enrique Bigné Carla Ruiz EXPLORATORY STUDY OF SPANISH MOBILE USERS Silvia Sanz
Key Drivers of Mobile Commerce Adoption. An Exploratory Study of Spanish Mobile Users
Journal of Theoretical and Applied Electronic Commerce Research ISSN 0718–1876 Electronic Version VOL 2 / ISSUE 2 / AUGUST 2007 / 48 - 60 © 2007 Universidad de Talca - Chile
This paper is Available online at www.jtaer.com
The model above (see Figure 1) shows the influence of Mobile relationships (Mobile Affinity, frequency of mobile use and length of mobile use), demographics (age, gender, education and income), non-store shopping experience and attitude towards M-commerce in the present and future M-commerce decision.
3 Methodology The data for analysis come from a study done in Spain from April to June 2006 on a sample of 606 mobile users over the age of 14. The sample included both M-shoppers and non M-shoppers. As in previous studies [29], [38] the sample was chosen using the convenience sampling method, with a greater proportion of young people (74.1% were between 14-24 years old). Young adults were selected because consumers under 30 have been found to be faster adopters of mobile services in general [38], [48]. Table 2: Profile of respondents
Man Woman From 14 to 24 years old From 25 to 34 years old From 35 to 49 years old From 50 to 64 years old 65 or older No formal education Primary Secondary University I have no salary Well below average Below average Average Above average Well above average
M-shoppers Non M-shoppers (n=270 (n=336) GENDER 47% 56.7% 53% 43.3% AGE 74.1% 48.4% 15.6% 17.9% 8.1% 19.1% 2.2% 14% 0% 0.6% EDUCATION 2.1% 2.7% 31.9% 28.4% 43% 36.7% 23% 32.2% INCOME 56.6% 36.4% 4.5% 6% 9% 9.3% 9% 13.5% 17.2% 24.9% 3.7% 9.9%
Total (n=606) 54% 46% 55.6% 17.4% 15.9% 10.6% 0.5% 2.6% 29.3% 38.6% 29.5% 42.2% 5.5% 9.2% 12.2% 22.8% 8.1%
Table 3: Mobile use behaviour Non Mshoppers (n=336) FREQUENCY OF MOBILE USE More than 10 times a day 23.7% 14% Between 5 & 10 times a day 29.6% 22.7% Between 3 & 4 times a day 24.4% 23.9% Between 1 & 2 times a day 10.4% 22.1% Several times a week 10.4% 12.8% Once a week 1.5% 1.2% Twice a month 2.1% Once a month 0.3% Less frequently 0.9% LENGTH OF MOBILE USE Less than 1 year 1.6% 3.4% Between 1 and 2 years 11.1% 10.1% Between 2 and 3 years 28.1% 12.8% Between 3 and 5 years 25.9% 36.4% Between 5 and 8 years 28.1% 31% over 8 years 5.2% 6.3% M-shoppers (n=270)
Total (n=606) 16.8% 24.6% 24% 18.7% 12.2% 1.3% 1.6% 0.2% 0.6% 2.8% 10.4% 17.2% 33.4% 30.2% 6%
52
KEY DRIVERS OF MOBILE COMMERCE ADOPTION. AN Enrique Bigné Carla Ruiz EXPLORATORY STUDY OF SPANISH MOBILE USERS Silvia Sanz
Key Drivers of Mobile Commerce Adoption. An Exploratory Study of Spanish Mobile Users
Journal of Theoretical and Applied Electronic Commerce Research ISSN 0718–1876 Electronic Version VOL 2 / ISSUE 2 / AUGUST 2007 / 48 - 60 © 2007 Universidad de Talca - Chile
This paper is Available online at www.jtaer.com
Mobile use behaviour was measured by the frequency of mobile use and length of time as mobile user. Mobile use experience was measured following the same criteria used in other research work [6]. It can be seen on table 3 that levels of mobile use are greater in M-shoppers with the data showing that over half of them (53.3%) use the mobile quite frequently (more than 5 times a day). These percentages are no as high in the case of non M-shoppers, with 22.1% stating that they use the mobile only 1-2 times a day and 17.3% even less frequently. The data on length of time as mobile users show that non M-shoppers have used mobiles for the longest, perhaps because they are older and therefore were able to buy one when mobiles were still a luxury item or were only used for professional purposes. Table 4: Distance shopping experience Non-store shopping experience
Mail Catalogue Television Internet
22.9% 44.3% 15.3% 48.9%
17.1% 32.1% 10.7% 29.7%
18.8% 35.6% 12% 35.2%
Consumers’ non-store shopping experience was measured by asking if they had used other direct shopping systems (mail, catalogue, television and Internet) as shown on table 4. M-shoppers are more experienced non store shoppers than non M-shoppers with Internet being the most popular of all the direct shopping channels (48.9%). Table 5: Mobile Affinity and Attitude towards M- Commerce MOBILE AFFINITY Using the Mobile is one of my main daily activities If the Mobile is down I really miss it The Mobile is important in my life I can’t go for several days without using the Mobile I would be lost without the Mobile ATTITUDE TO M-SHOPPING Mobile shopping is appealing Mobile shopping is convenient Mobile shopping is involving Mobile shopping is fascinating Mobile shopping is interesting Mobile shopping is valuable Mobile shopping is exciting Mobile shopping is secure Mobile shopping is needed Mobile shopping is a good idea Mobile shopping is useful
M-shoppers (n=270) 3.38 3.50 3.41 2.87 3.08
Total (n=606) 2.72 3.03 3.04 2.96 2.66
M-shoppers (n=270
Non M-shoppers (n=336) 2.46 2.84 2.90 3.00 2.49 Non M-shoppers (n=336)
2.88 3.56 2.70 3.17 3.29 2.89 2.87 2.56 2.05 3.32 3.17
2.22 2.83 2.58 2.34 2.47 2.35 2.32 2.16 1.83 2.62 2.53
2.41 3.04 2.61 2.58 2.70 2.51 2.48 2.27 1.89 2.82 2.71
Total (n=606)
A 5 item scale from previous studies was used to measure Mobile Affinity [53] as shown in Table 5. Evaluation for each item ranged from 1 “totally disagree” to 5 “totally agree”. Attitude to M-commerce was measured by using an adaptation of Zaichkowsky’s Personal Involvement Inventory Scale [75]. We used a five point Likert scale. Table 5 shows that M-shoppers consider the mobile more important and more necessary than non M-shoppers. Moreover, M-shoppers show a more positive attitude to purchasing through the system than Non M-Shoppers. Table 6: M-commerce adoption and future M-commerce intention FREQUENCY OF M-COMMERCE
FUTURE M-COMMERCE INTENTION
M-Shopper Not purchase Once 2-4 times 5-7 times 8-10 times
55.45% 28.10% 12.25% 2.10% 2.10%
M-Shopper M-Non shopper No, definitely not Probably not Indifferent Probably yes Yes, definitely
7.4% 8.9% 24.4% 40% 19.3%
45.9% 35.5% 12.3% 5.4% 0.9%
M-commerce behaviour was determined by asking interviewees about the purchase frequency of products/services they have already purchased through the mobile and future M-commerce intention by the response to the question 53
KEY DRIVERS OF MOBILE COMMERCE ADOPTION. AN Enrique Bigné Carla Ruiz EXPLORATORY STUDY OF SPANISH MOBILE USERS Silvia Sanz
Key Drivers of Mobile Commerce Adoption. An Exploratory Study of Spanish Mobile Users
Journal of Theoretical and Applied Electronic Commerce Research ISSN 0718–1876 Electronic Version VOL 2 / ISSUE 2 / AUGUST 2007 / 48 - 60 © 2007 Universidad de Talca - Chile
This paper is Available online at www.jtaer.com
“Would you buy through the Mobile over the next few years?” on a 5 point Likert scale where 1: “No definitely not”, 2: “Probably not”, 3: “Indifferent”, 4: “Probably yes” and 5: “Yes definitely”. Despite the fact that 55.45% of those interviewed had not yet purchased any product and/or service through the mobile, 44.55% had done so in the last year, with M-shoppers being most willing to continue to purchase in the future (59.3%). Table 7: Spanish Mobile services M-shoppers (n=270)
MOBILE SERVICES Logos Monophonic and Polyphonic Ring Tones Songs Videos Tickets for shows Mobile Top-up Vending goods Information services Vote services (SMS) SMS for prize draws
58.4% 77.9% 58.1% 19.9% 4.4% 41.9% 3% 14% 33.1% 30.9%
Non Mshoppers (n=336) 23.3% 37.2% 31.4% 18.6% 30.2% 34.9% 9.2% 11.6% 9.3% 9.3%
Table 7 shows that Monophonic and Polyphonic Ring Tones (77.9%), logos (58.4%) and songs (58.1%) are the most purchased products. The mobile is also used to top up credit (41.9%) and send SMS to vote (33.1%) or take part in prize draws (30.9%). Interviewees who have still not made an M-purchase would be willing to purchase ring tones and songs (37.2% and 31.4% respectively), and to top up credit (34.9%) and purchase games (30.2%). These are low cost products which considerably reduces the perceived purchase risk.
4 Data Analysis 4.1
Validation of the measurement scales
The measurement scales used in this study (Mobile Affinity and Attitude to M-Commerce) were verified to ensure that they comply with the psychometric properties established in the literature. Mobile Affinity and Attitude to M-Commerce were measured as in previous studies using a unidimensional scale with five and eleven items respectively. The results obtained in the scale reliability analysis using Cronbach’s alpha show satisfactory values, exceeding the minimum threshold of 0.7 points in all cases (Mobile affinity=0.829; Attitude to MCommerce=0.929). Before analysing convergent and discriminant validity, the dimensionality of the measurement instruments was analysed using principal components exploratory factor analysis with Varimax rotation. Items for the variables Mobile affinity and Attitude to M-Commerce show appropriate unidimensional results, because only one factor is extracted from each of the proposed scales with significant explained variance in all cases (over 60%) (Mobile affinity=65.59; Attitude to M-commerce =69.36) and factor loads above the recommended minimum of 0.5. Confirmatory analysis was used to evaluate convergent and discriminant scale validity, with statistical software EQS version 6.1 and Maximum Likelihood Estimation. Given that, model fit was not initially acceptable; the composition of some of the scales used was changed. AFIN4 and AFIN5 were eliminated from the Mobile Affinity scale and items ACT2, ACT3, ACT9 and ACT11 from the Attitude to M-Commerce scale. After eliminating these items, all the factor regression coefficients were significant (t>2.56), standardised loads were above 0.5 and a good model fit was obtained (Likelihood ratio Chi Square= 112.196, df= 34, p3.291; p