KALMAR POOLED INVESTMENT TRUST
Kalmar “Growth-with-Value” Small Cap Fund Investor Class Shares Institutional Class Shares Advisor Class Shares Semi Annual Report June 30, 2016 (Unaudited) This report has been prepared for the general information of Kalmar Pooled Investment Trust shareholders. It is not authorized for distribution to prospective investors unless accompanied or preceded by a current prospectus. Investors are reminded to read the prospectus carefully before investing or sending money.
KALMAR POOLED INVESTMENT TRUST
Report from Management June 30, 2016 (Unaudited)
“GROWTH-WITH-VALUE” SMALL CAP FUND
July 15, 2016 Dear Fellow Shareholders and Friends: In this semi-annual report on the Kalmar “Growth-with-Value” Small Cap Fund, we briefly summarize the First Quarter and what led up to it, provide performance commentary for the overall 6-months through June and then separately for the just completed Second Quarter, and finish with a discussion of the Fund’s Portfolio Positioning and Kalmar’s Economic and Market Outlook. Kalmar “Growth-with-Value” Small Cap Fund Total Returns (%) — As of 6/30/16
(KGSCX)1
Investor Class Advisor Class (KGSAX)2 Institutional Class (KGSIX)3 Russell 2000® Growth Index Russell 2000® Index
MTD
QTD
YTD
1-Year
3-Year
5-Year
10-Year
Since Inception 4/11/97
-0.79 -0.72 -0.79 -0.46 -0.06
4.29 4.35 4.34 3.24 3.79
3.36 3.49 3.55 -1.59 2.22
-8.62 -8.50 -8.43 -10.75 -6.73
3.09 3.18 3.26 7.74 7.09
5.64 5.70 5.75 8.51 8.35
6.23 6.26 6.29 7.14 6.20
8.02 8.03 8.05 6.45 7.88
Note: Returns shown longer than 1-year are annualized. The performance data quoted represents past performance. Past performance does not guarantee future results. Investment return and principal values will fluctuate, and upon redemption shares may be worth more or less than original cost. The Fund’s current performance may be lower or higher than the performance data quoted. Contact the investment adviser at 800-463-6670 to obtain performance current to the most recent month-end. The table does not reflect the deduction of taxes that a shareholder would pay on fund distributions or the redemption of fund shares. The Fund’s annual gross operating expense, as stated in the current prospectus, is 1.36% for the Investor Class, 1.28% for the Advisor class, and 1.18% for the Institutional class. The total expense ratio printed in the prospectus may differ from the current ratio. The Fund imposes a 2.0% redemption fee on shares redeemed within 30 days of purchase. Small company stocks are generally riskier than large company stocks due to greater volatility and less liquidity. You cannot invest directly in an index. 1Investor class performance prior to May 1, 2013 reflects certain sub-accounting and shareholder services fees similar to the formal Shareholder Services Fees plan initiated on that date and deducted from the Fund’s assets at the annualized rate of 0.25%. 2Advisor Class federal registration was effective beginning April 22, 2013 but the class did not begin operations until July 18, 2013. Advisor Class performance prior to July 19, 2013 is the performance of the Investor Class. 3Institutional Class federal registration was effective beginning April 22, 2013 but the class did not begin operations until May 14, 2013. Institutional Class performance prior to May 15, 2013 is the performance of the Investor Class.
First Quarter Re-Cap U.S. and world-wide equity markets took investors on a tumultuous ride in the First Quarter. The first six weeks of the year delivered the worst start to a New Year ever, triggered by rising world recession fear extending to the U.S. Then remarkably, the U.S. market (and most others also) made a massive reversal motivated by gradually improving economic macros and reassuring signals from the Federal Reserve. It was a tale of two halves, scary “Risk-Off” 1
KALMAR POOLED INVESTMENT TRUST
Report from Management — continued
“GROWTH-WITH-VALUE” SMALL CAP FUND
retrenchment reversing quickly to surprising renewed low quality “Risk-On” behavior. During the First Quarter across all cap size segments Value outperformed Growth. Last summer we forecast and then later described the beginning of a transition in Small Cap leadership away from increasingly low quality, ever narrower, and highly momentum driven stocks. While we forecast then that such a transition wouldn’t happen in a straight line, it sure hasn’t, to say the least. Low quality drivers definitely still are at work, but somewhat less consistently and with less pervasiveness – as seen both in the First Quarter and First Half. In effect, this change has provided more of a “level playing field” for Kalmar’s quality-focused “Growth-withValue” strategy in which to perform, but one that has an uphill slope still with headwinds, but at a lower grade and not gale-force as earlier. Nevertheless, this has helped Kalmar, in two respects: First, to move beyond the 19 perversely difficult months for our investment style which climaxed in July last year and, thus, once again deliver – as in the First Quarter – on our goal of “All Weather” results, both protecting better on the downside and generating competitive up-capture when the market is fruitful. And second, very importantly combined with fine business delivery from our portfolio companies in the weak economy, to outperform in the Second Quarter as well when the stylistic headwinds were stiffer. Please recollect that our outperformance trend started last August after the unsustainable and exaggerated low quality phenomenon finally peaked. Six Months Year-to-Date through June The Fund’s superior return for the 6 months year-to-date versus our benchmark, the Russell 2000 Growth Index, benefited from both our sector weighting allocations and the performance of our individual holdings themselves, with the biggest impact from the latter. As to the sector allocations, please recall that these are the by-product of where we find the most appealing reward-to-risk opportunities in individual companies’ stocks, though we also sensibly self-limit any single sector exposure to manage risk. The biggest sectoral contribution came from our purposeful beginning-year large underweight in the Health Care sector. This was solely the result of the significant portion of the sector represented by small Biotechs and development-stage Pharmaceutical companies. Recollect that these do not meet our criteria for business quality, actual revenues & earnings, sensible stock valuations, and positive cash flow, in addition to having high unpredictable binary risk. These nascent companies were on a momentum binge from 2013 to its climax in the summer months of 2015. Since then they experienced giant losses and dragged down the performance of the Health Care sector. Our strategic underweight there saved the Fund’s portfolio substantial pain. As mentioned and as one would expect from a “bottom-up” manager like Kalmar, the performance contribution from the particular companies’ stocks we own had a far larger impact on relative returns than our sector weighting differences, even including Health Care. The Health Care and Energy sectors in the index were the weakest performing sectors overall through June with both down about 14%. Yet Kalmar’s specific holdings in these sectors were up 11% and 16%, respectively, leading these two sectors in the Fund to contribute substantially the most in terms of the company holdings’ effect. The strong relative contributions from both sectors were broadly based 2
KALMAR POOLED INVESTMENT TRUST
Report from Management — continued
“GROWTH-WITH-VALUE” SMALL CAP FUND
within their holdings and largely resulted from focusing on better quality businesses with strong competitive positions able to produce powerful progress. Gains from our holdings in the Technology, Materials & Processing, and Utilities sectors contributed even further. Our holdings in the remaining sectors detracted relatively. A few reasons for this would include: Because Real Estate Investment Trusts (REITs) within the Financial Services sector were especially strong, driven by sharply declining interest rates, while the Fund has no REIT exposure since they are primarily income vehicles rather than growth companies. Because the Fund had somewhat greater exposure to specialty retailers within the Consumer Discretionary sector; consumer spending became more halting at the same time; spending preferences changed; and, Amazon in particular gained share of overall retail spend. And because of the greater proportion of international revenues and earnings among our Producer Durables holdings, which detracted during a time when investor psychology temporarily favored domestic companies, especially post the Brexit vote. In contrast, Kalmar in general likes greater international exposure, believing that companies with global reach ultimately should be able to access longer runways of future growth. Second Quarter Commentary and Attribution As mentioned above, the volatile First Quarter ended with a return to low quality “Risk-On” investor behavior. After a slight pause the market again heated up in mid-April, yet again characterized by low quality non-earners, and then ricocheted sharply between Risk-Off and Risk-On until late June. At which time, June 24th kicked off a dramatic two-day slide on the shocking Brexit vote, only to be followed by a powerful snap-back in the final three days of the month. These Second Quarter market gyrations ultimately produced returns across the various broad indexes of between 2-4%, an attractive return if annualized. The Smaller Stock indexes performed at the higher end of this tight range while Larger Stock indexes finished at the lower end, with Value outperforming Growth across all size segments. In June itself Value continued to lead, but all the Larger Cap indexes beat the Smaller Caps which declined more in the Brexit aftermath. For the Second Quarter itself within the Russell 2000 Growth, the non-earners were up the most at 10.5% compared to the benchmark’s 3.2% return. Similarly, low quality companies with the lowest Return on Equity and highest debt-to-capital also outperformed notably. However by economic sector, lower growth, defensive areas such as Consumer Staples, Utilities, and REITs were also the performance leaders in a subject matter sense, primarily on Brexit uncertainty and the sharply declining interest rates. This unusual barbell of performance drivers weighed against both the Kalmar Fund’s high quality and growth orientation. However, somewhat greater market breadth in that Quarter gave the Fund more of a “level playing field” against which to perform than during the “stealth bear market” of 2015, when the market was also advancing but on concentrated, ultra-narrow, momentumized leadership. More importantly, the preponderance of the Fund’s holdings benefited from strong progress reports during “earnings season”, and combined with Kalmar’s steady-at-the-helm approach to guiding portfolios through volatile periods, enabled the Fund to outperform for the Second Quarter. This capped the Fund’s winning results for the sixmonths year-to-date. And also continued a happy return to the better performance shareholders have historically
3
KALMAR POOLED INVESTMENT TRUST
Report from Management — continued
“GROWTH-WITH-VALUE” SMALL CAP FUND
experienced, in contrast to the 19-month period discussed earlier when Small Cap market leadership was so antithetical to Kalmar’s quality-focused “Growth-with-Value” investment style. The Fund’s Second Quarter relative outperformance came exclusively from the better results of our particular holdings and, unlike the First Quarter, was little affected by our sector weightings. Our holdings outperformed in four sectors, underperformed in three, and essentially tied in two. The contribution from the outperforming sector holdings was more powerful than the ones from underperforming sectors. In order, the largest contributions came from our Health Care stocks, followed by those from Utilities (one holding only), Energy, and Technology. In Health Care, only two of eighteen holdings were down for the Second Quarter – by small amounts each – while nine were up 10% or more. For the three months our holdings in Consumer Discretionary, Financial Services, and Materials & Processing detracted relatively, while Consumer Staples and Producer Durables holdings effectively tied. The reasons behind the detractors were among the same as described above for the six-month period. Recent Portfolio Activity1 During the Second Quarter the Fund purchased 4 new holdings and sold 7 completely. “Peel the Onion” trim and “Beef Up” decisions were active in our effort to optimize future portfolio reward-to-risk. Examples of recent new purchases include: •
Amphastar Pharmaceuticals, Inc2 (AMPH) Market Cap† $730 Million: This specialty pharmaceutical company is focused on developing, manufacturing, and marketing technically challenging generic injectable, inhalation and intranasal products. The company currently has a portfolio of 17 approved products and a robust pipeline of additional ones that we believe are better protected from normal generic competition due to their very complex nature and the vertical integration of AMPH’s manufacturing capabilities including active pharmaceutical ingredients. The management team has deep scientific expertise with a successful track record in executing this business strategy.
•
Omnicell, Inc3 (OMCL) Market Cap† $1.0 Billion: Omnicell is the second largest provider of medication management systems – both hardware and software – for hospitals, clinics, and doctors’ offices. The Company is gaining share, entering new markets, growing its level of recurring revenues, and adding to its business value through accretive acquisitions, all while serving a pressing
† Market cap values shown are at the time of purchase during the quarter. 1 The information provided in this commentary is not sufficient upon which to base an investment decision and should not be considered a recommendation to purchase or sell a particular security. There is no guarantee that the Fund will continue to hold any one particular security or stay invested in any one particular sector or that any stock mentioned will be successful. This commentary is not representative of all securities purchased or sold for the Fund. Holdings are subject to change. Kalmar Investments will provide a comprehensive list of security purchases and sales for the past 12 months upon request. 2 Amphastar Pharmaceuticals, Inc (0.5% of the Fund assets as of 6/30/16) 3 Omnicell, Inc (0.8% of Fund assets as of 6/30/16)
4
KALMAR POOLED INVESTMENT TRUST
Report from Management — continued
“GROWTH-WITH-VALUE” SMALL CAP FUND
need among health care providers to reduce medication errors and improve patient outcomes with accurate dosing and adherence to medication protocols. •
Infinera Corp4 (INFN) Market Cap† $1.7 Billion: Infinera is a leading supplier of optical networking and transport equipment for telecommunications, Internet, cable, and wholesale carriers as well as enterprises, research, education, and government entities. Their proprietary photonic integrated circuit architecture provides better performance, lower cost, and lower power demands in a technology their competitors have so far been unable to duplicate. The secular growth in data volumes, entry into new end markets, and the recent acquisition of Transmode are expected to support attractive forward growth.
Portfolio Positioning Kalmar invests with a forward horizon of one to several years, seeking strong returns with low risk over longer time frames. We don’t attempt to trade short term themes and sector shifts. Our research is intensely bottom-up focused on developing proprietary conviction in a quality business’ longer term ability to deliver above-expectation competitive gains, revenue growth, margin expansion, earnings progress, and cash generation. Accordingly, our sector weights evolve slowly and organically over market cycles. From our prior writings you are quite familiar with how and why Kalmar’s philosophy and disciplines influence our general portfolio positioning. For example, these disciplines led our Small Cap strategy to be meaningfully underweight in Health Care in 2013, 2014 and 2015 relative to the benchmarks because this sector became increasingly laden with small development-stage Pharma and Biotech companies that were on a momentum binge and that do not meet our criteria for business quality, actual revenues & earnings, sensible stock valuations and have high unpredictable binary risk. To be clear, some of these will make important therapeutic advances and transform into real businesses but most are, in reality, “science ventures” wholly dependent on outside capital. Sensible risk control also causes us to reduce our exposure to the more regulated Financial Services sector, where we have been systematically underweight for years. This is because most garden-variety banks, insurers, finance companies, and REITs either do not meet our legitimate growth company investment criteria or have unacceptable “transparency risk” related to the quality of their assets when they attempt to grow rapidly. While purposefully avoiding direct investment in small BioPharmas, or Banks with potentially unwise growth ambitions, or other volatile groups like commodity-dependent companies that have limited ability to create a more predictable growth path, Kalmar seeks to invest smartly in such industries indirectly by identifying growth service businesses supplying their particular needs without taking on the sorts of risks referred to above. For instance specifically related to BioPharma, over the last couple years our research uncovered and qualified a number of new † Market cap values shown are at the time of purchase during the quarter. 4 Infinera Corp (0.5% of Fund assets as of 6/30/16)
5
KALMAR POOLED INVESTMENT TRUST
Report from Management — continued
“GROWTH-WITH-VALUE” SMALL CAP FUND
portfolio additions that meet our criteria of “real businesses” as well as proxy plays and angle shots into BioPharma that benefit from the therapeutic breakthroughs and growth in final demand from this exciting area of experimental science. Accordingly, we were able to increase our overall Health Care weighting in the Fund to a very modest overweight. Indeed, in the last 12-months the upweighting in Health Care represents the largest of any of our sectoral exposure changes – a purposeful and productive move against the backdrop of sub-par economic momentum. It was enabled by creative company by company research additions during the period and assisted by the carnage in BioPharma stocks and their related shrinking weight in the benchmarks – which we had correctly forecast. Importantly, in addition to largely avoiding the pain in tiny development-stage BioPharmas, our Health Care stocks (including newer additions) nicely outperformed their index counterparts pretty much across the board. But of course, if our disciplines lead us to be underweight certain areas, such as Financial Services and most commodity-dependent companies, then we effectively must upweight certain others. Thus, we employ bottom-up research to uncover and qualify more-proprietary growth businesses from other areas, which vary over time. This has led the Kalmar Fund presently to be overweight in the Technology, Energy and Consumer Staples sectors, for instance. These sectors of the economy offer opportunities to qualify high-quality companies with attributes such as superior management and market position, intellectual property, special expertise, or manufacturing/service dominance, to name a few. While this can lead to holdings with theoretically more economic sensitivity, such companies sometimes have relatively fewer competitors, which can enhance long-term pricing power, while their regulatory oversight can be less onerous than, say, in Health Care or Finance. Further, unlike the extended leadership stocks of 2015, certain of these companies trade at moderate multiples of 2016 and 2017 earnings expectations, in many cases well below their norms. We believe this should ultimately make for attractive reward-to-risk opportunities particularly when our research is able to develop a differentiated quality and several-year earnings power assessment for the particular business. In fairness though, however seemingly sensible, this quality-oriented, more-diversified strategy did not benefit the Fund in 2014 and 2015 as the market became increasingly low quality, ever narrower, and more highly momentumized. As we’ve said over the last year, however, we believe evidence is gathering – particularly in last summer’s correction and the January-February meltdown – that a gradual shift in leadership is underway that will better reward the appealing valuation, sturdiness, and longer term growth potential offered by such “real businesses”. It hasn’t and won’t happen in a straight line, however. Pre-Brexit, most economists’ views were that slow world growth would diminish somewhat further in 2016 – with risks to the downside – under pressure from China’s and the Emerging Markets’ slowdown and impacts of weakness in oil and other commodities. That prospect should worsen now with Brexit uncertainties weighing on both the U.K. itself and the EU27 countries. With the difficulty this poses to investors seeking companies with sustainable earnings power – particularly if we are also into the back half of a profit cycle – we believe it may cause them to refocus on the better values available in strong businesses that can be assured of weathering through, while simultaneously improving their competitive positions in the bargain. Good, necessary, well-managed businesses able to generate cash, pay down debt if necessary, and emerge stronger we believe can still be the better bets for the remainder of this year. 6
KALMAR POOLED INVESTMENT TRUST
Report from Management — continued
“GROWTH-WITH-VALUE” SMALL CAP FUND
The Kalmar Fund holds many such quality long term growers, in addition of course to a goodly measure of high growth substantive businesses at reasonable valuations – which we believe is appropriate for 2016’s uncertain environment. Our many years of managing Smaller Cap portfolios – with their always higher volatility no matter what – teaches that there are times to possibly take more risk in pursuit of making more money and times to be more cautious while setting up future opportunities. 2016 looks like it could potentially be one of these latter times. Meanwhile, we believe our companies have a good mix of inherent growth and internal initiatives at work that are furthering their business enterprise value build while also having strong competitive and financial positions that should only be more essential if times get tougher. In short, a good combination of offense and defense. Economic and Market Outlook Going into the shock of the Brexit referendum, world growth was expected to be sub-par and slower than earlier anticipated, in the U.S. as well, though the U.S. is less exposed to China and Emerging Market slowdowns than other economies. Risks were to the downside though because of, among other things, Black Swan potential for credit crises there. These factors placed that much more criticality on the durability and longevity of the U.S. recovery and at a minimum maintenance of economic stability in the Eurozone. Well…? As the dust begins to settle in the global landscape post-Brexit-vote, prospects for the next year or so are subject to an even greater lack of predictability than usual. A reasonable presumption is that global growth will be lower but initially not by much. Brexit’s global economic implications would appear initially modest because of the U.K.’s relatively small 2% share of global GDP. But its potential impact on the EU is more serious, especially on the U.K.’s closer trading partners. Another guess is that EU GDP growth will be reduced by a noticeable amount through 2017 but hopefully not enough to cause a recession there. Policy easing and more of Mr. Draghi’s “whatever it takes” should cushion the blow to the EU. As to the U.K. itself, economic prospects there have taken a substantial hit, but again hopefully may avoid a recession. The odds are worse however. Uncertainty surrounding the process of “leaving” and terms of the U.K.’s new economic relationship with EU27 to be determined over several years will weigh on private investment and consumption spending for some time. Obviously much will be determined by business and consumer psychology, politics, and the unprecedented negotiations and is inherently unknowable at this time. The Bank of England and substantial depreciation of the Pound will also cushion the blow to the U.K. Equity markets’ relatively orderly decline and strong snap-back seem to be validating the above views, but uncertainties unquestionably have risen and only gradually will come clear. Perhaps the biggest risk to benign views would be that fissures in Europe’s banking systems are opened by Brexit. Example, there are construction cranes everywhere in London whose buildings may not fill if Brexit negotiations are short sighted. Property Funds have already frozen withdrawals. Moreover, banks have been weakened by a combination of slow growth, low rates, tightened regulations, and compression of capital ratios as financial stock prices have plunged – especially in the wake of the Brexit vote. Banking risks are already especially acute in Italy. Certain economists estimate that a relatively mild scenario where banks elect not to expand their balance sheets 7
KALMAR POOLED INVESTMENT TRUST
Report from Management — continued
“GROWTH-WITH-VALUE” SMALL CAP FUND
through the end of 2017 would lead to a halving of European growth. A more serious credit crunch would obviously lead to more negative consequences. Kalmar’s base case assumptions still are for recessions generally to be avoided. The odds, supported by more recent U.S. economic data and Fed dovishness, particularly favor the U.S. avoiding recession if Brexit impact is reasonably contained. Still, the now increased economic uncertainty suggests – please pardon the evident repetition – a smart “Risk Off” portfolio posture focused on the kinds of bottom-up-qualified better companies that can be expected to hold and gain comparative value through what conceivably could be challenging times. America has an evidently bifurcated economy, with industrial and energy-related recessions underway but with significant offsetting strengths in the housing sector, improving household formation, rising employment and hourly earnings, stable consumer spending, and solid personal and corporate balance sheets, leading economic indicators still increasing with GDP below potential, thus still expansionary Fed policy, low financial system risk, and social stability not subject to an upset like in certain other countries. America really is “The Best House on the World Block”! As to the outlook for U.S. stocks and the Kalmar Fund, valuations for Smaller Stocks in general are quite full relative to their history, though not excessively so. But with so many Small companies for Kalmar’s deep research to forage in, we continue to be able to qualify new investment opportunities that meet our business quality, growth, and valuation criteria and that should in turn support appealing future reward-to-risk in the Fund portfolio. Still, given the circumstances we’ve discussed and the additional unestimatable economic drag from Brexit, the course of the market becomes more difficult to predict. In a short run sense, we are somewhat surprised at the degree of complacency at work, illustrated in part by the market’s powerful snap-back from the Brexit shock in the face of greater incremental uncertainties. As to positives which we believe to be persuasive, these include that: the very low interest rates improve the relative appeal of the market’s earnings yield, the market’s present technical condition is generally healthy, Smaller Stocks are cheap versus Large and Mega Caps, Small Growth appears cheap though more mixed versus Small Value, Quality is very cheap, and most importantly our portfolio companies themselves, we believe, will continue to make sturdy forward progress adding to their enterprise values and building their competitive advantages. Organizational Comments Continuity makes a difference. Kalmar’s ten person investment team led by Ford Draper and Dana Walker for 19 years since the Funds inception and several valuable support teams – with partners of the firm throughout – are stable, productive, and committed to meet the expectations of our shareholders. This brings our best wishes for a healthy and prosperous Summer. Yours faithfully, KALMAR POOLED INVESTMENT TRUST 8
KALMAR POOLED INVESTMENT TRUST
Report from Management — continued
“GROWTH-WITH-VALUE” SMALL CAP FUND
IMPORTANT INFORMATION Kalmar’s comments reflect the investment adviser’s general opinions regarding the market, economy, and any stocks mentioned or stock opinions given, were current only as of the date of this letter, and are subject to change at any time. The information provided in this letter is not sufficient upon which to base an investment decision and should not be considered a recommendation to purchase or sell a particular security. A preponderant portion of the investments in the Kalmar Fund are in small cap stocks. Investments in small cap stocks involve greater risks than investments in larger, more established companies, are more volatile, and may suffer significant losses. Further, the market for small cap stocks is generally less liquid than the markets for larger stocks, which can contribute to increased price volatility of small cap stocks. Kalmar invests in growth stocks with the potential for significant growth and may be more volatile because they are more sensitive to market conditions. Kalmar may seek to buy these stocks at undervalued prices and this involves the risk that the securities may remain undervalued for an extended period of time and may not realize its full potential. Market or economic conditions can vary widely over time and can result in a loss of portfolio value. ROE (Return on equity) measures a corporation’s profitability by revealing how much profit a company generates with the money shareholders have invested. Investment return and principal value of an investment may fluctuate so that an investor’s shares, when redeemed, may be worth more or less than their original cost. Current and future portfolio holdings are subject to risk. There is no guarantee that the Kalmar Fund will continue to hold any one particular security or stay invested in any one particular sector. The performance of any single portfolio holding is no indication of the performance of other portfolio holdings or of the performance of the Fund itself. This commentary is not representative of all securities purchased or sold for the Kalmar Fund. Holdings are subject to change. Kalmar Investments will provide a list of security purchases and sales for the past 12 months upon request. The Kalmar “Growth-with-Value” Small Cap Fund’s benchmark is the Russell 2000® Growth Index. The Russell 2000® Growth Index is reconstituted annually and measures the performance of those Russell 2000 companies with higher price-to-book ratios and higher forecasted growth rates. The Russell 2000® Index covers up to 2,000 companies in the U.S. market. The Russell 2000® Index and Russell 2000 Growth® Index are registered trademarks of Russell Investments. Russell is a trademark of Russell Investments. The indices mentioned herein are unmanaged and not available for direct investment. Unlike a mutual fund, the performance of these indices assumes no taxes, transaction costs, management fees or other expenses. You cannot invest directly in an index.
9
KALMAR POOLED INVESTMENT TRUST
Report from Management — concluded
“GROWTH-WITH-VALUE” SMALL CAP FUND
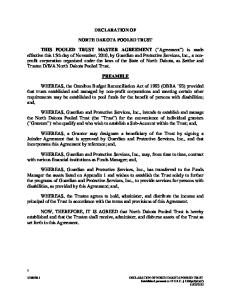
Kalmar Pooled Investment Trust — “Growth-with-Value” Small Cap Fund — Investor Class Shares Growth of $10,000 vs. The Russell 2000® Growth Index and The Russell 2000® Index $50,000
AVERAGE ANNUAL TOTAL RETURNS (%) AS OF 06/30/16 Six Months
45,000 40,000 35,000
Kalmar Small Cap Fund – Investor Class Russell 2000® Growth Russell 2000®
3.36% -1.59% 2.22%
1 Year -8.62% -10.75% -6.73%
Since 5 Year* 10 Year* Inception* 5.64% 8.51% 8.35%
6.23% 7.14% 6.20%
$44,013 $43,000
8.02% 6.45% 7.88% $33,283
*Annualized
30,000 25,000 20,000 15,000 10,000 5,000 4/11/97 6/30/98
6/30/00
6/30/02
6/30/04
6/30/06
6/30/08
6/30/10 ®
Russell 2000
Kalmar Small Cap – Investor Class
6/30/12
6/30/14
6/30/16
Russell 2000® Growth
The performance data quoted represents past performance and does not guarantee future results. Current performance may be lower or higher. Performance data current to the most recent month-end may be obtained by calling 800-463-6670. The investment return and principal value of an investment will fluctuate so that shares, when redeemed, may be worth more or less than their original cost. The graph and table do not reflect the deduction of taxes that a shareholder would pay on fund distributions or the redemption of fund shares. The Kalmar “Growth with Value” Small Cap Fund’s (the “Fund”) annual gross operating expense, as stated in the current prospectus, is 1.36%, 1.18% and 1.28% for the Investor Class, the Institutional Class and the Advisor Class, respectively. These ratios may differ from the actual expenses incurred for the period covered by this report. The Fund’s investment adviser, Kalmar Investment Advisers (“Kalmar” or the “Adviser”), has contractually agreed to the reimbursement of other operating expenses or the waiver of all or a portion of its advisory fee in order to limit “Total Annual Fund Operating Expenses,” excluding extraordinary expenses, brokerage commissions, interest and “Acquired Fund” fees and expenses, to, as a percentage of average daily net assets, 1.50%, 1.25% and 1.35% with respect to the Investor Class, the Institutional Class and the Advisor Class, respectively (the “Expense Limitation”). Kalmar will reimburse expenses attributable to a specific class before waiving its advisory fee or reimbursing other expenses allocated to the Fund as a whole (“Fund-wide expenses”). The Expense Limitation will remain in place until April 30, 2017, unless the Board of Trustees of the Kalmar Pooled Investment Trust (the “Trust”) approves its earlier termination. Subject to approval by the Board of Trustees, the Adviser may recoup any expenses reimbursed or fees waived within a three-year period from the year in which the Adviser reimbursed expenses of a Class or the Fund or waived its fees. No recoupment will occur unless the expenses of a Class or the Fund are below the Expense Limitation. The Fund imposes a 2% redemption fee calculated as a percentage of the amount redeemed and is charged only if shares are redeemed within 30 days of purchase.
The Russell 2000® Growth and the Russell 2000® indices are unmanaged stock market indices and do not reflect any asset-based charges for investment management or transaction expenses. It is not possible to invest directly into an index.
10
KALMAR POOLED INVESTMENT TRUST
Fund Expense Example (Unaudited)
“GROWTH-WITH-VALUE” SMALL CAP FUND
As a shareholder of the Fund, you incur two types of costs: (1) transaction costs, including redemption fees, and (2) ongoing costs, including management fees and other Fund expenses. This example is intended to help you understand your ongoing costs (in dollars) of investing in the Fund and to compare these costs with the ongoing costs of investing in other mutual funds. The example is based on an investment of $1,000 invested at the beginning of the period and held for the entire six months ended June 30, 2016. Actual Expenses The first line of the table below provides information about actual account values and actual expenses. You may use the information in this line, together with the amount you invested, to estimate the expenses that you paid over the period. Simply divide your account value by $1,000 (for example, an $8,600 account value divided by $1,000 = 8.6), then multiply the result by the number in the first line under the heading entitled “Expenses Paid During Six Months Ended June 30, 2016” to estimate the expenses you paid on your account during this period. Hypothetical Example for Comparison Purposes The second line of the table below provides information about hypothetical account values and hypothetical expenses based on the Fund’s actual expense ratio and an assumed rate of return of 5% per year before expenses, which is not the Fund’s actual return. The hypothetical account values and expenses may not be used to estimate the actual ending account balance or expenses you paid for the period. You may use this information to compare the ongoing costs of investing in the Fund and other funds. To do so, compare this 5% hypothetical example with the 5% hypothetical examples that appear in the shareholder reports of other funds.
11
KALMAR POOLED INVESTMENT TRUST
Fund Expense Example — concluded
“GROWTH-WITH-VALUE” SMALL CAP FUND
Please note that the expenses shown in the table are meant to highlight your ongoing costs only and do not reflect any transactional costs, such as redemption fees. Therefore, the second line of the table is useful in comparing ongoing costs only, and will not help you determine the relative total costs of owning different funds. In addition, if transactional costs were included, your costs would have been higher. Kalmar “Growth-with-Value” Small-Cap Fund
Investor Class* Actual Hypothetical (5% return before expenses) Institutional Class** Actual Hypothetical (5% return before expenses) Advisor Class*** Actual Hypothetical (5% return before expenses)
Beginning Account Value January 1, 2016
Ending Account Value June 30, 2016
Expenses Paid During Six Months Ended June 30, 2016
$1,000.00
$1,033.60
$7.59
$1,000.00
$1,017.40
$7.53
$1,000.00
$1,035.50
$6.33
$1,000.00
$1,018.65
$6.28
$1,000.00
$1,034.90
$6.83
$1,000.00
$1,018.15
$6.78
*
Expenses are equal to the Investor Class’s annualized expense ratio of 1.50% multiplied by the average account value over the period, multiplied by 182 days/366 days (to reflect the one-half year period). The Investor Class’s ending account value on the first line in the table is based on its actual total return of 3.36% for the six-month period of January 1, 2016 to June 30, 2016. ** Expenses are equal to the Institutional Class’s annualized expense ratio of 1.25% multiplied by the average account value over the period, multiplied by 182 days/366 days (to reflect the one-half year period). The Institutional Class’s ending account value on the first line in the table is based on its actual total return of 3.55% for the six-month period of January 1, 2016 to June 30, 2016. *** Expenses are equal to the Advisor Class’s annualized expense ratio of 1.35% multiplied by the average account value over the period, multiplied by 182 days/366 days (to reflect the one-half year period). The Advisor Class’s ending account value on the first line in the table is based on its actual total return of 3.49% for the six-month period of January 1, 2016 to June 30, 2016.
12
KALMAR POOLED INVESTMENT TRUST “GROWTH-WITH-VALUE” SMALL CAP FUND
Portfolio Holdings Summary Table June 30, 2016 (Unaudited)
% of Net Assets
Common Stock: Technology . . . . . . . . . . . . . . . . . . . . . . . . . . . . . . . . . . . . . . . . . . . . . . . . . . . . . . . Healthcare . . . . . . . . . . . . . . . . . . . . . . . . . . . . . . . . . . . . . . . . . . . . . . . . . . . . . . . . Consumer Discretionary . . . . . . . . . . . . . . . . . . . . . . . . . . . . . . . . . . . . . . . . . . . . . Producer Durables . . . . . . . . . . . . . . . . . . . . . . . . . . . . . . . . . . . . . . . . . . . . . . . . . . Materials & Processing . . . . . . . . . . . . . . . . . . . . . . . . . . . . . . . . . . . . . . . . . . . . . . Financial Services . . . . . . . . . . . . . . . . . . . . . . . . . . . . . . . . . . . . . . . . . . . . . . . . . . Consumer Staples . . . . . . . . . . . . . . . . . . . . . . . . . . . . . . . . . . . . . . . . . . . . . . . . . . Energy . . . . . . . . . . . . . . . . . . . . . . . . . . . . . . . . . . . . . . . . . . . . . . . . . . . . . . . . . . . Utilities . . . . . . . . . . . . . . . . . . . . . . . . . . . . . . . . . . . . . . . . . . . . . . . . . . . . . . . . . . Money Market Fund . . . . . . . . . . . . . . . . . . . . . . . . . . . . . . . . . . . . . . . . . . . . . . . . . . Securities Lending Collateral . . . . . . . . . . . . . . . . . . . . . . . . . . . . . . . . . . . . . . . . . . .
23.2% 23.2 16.6 12.4 7.2 5.3 4.8 4.1 2.3 0.5 21.3
Total Investments . . . . . . . . . . . . . . . . . . . . . . . . . . . . . . . . . . . . . . . . . . . . . . . . . . . . Liabilities In Excess Of Other Assets . . . . . . . . . . . . . . . . . . . . . . . . . . . . . . . . . . . . .
120.9 (20.9)
NET ASSETS — 100.0% . . . . . . . . . . . . . . . . . . . . . . . . . . . . . . . . . . . . . . . . . . . . . .
100.0%
See Accompanying Notes to Financial Statements 13
Fair Value
$ 40,318,469 40,308,933 28,750,999 21,449,573 12,596,344 9,155,890 8,305,477 7,117,304 3,934,108 921,519 36,879,825 209,738,441 (36,315,020) $173,423,421
KALMAR POOLED INVESTMENT TRUST
Schedule of Investments June 30, 2016 (Unaudited)
“GROWTH-WITH-VALUE” SMALL CAP FUND
Value (Note 2)
Shares
COMMON STOCK — 99.1% Consumer Discretionary — 16.6% AUTO PARTS — 1.3% LKQ Corp. * . . . . . . . . . . . . . . . . . . . . . . . . . . . . . . . . . . . . . . . . . . . . . . .
71,305
ENTERTAINMENT — 2.5% IMAX Corp. (Canada) * . . . . . . . . . . . . . . . . . . . . . . . . . . . . . . . . . . . . . Live Nation Entertainment, Inc. * . . . . . . . . . . . . . . . . . . . . . . . . . . . . . .
57,475 112,055
$
2,260,369 1,694,363 2,633,293 4,327,656
RADIO & TV BROADCASTERS — 0.9% Entravision Communications Corp. (A Shares) . . . . . . . . . . . . . . . . . . . .
236,900
1,591,968
RESTAURANTS — 5.0% Chuy’s Holdings, Inc. * (a) . . . . . . . . . . . . . . . . . . . . . . . . . . . . . . . . . . . Popeyes Louisiana Kitchen, Inc. * . . . . . . . . . . . . . . . . . . . . . . . . . . . . . . Red Robin Gourmet Burgers, Inc. * . . . . . . . . . . . . . . . . . . . . . . . . . . . . Texas Roadhouse, Inc. (a) . . . . . . . . . . . . . . . . . . . . . . . . . . . . . . . . . . . .
81,865 17,225 23,450 83,710
2,833,348 941,174 1,112,234 3,817,176 8,703,932
SPECIALTY RETAIL — 3.9% Shutterfly, Inc. * . . . . . . . . . . . . . . . . . . . . . . . . . . . . . . . . . . . . . . . . . . . . Ulta Salon Cosmetics & Fragrance, Inc. * . . . . . . . . . . . . . . . . . . . . . . . . Zumiez, Inc. * (a) . . . . . . . . . . . . . . . . . . . . . . . . . . . . . . . . . . . . . . . . . . .
40,215 15,170 77,715
1,874,421 3,696,019 1,112,102 6,682,542
TEXTILES APPAREL & SHOES — 3.0% G-III Apparel Group, Ltd. * (a) . . . . . . . . . . . . . . . . . . . . . . . . . . . . . . . . Oxford Industries, Inc. . . . . . . . . . . . . . . . . . . . . . . . . . . . . . . . . . . . . . . .
61,180 42,165
2,797,150 2,387,382 5,184,532
TOTAL CONSUMER DISCRETIONARY . . . . . . . . . . . . . . . . . . . . . . . . . . . .
See Accompanying Notes to Financial Statements 14
28,750,999
KALMAR POOLED INVESTMENT TRUST “GROWTH-WITH-VALUE” SMALL CAP FUND
Schedule of Investments — continued June 30, 2016 (Unaudited)
Value (Note 2)
Shares
Consumer Staples — 4.8% DRUG & GROCERY STORE CHAINS — 1.6% Smart & Final Stores, Inc. * . . . . . . . . . . . . . . . . . . . . . . . . . . . . . . . . . . .
179,955
FOODS — 3.2% Performance Food Group Co. * . . . . . . . . . . . . . . . . . . . . . . . . . . . . . . . . TreeHouse Foods, Inc. * (a) . . . . . . . . . . . . . . . . . . . . . . . . . . . . . . . . . . .
79,370 34,000
$
2,679,530 2,135,847 3,490,100 5,625,947
TOTAL CONSUMER STAPLES . . . . . . . . . . . . . . . . . . . . . . . . . . . . . . . . . .
8,305,477
Energy — 4.1% OFFSHORE DRILLING & OTHER SERVICES — 0.5% Atwood Oceanics, Inc. (a) . . . . . . . . . . . . . . . . . . . . . . . . . . . . . . . . . . . .
65,425
819,121
OIL: CRUDE PRODUCERS — 3.6% Matador Resources Co. * (a) . . . . . . . . . . . . . . . . . . . . . . . . . . . . . . . . . . PDC Energy, Inc. * (a) . . . . . . . . . . . . . . . . . . . . . . . . . . . . . . . . . . . . . . . Southwestern Energy Co. * (a) . . . . . . . . . . . . . . . . . . . . . . . . . . . . . . . .
138,965 49,750 54,100
2,751,507 2,866,098 680,578 6,298,183
TOTAL ENERGY . . . . . . . . . . . . . . . . . . . . . . . . . . . . . . . . . . . . . . . . . . . .
7,117,304
Financial Services — 5.3% ASSET MANAGEMENT & CUSTODIAN — 0.9% Financial Engines, Inc. (a) . . . . . . . . . . . . . . . . . . . . . . . . . . . . . . . . . . . .
59,590
1,541,593
CONSUMER LENDING — 1.0% Encore Capital Group, Inc. * (a) . . . . . . . . . . . . . . . . . . . . . . . . . . . . . . .
72,815
1,713,337
FINANCIAL DATA & SYSTEMS — 3.4% Alliance Data Systems Corp. * . . . . . . . . . . . . . . . . . . . . . . . . . . . . . . . . WageWorks, Inc. * . . . . . . . . . . . . . . . . . . . . . . . . . . . . . . . . . . . . . . . . . .
10,815 63,235
2,118,875 3,782,085 5,900,960
TOTAL FINANCIAL SERVICES . . . . . . . . . . . . . . . . . . . . . . . . . . . . . . . . . . See Accompanying Notes to Financial Statements 15
9,155,890
KALMAR POOLED INVESTMENT TRUST “GROWTH-WITH-VALUE” SMALL CAP FUND
Schedule of Investments — continued June 30, 2016 (Unaudited)
Value (Note 2)
Shares
Healthcare — 23.2% BIOTECHNOLOGY — 3.9% Ligand Pharmaceuticals, Inc. * (a) . . . . . . . . . . . . . . . . . . . . . . . . . . . . . . Repligen Corp. * . . . . . . . . . . . . . . . . . . . . . . . . . . . . . . . . . . . . . . . . . . .
32,300 108,945
$
3,852,421 2,980,735 6,833,156
HEALTH CARE FACILITIES — 0.6% Adeptus Health, Inc. (A Shares) * (a) . . . . . . . . . . . . . . . . . . . . . . . . . . .
21,205
1,095,450
HEALTHCARE SERVICES — 3.4% AMN Healthcare Services, Inc * . . . . . . . . . . . . . . . . . . . . . . . . . . . . . . . BioTelemetry, Inc. * . . . . . . . . . . . . . . . . . . . . . . . . . . . . . . . . . . . . . . . . Omnicell, Inc. * . . . . . . . . . . . . . . . . . . . . . . . . . . . . . . . . . . . . . . . . . . . .
62,565 115,180 42,035
2,500,723 1,877,434 1,438,858 5,817,015
MEDICAL & DENTAL INSTRUMENTS & SUPPLIES — 10.0% Cantel Medical Corp. . . . . . . . . . . . . . . . . . . . . . . . . . . . . . . . . . . . . . . . . Cooper Companies, Inc. (The) . . . . . . . . . . . . . . . . . . . . . . . . . . . . . . . . . Globus Medical, Inc. (A Shares) * (a) . . . . . . . . . . . . . . . . . . . . . . . . . . . ResMed, Inc. (a) . . . . . . . . . . . . . . . . . . . . . . . . . . . . . . . . . . . . . . . . . . . . Vascular Solutions, Inc. * (a) . . . . . . . . . . . . . . . . . . . . . . . . . . . . . . . . . . West Pharmaceutical Services, Inc. . . . . . . . . . . . . . . . . . . . . . . . . . . . . .
20,250 17,540 116,415 36,010 62,267 69,790
1,391,783 3,009,338 2,774,169 2,276,912 2,594,043 5,295,665 17,341,910
MEDICAL EQUIPMENT — 2.5% Inogen, Inc. * (a) . . . . . . . . . . . . . . . . . . . . . . . . . . . . . . . . . . . . . . . . . . . Luminex Corp. * . . . . . . . . . . . . . . . . . . . . . . . . . . . . . . . . . . . . . . . . . . .
45,995 101,115
2,304,809 2,045,556 4,350,365
PHARMACEUTICALS — 2.8% Amphastar Pharmaceuticals, Inc. * . . . . . . . . . . . . . . . . . . . . . . . . . . . . . Cambrex Corp. * (a) . . . . . . . . . . . . . . . . . . . . . . . . . . . . . . . . . . . . . . . . .
See Accompanying Notes to Financial Statements 16
55,600 46,205
896,272 2,390,185
KALMAR POOLED INVESTMENT TRUST “GROWTH-WITH-VALUE” SMALL CAP FUND
Schedule of Investments — continued June 30, 2016 (Unaudited)
Value (Note 2)
Shares
Healthcare — (continued) Teligent Inc. * (a) . . . . . . . . . . . . . . . . . . . . . . . . . . . . . . . . . . . . . . . . . . .
221,930
$
1,584,580 4,871,037
TOTAL HEALTHCARE . . . . . . . . . . . . . . . . . . . . . . . . . . . . . . . . . . . . . . . . Materials & Processing — 7.2% BUILDING MATERIALS — 2.6% NCI Building Systems, Inc. * . . . . . . . . . . . . . . . . . . . . . . . . . . . . . . . . . Trex Co., Inc. * . . . . . . . . . . . . . . . . . . . . . . . . . . . . . . . . . . . . . . . . . . . .
40,308,933
82,380 70,750
1,317,256 3,178,090 4,495,346
BUILDING: ROOFING, WALLBOARD & PLUMBING — 0.4% Advanced Drainage Systems, Inc. (a) . . . . . . . . . . . . . . . . . . . . . . . . . . .
26,935
737,211
CHEMICALS: DIVERSIFIED — 2.1% PolyOne Corp. . . . . . . . . . . . . . . . . . . . . . . . . . . . . . . . . . . . . . . . . . . . . .
106,774
3,762,716
DIVERSIFIED MATERIALS & PROCESSING — 2.1% Belden, Inc. . . . . . . . . . . . . . . . . . . . . . . . . . . . . . . . . . . . . . . . . . . . . . . .
59,650
3,601,071
TOTAL MATERIALS & PROCESSING . . . . . . . . . . . . . . . . . . . . . . . . . . . . . Producer Durables — 12.4% BACK OFFICE SUPPORT, HR, AND CONSULTING — 3.1% CEB, Inc. . . . . . . . . . . . . . . . . . . . . . . . . . . . . . . . . . . . . . . . . . . . . . . . . . WNS Holdings, Ltd., ADR * (a) . . . . . . . . . . . . . . . . . . . . . . . . . . . . . . .
12,596,344
41,580 103,459
2,564,654 2,793,393 5,358,047
COMMERCIAL SERVICES: RENTAL & LEASING — 1.3% Mobile Mini, Inc. . . . . . . . . . . . . . . . . . . . . . . . . . . . . . . . . . . . . . . . . . . .
66,895
2,317,243
FORMS AND BULK PRINTING SERVICES — 0.9% InnerWorkings, Inc. * . . . . . . . . . . . . . . . . . . . . . . . . . . . . . . . . . . . . . . .
187,730
1,552,527
See Accompanying Notes to Financial Statements 17
KALMAR POOLED INVESTMENT TRUST “GROWTH-WITH-VALUE” SMALL CAP FUND
Schedule of Investments — continued June 30, 2016 (Unaudited)
Value (Note 2)
Shares
Producer Durables — (continued) INTERNATIONAL TRADE AND DIVERSIFIED LOGISTICS — 1.2% MSC Industrial Direct Co., Inc. (A Shares) . . . . . . . . . . . . . . . . . . . . . . .
28,565
MACHINERY: INDUSTRIAL — 1.7% Middleby Corp. * . . . . . . . . . . . . . . . . . . . . . . . . . . . . . . . . . . . . . . . . . . .
24,850
2,863,963
OFFICE SUPPLIES & EQUIPMENT — 2.0% Electronics For Imaging, Inc. * (a) . . . . . . . . . . . . . . . . . . . . . . . . . . . . .
81,145
3,492,481
SCIENTIFIC INSTRUMENTS: ELECTRICAL — 2.2% A.O. Smith Corp. . . . . . . . . . . . . . . . . . . . . . . . . . . . . . . . . . . . . . . . . . . . EnerSys . . . . . . . . . . . . . . . . . . . . . . . . . . . . . . . . . . . . . . . . . . . . . . . . . .
26,225 25,880
2,310,682 1,539,084
$
2,015,546
3,849,766 TOTAL PRODUCER DURABLES . . . . . . . . . . . . . . . . . . . . . . . . . . . . . . . . . Technology — 23.2% COMMUNICATIONS TECHNOLOGY — 2.0% GTT Communications, Inc. * . . . . . . . . . . . . . . . . . . . . . . . . . . . . . . . . . Infinera Corp. * (a) . . . . . . . . . . . . . . . . . . . . . . . . . . . . . . . . . . . . . . . . . .
21,449,573
146,700 71,870
2,711,016 810,694 3,521,710
COMPUTER SERVICES SOFTWARE & SYSTEMS — 12.1% Actua Corp. * . . . . . . . . . . . . . . . . . . . . . . . . . . . . . . . . . . . . . . . . . . . . . . Acxiom Corp. * . . . . . . . . . . . . . . . . . . . . . . . . . . . . . . . . . . . . . . . . . . . . Bottomline Technologies, (de) Inc. * (a) . . . . . . . . . . . . . . . . . . . . . . . . . Callidus Software, Inc. * . . . . . . . . . . . . . . . . . . . . . . . . . . . . . . . . . . . . . Imperva, Inc. * (a) . . . . . . . . . . . . . . . . . . . . . . . . . . . . . . . . . . . . . . . . . . LogMeIn, Inc. * . . . . . . . . . . . . . . . . . . . . . . . . . . . . . . . . . . . . . . . . . . . . Pegasystems, Inc. . . . . . . . . . . . . . . . . . . . . . . . . . . . . . . . . . . . . . . . . . . . SPS Commerce, Inc. * . . . . . . . . . . . . . . . . . . . . . . . . . . . . . . . . . . . . . . . Ultimate Software Group, Inc. * (a) . . . . . . . . . . . . . . . . . . . . . . . . . . . .
64,425 172,457 95,050 170,825 19,010 38,470 84,740 22,545 20,535
581,758 3,792,329 2,046,427 3,413,084 817,620 2,440,152 2,283,743 1,366,227 4,318,305 21,059,645
See Accompanying Notes to Financial Statements 18
KALMAR POOLED INVESTMENT TRUST “GROWTH-WITH-VALUE” SMALL CAP FUND
Schedule of Investments — continued June 30, 2016 (Unaudited)
Value (Note 2)
Shares
Technology — (continued) ELECTRONIC COMPONENTS — 2.9% Methode Electronics, Inc. . . . . . . . . . . . . . . . . . . . . . . . . . . . . . . . . . . . . Rogers Corp. * . . . . . . . . . . . . . . . . . . . . . . . . . . . . . . . . . . . . . . . . . . . . .
62,235 45,970
$
2,130,304 2,808,767 4,939,071
PRODUCTION TECHNOLOGY EQUIPMENT — 0.5% Xcerra Corp. * . . . . . . . . . . . . . . . . . . . . . . . . . . . . . . . . . . . . . . . . . . . . .
148,345
852,984
SEMICONDUCTORS & COMPONENTS — 5.7% CEVA, Inc. * . . . . . . . . . . . . . . . . . . . . . . . . . . . . . . . . . . . . . . . . . . . . . . Exar Corp. * (a) . . . . . . . . . . . . . . . . . . . . . . . . . . . . . . . . . . . . . . . . . . . . MaxLinear, Inc. (A Shares) * . . . . . . . . . . . . . . . . . . . . . . . . . . . . . . . . . . Power Integrations, Inc. . . . . . . . . . . . . . . . . . . . . . . . . . . . . . . . . . . . . . .
101,085 162,630 176,480 54,250
2,746,479 1,309,172 3,173,110 2,716,298 9,945,059
TOTAL TECHNOLOGY . . . . . . . . . . . . . . . . . . . . . . . . . . . . . . . . . . . . . . . . Utilities — 2.3% TELECOMMUNICATIONS — 2.3% 8X8, Inc. * . . . . . . . . . . . . . . . . . . . . . . . . . . . . . . . . . . . . . . . . . . . . . . . .
40,318,469
269,275
3,934,108
TOTAL UTILITIES . . . . . . . . . . . . . . . . . . . . . . . . . . . . . . . . . . . . . . . . . . .
3,934,108
TOTAL COMMON STOCK (COST $100,529,562) . . . . . . . . . . . . . . . . . . . .
171,937,097
See Accompanying Notes to Financial Statements 19
KALMAR POOLED INVESTMENT TRUST
Schedule of Investments — concluded June 30, 2016 (Unaudited)
“GROWTH-WITH-VALUE” SMALL CAP FUND
Value (Note 2)
Shares/Par
SECURITIES LENDING COLLATERAL — 21.3% BlackRock Liquidity Funds TempFund Portfolio . . . . . . . . . . . . . . . . . . U.S. Treasury Bill, 0.00%, 07/14/16-04/27/17 . . . . . . . . . . . . . . . . . . . . U.S. Treasury Bond, 2.50%-7.63%, 02/15/25-02/15/46 . . . . . . . . . . . . . U.S. Treasury Inflation Indexed Bond, 0.75%-1.38%, 02/15/44-02/15/45 . . . . . . . . . . . . . . . . . . . . . . . . . . . . . . . . . . . . . . . . U.S. Treasury Inflation Indexed Note, 0.13%-2.50%, 07/15/16-07/15/25 . . . . . . . . . . . . . . . . . . . . . . . . . . . . . . . . . . . . . . . . U.S. Treasury Note, 0.34%-4.75%, 07/15/16-11/15/25 . . . . . . . . . . . . . .
9,059,746 1,722,070 6,359,838
$
9,059,746 1,720,828 7,763,750
568,651
670,882
1,250,542 15,607,892
1,355,505 16,309,114
TOTAL SECURITIES LENDING COLLATERAL (COST $36,879,825) . . . . . .
36,879,825
MONEY MARKET SECURITY — 0.5% Money Market Fund — 0.5% BlackRock Liquidity Funds TempFund Portfolio — Institutional Shares (seven-day effective yield 0.43%) . . . . . . . . . . . . . . . . . . . . . .
921,519
921,519
TOTAL MONEY MARKET SECURITY (COST $921,519) . . . . . . . . . . . . . .
921,519
TOTAL INVESTMENTS (COST $138,330,906) — 120.9% . . . . . . . . .
209,738,441
LIABILITIES IN EXCESS OF OTHER ASSETS — (20.9)% . . . . . . . .
(36,315,020)
NET ASSETS — 100.0% . . . . . . . . . . . . . . . . . . . . . . . . . . . . . . . . . . . . *
Non-income producing security All or a portion of the security is on loan. See Note 10 in Notes to Financial Statements. ADR American Depository Receipt (a)
See Accompanying Notes to Financial Statements 20
$173,423,421
KALMAR POOLED INVESTMENT TRUST
Statements of Assets And Liabilities
“GROWTH-WITH-VALUE” SMALL CAP FUND
As of June 30, 2016 (Unaudited)
Assets: Investment in securities, at fair value* (Cost $138,330,906) . . . . . . . . . . . . . . . . . . . . . . . . . . . . . . . . . . . . . . . . . . . . . . . . . . . . . . . . . . . Receivables for: Investment securities sold . . . . . . . . . . . . . . . . . . . . . . . . . . . . . . . . . . . . . . . . . . . . . . . . . . . . . . Dividends . . . . . . . . . . . . . . . . . . . . . . . . . . . . . . . . . . . . . . . . . . . . . . . . . . . . . . . . . . . . . . . . . . . Capital shares subscribed . . . . . . . . . . . . . . . . . . . . . . . . . . . . . . . . . . . . . . . . . . . . . . . . . . . . . . . Other assets . . . . . . . . . . . . . . . . . . . . . . . . . . . . . . . . . . . . . . . . . . . . . . . . . . . . . . . . . . . . . . . . . . .
$209,738,441 2,116,192 39,198 8,786 34,154
Total Assets . . . . . . . . . . . . . . . . . . . . . . . . . . . . . . . . . . . . . . . . . . . . . . . . . . . . . . . . . . . . . . . . .
211,936,771
Liabilities: Payables for: Securities lending collateral . . . . . . . . . . . . . . . . . . . . . . . . . . . . . . . . . . . . . . . . . . . . . . . . . . . . . Investment securities purchased . . . . . . . . . . . . . . . . . . . . . . . . . . . . . . . . . . . . . . . . . . . . . . . . . Due to custodian . . . . . . . . . . . . . . . . . . . . . . . . . . . . . . . . . . . . . . . . . . . . . . . . . . . . . . . . . . . . . . Capital shares redeemed . . . . . . . . . . . . . . . . . . . . . . . . . . . . . . . . . . . . . . . . . . . . . . . . . . . . . . . . Advisory fee . . . . . . . . . . . . . . . . . . . . . . . . . . . . . . . . . . . . . . . . . . . . . . . . . . . . . . . . . . . . . . . . . Trustee fees . . . . . . . . . . . . . . . . . . . . . . . . . . . . . . . . . . . . . . . . . . . . . . . . . . . . . . . . . . . . . . . . . Accrued expenses and other liabilities . . . . . . . . . . . . . . . . . . . . . . . . . . . . . . . . . . . . . . . . . . . . .
36,879,825 630,891 416,371 221,553 120,703 6,156 237,851
Total Liabilities . . . . . . . . . . . . . . . . . . . . . . . . . . . . . . . . . . . . . . . . . . . . . . . . . . . . . . . . . . . . . .
38,513,350
Net Assets . . . . . . . . . . . . . . . . . . . . . . . . . . . . . . . . . . . . . . . . . . . . . . . . . . . . . . . . . . . . . . . . . . . . .
$173,423,421
Net Assets Consisted of: Shares of beneficial interest at par value . . . . . . . . . . . . . . . . . . . . . . . . . . . . . . . . . . . . . . . . . . . . . Additional paid-in capital . . . . . . . . . . . . . . . . . . . . . . . . . . . . . . . . . . . . . . . . . . . . . . . . . . . . . . . . . Accumulated net investment loss on investments . . . . . . . . . . . . . . . . . . . . . . . . . . . . . . . . . . . . . . Accumulated net realized gain on investments . . . . . . . . . . . . . . . . . . . . . . . . . . . . . . . . . . . . . . . . Net unrealized appreciation on investments . . . . . . . . . . . . . . . . . . . . . . . . . . . . . . . . . . . . . . . . . . Net Assets . . . . . . . . . . . . . . . . . . . . . . . . . . . . . . . . . . . . . . . . . . . . . . . . . . . . . . . . . . . . . . . . . . . . .
See Accompanying Notes to Financial Statements 21
$
114,783 61,738,016 (995,273) 41,158,360 71,407,535
$173,423,421
KALMAR POOLED INVESTMENT TRUST
Statements of Assets And Liabilities — concluded
“GROWTH-WITH-VALUE” SMALL CAP FUND
As of June 30, 2016 (Unaudited)
INVESTOR CLASS Net asset value, offering and redemption price per share ($79,820,406 / 5,299,634 outstanding shares of beneficial interest, $0.01 par value, unlimited authorized shares) . . . . . . . . .
$15.06
INSTITUTIONAL CLASS Net asset value, offering and redemption price per share ($73,009,183 / 4,815,504 outstanding shares of beneficial interest, $0.01 par value, unlimited authorized shares) . . . . . . . . .
$15.16
ADVISOR CLASS Net asset value, offering and redemption price per share ($20,593,832 / 1,363,176 outstanding shares of beneficial interest, $0.01 par value, unlimited authorized shares) . . . . . . . . .
$15.11
* Includes market value of securities on loan of $36,307,938.
See Accompanying Notes to Financial Statements 22
KALMAR POOLED INVESTMENT TRUST
Statement of Operations
“GROWTH-WITH-VALUE” SMALL CAP FUND
For the Six Month Period Ended June 30, 2016 (Unaudited)
Investment Income: Dividends . . . . . . . . . . . . . . . . . . . . . . . . . . . . . . . . . . . . . . . . . . . . . . . . . . . . . . . . . . . . . . . . . . . Securities lending income . . . . . . . . . . . . . . . . . . . . . . . . . . . . . . . . . . . . . . . . . . . . . . . . . . . . . . .
$
181,228 118,145
Total income . . . . . . . . . . . . . . . . . . . . . . . . . . . . . . . . . . . . . . . . . . . . . . . . . . . . . . . . . . . . . . . . .
299,373
Expenses: Advisory fees (Note 6) . . . . . . . . . . . . . . . . . . . . . . . . . . . . . . . . . . . . . . . . . . . . . . . . . . . . . . . . . Shareholder servicing fees, Investor Class (Note 6) . . . . . . . . . . . . . . . . . . . . . . . . . . . . . . . . . . . Shareholder servicing fees, Advisor Class (Note 6) . . . . . . . . . . . . . . . . . . . . . . . . . . . . . . . . . . . Transfer agent fees (Note 6) . . . . . . . . . . . . . . . . . . . . . . . . . . . . . . . . . . . . . . . . . . . . . . . . . . . . . Accounting and administration fees (Note 6) . . . . . . . . . . . . . . . . . . . . . . . . . . . . . . . . . . . . . . . . Trustees’ fees (Note 6) . . . . . . . . . . . . . . . . . . . . . . . . . . . . . . . . . . . . . . . . . . . . . . . . . . . . . . . . . Legal fees . . . . . . . . . . . . . . . . . . . . . . . . . . . . . . . . . . . . . . . . . . . . . . . . . . . . . . . . . . . . . . . . . . . Compliance service fees . . . . . . . . . . . . . . . . . . . . . . . . . . . . . . . . . . . . . . . . . . . . . . . . . . . . . . . . Printing & shareholder report fees . . . . . . . . . . . . . . . . . . . . . . . . . . . . . . . . . . . . . . . . . . . . . . . . Registration fees . . . . . . . . . . . . . . . . . . . . . . . . . . . . . . . . . . . . . . . . . . . . . . . . . . . . . . . . . . . . . . Audit & tax fees . . . . . . . . . . . . . . . . . . . . . . . . . . . . . . . . . . . . . . . . . . . . . . . . . . . . . . . . . . . . . . Custodian fees (Note 6) . . . . . . . . . . . . . . . . . . . . . . . . . . . . . . . . . . . . . . . . . . . . . . . . . . . . . . . . Miscellaneous . . . . . . . . . . . . . . . . . . . . . . . . . . . . . . . . . . . . . . . . . . . . . . . . . . . . . . . . . . . . . . . .
940,420 77,334 11,337 75,632 75,467 57,683 47,204 43,626 26,540 22,104 9,946 9,454 45,474
Total expenses before waivers and reimbursements . . . . . . . . . . . . . . . . . . . . . . . . . . . . . . . . . . Less expenses reimbursed by Investment Adviser (Note 6) . . . . . . . . . . . . . . . . . . . . . . . . . . . . .
1,442,221 (147,575)
Net expenses . . . . . . . . . . . . . . . . . . . . . . . . . . . . . . . . . . . . . . . . . . . . . . . . . . . . . . . . . . . . . . . . .
1,294,646
Net investment loss . . . . . . . . . . . . . . . . . . . . . . . . . . . . . . . . . . . . . . . . . . . . . . . . . . . . . . . . . . . .
(995,273)
Realized and unrealized gain (loss) from investments Net realized gain from investments . . . . . . . . . . . . . . . . . . . . . . . . . . . . . . . . . . . . . . . . . . . . . . . Net change in unrealized depreciation on investments . . . . . . . . . . . . . . . . . . . . . . . . . . . . . . . .
41,189,664 (38,475,712)
Net realized and unrealized gain from investments . . . . . . . . . . . . . . . . . . . . . . . . . . . . . . . . . . . .
2,713,952
Net increase in net assets resulting from operations . . . . . . . . . . . . . . . . . . . . . . . . . . . . . . . . . . .
$ 1,718,679
See Accompanying Notes to Financial Statements 23
KALMAR POOLED INVESTMENT TRUST
Statements of Changes in Net Assets
“GROWTH-WITH-VALUE” SMALL CAP FUND
For the Six Month Period Ended June 30, 2016 (Unaudited)
Increase (Decrease) in Net Assets from Operations: Net investment loss . . . . . . . . . . . . . . . . . . . . . . . . . . . . . . . . . . . . . . . . . . Net realized gain from investments . . . . . . . . . . . . . . . . . . . . . . . . . . . . . Net change in unrealized depreciation on investments . . . . . . . . . . . . . .
$
(995,273) 41,189,664 (38,475,712)
For the Year Ended December 31, 2015
$
(2,262,650) 122,510,978 (142,578,251)
Net increase (decrease) in net assets resulting from operations . . . . . .
1,718,679
(22,329,923)
Distributions to shareholders: From realized capital gains Investor Class . . . . . . . . . . . . . . . . . . . . . . . . . . . . . . . . . . . . . . . . . . . . . . Institutional Class . . . . . . . . . . . . . . . . . . . . . . . . . . . . . . . . . . . . . . . . . . . Advisor Class . . . . . . . . . . . . . . . . . . . . . . . . . . . . . . . . . . . . . . . . . . . . . .
— — —
(26,029,136) (24,835,720) (7,633,739)
Total distributions to shareholders . . . . . . . . . . . . . . . . . . . . . . . . . . . .
—
(58,498,595)
Decrease in net assets derived from capital share transactions
1
.......
(68,247,223)
(407,328,239)
Total decrease in net assets . . . . . . . . . . . . . . . . . . . . . . . . . . . . . . . . . . . . . Net assets: Beginning of Period . . . . . . . . . . . . . . . . . . . . . . . . . . . . . . . . . . . . . . . . .
(66,528,544)
(488,156,757)
239,951,965
728,108,722
End of Period . . . . . . . . . . . . . . . . . . . . . . . . . . . . . . . . . . . . . . . . . . . . . .
$173,423,421
$ 239,951,965
Accumulated net investment loss, end of period . . . . . . . . . . . . . . . . . . .
$
$
1
(995,273)
For details on share transactions by class, see Statement of Changes in Net Assets — Capital Stock Activity on page 24.
See Accompanying Notes to Financial Statements 24
—
KALMAR POOLED INVESTMENT TRUST
Statement of Changes in Net Assets — Capital Stock Activity
“GROWTH-WITH-VALUE” SMALL CAP FUND
For the Six Month Period Ended June 30, 2016 (Unaudited)
For the Year Ended December 31, 2015 Shares Value
Shares
Value
Investor Class Proceeds from Shares issued . . . . . . . Reinvestment of distributions . . . . . . . Redemption fees (Note 5) . . . . . . . . . . Cost of Shares redeemed . . . . . . . . . .
116,902 — — (2,242,338)
$ 1,626,689 — 1,754 (30,818,431)
766,657 1,518,739 — (5,983,850)
$ 15,039,467 22,401,394 7,063 (112,352,784)
Net decrease . . . . . . . . . . . . . . . . . . . . . .
(2,125,436)
$(29,189,988)
(3,698,454)
$ (74,904,860)
Institutional Class Proceeds from Shares issued . . . . . . . Reinvestment of distributions . . . . . . . Redemption fees (Note 5) . . . . . . . . . . Cost of Shares redeemed . . . . . . . . . .
271,037 664 — (2,447,585)
$ 3,686,027 9,846 1,654 (33,712,293)
2,229,302 803,554 — (17,879,794)
$ 44,617,366 11,916,318 9,483 (352,006,086)
Net decrease . . . . . . . . . . . . . . . . . . . . . .
(2,175,884)
$(30,014,766)
(14,846,938)
$(295,462,919)
Advisor Class Proceeds from Shares issued . . . . . . . Reinvestment of distributions . . . . . . . Redemption fees (Note 5) . . . . . . . . . . Cost of Shares redeemed . . . . . . . . . .
139,997 — — (792,698)
$ 1,986,723 — 476 (11,029,668)
158,222 6,566 — (2,041,431)
$
Net decrease . . . . . . . . . . . . . . . . . . . . . .
(652,701)
$ (9,042,469)
(1,876,643)
$ (36,960,460)
Decrease in Net Assets from Capital Share Transactions . . . . . . . . . . . . . . . .
(4,954,021)
$(68,247,223)
(20,422,035)
$(407,328,239)
See Accompanying Notes to Financial Statements 25
2,959,595 97,116 2,180 (40,019,351)
KALMAR POOLED INVESTMENT TRUST
Financial Highlights
“GROWTH-WITH-VALUE” SMALL CAP FUND
The following tables includes selected data for a share outstanding throughout each period and other performance information derived from the financial statements. The total returns in the tables represent the rate an investor would have earned or lost on an investment in the Fund (assuming reinvestment of all dividends and distributions). The information should be read in conjunction with the financial statements and notes thereto.
Investor Class1 Net asset value at beginning of period . .
For the Six-Month Period Ended June 30, 2016 (Unaudited)
$ 14.57
For the Years Ended December 31 2015
$
19.73
2014
$
22.81
2013
$
16.20
2012
$
15.36
2011
$
16.13
Investment Operations Net investment loss . . . . . . . . . . . . . . . . . Net realized and unrealized gain (loss) on investments . . . . . . . . . . . . . . . . . .
(0.08)2
(0.10)2
(0.17)2
(0.16)2
(0.10)
(0.16)
0.57
(1.27)
(1.48)
7.15
2.17
0.25
Total from investment operations . . . . . .
0.49
(1.37)
(1.65)
6.99
2.07
0.09
Distributions From net realized gain on investments . . . . . . . . . . . . . . . . . . . . .
—
(3.79)
(1.43)
(0.38)
(1.23)
(0.86)
Total distributions . . . . . . . . . . . . . . . . . .
—
(3.79)
(1.43)
(0.38)
(1.23)
(0.86)
Net asset value at end of period . . . . . . .
$ 15.06
Total return . . . . . . . . . . . . . . . . . . . . . . . Ratios to average net assets/ Supplemental Data: Expenses to average net assets after waivers and reimbursements . . . . . . . . Expenses to average net assets before waivers and reimbursements4 . . . . . . . Net investment loss to average net assets . . . . . . . . . . . . . . . . . . . . . . . . . . Portfolio turnover rate5 . . . . . . . . . . . . . . Net assets at end of period (000’s omitted) . . . . . . . . . . . . . . . . . . 1 2 3 4 5
* **
$
14.57
$
19.73
$
22.81
$
16.20
$
15.36
3.36%*
(7.16)%
(7.24)%
43.14%3
13.64%
0.50%
1.50%**
1.36%
1.34%
1.29%
1.47%
1.44%
1.62%**
1.36%
1.34%
1.29%
1.47%
1.44%
(1.18)%** 20.22%*
(0.52)% 50.01%
(0.78)% 25.12%
(0.83)% 42.89%
(0.68)% 34.03%
(0.99)% 41.68%
$79,820
$108,152
$219,428
$379,417
$435,402
$331,800
In connection with the adoption of the Multi-Class Plan, the existing shares of the Fund were designated as Investor Class shares effective April 22, 2013. The net investment income per share is based on average shares outstanding for the period. Investor Class performance prior to May 1, 2013 does not reflect a shareholder service fee initiated on that date. During the period, certain fees were waived and/or reimbursed. If such fee waivers and/or reimbursements had not occurred, the ratios would have been as indicated. (See Note 6). Portfolio turnover is calculated at the Fund level. Not Annualized. Annualized.
See Accompanying Notes to Financial Statements 26
KALMAR POOLED INVESTMENT TRUST
Financial Highlights
“GROWTH-WITH-VALUE” SMALL CAP FUND
Institutional Class Net asset value at beginning of period . . . . Investment Operations Net investment loss2 . . . . . . . . . . . . . . . . . . Net realized and unrealized gain (loss) on investments . . . . . . . . . . . . . . . . . . . . . . .
For the Six-Month Period Ended June 30, 2016 (Unaudited)
For the Year Ended December 31, 2015
$ 14.64
$
19.77
For the Year Ended December 31, 2014
$
22.81
For the Period Ended December 31, 20131
$
18.82
(0.07)
(0.07)
(0.13)
(0.10)
0.59
(1.27)
(1.48)
4.47
Total from investment operations . . . . . . .
0.52
(1.34)
(1.61)
4.37
Distributions From net realized gain on investments . . .
—
(3.79)
(1.43)
(0.38)
Total distributions . . . . . . . . . . . . . . . . . . .
—
(3.79)
(1.43)
(0.38)
Net asset value at end of period . . . . . . . . .
$ 15.16
Total return . . . . . . . . . . . . . . . . . . . . . . . . . Ratios to average net assets/ Supplemental Data: Expenses to average net assets after waivers and reimbursements . . . . . . . . . Expenses to average net assets before waivers and reimbursements3 . . . . . . . . . Net investment loss to average net assets . . . . . . . . . . . . . . . . . . . . . . . . . . . Portfolio turnover rate4 . . . . . . . . . . . . . . . . Net assets at end of period (000’s omitted) . . . . . . . . . . . . . . . . . . . . 1 2 3
4
* **
$
14.64
$
19.77
$
22.81
3.55%*
(7.00)%
(7.07)%
1.25%**
1.18%
1.17%
1.22%**
1.44%**
1.18%
1.17%
1.22%**
(0.93)%** 20.22%*
(0.33)% 50.01%
(0.61)% 25.12%
(0.72)%** 42.89%*
$73,009
$102,372
$431,824
23.21%*
$384,551
Institutional Class shares commenced operations on May 15, 2013. The net investment income per share is based on average shares outstanding for the period. During the period, certain fees were waived and/or reimbursed. If such fee waivers and/or reimbursements had not occurred, the ratios would have been as indicated. (See Note 6). Portfolio turnover is calculated at the Fund level. Not Annualized. Annualized.
See Accompanying Notes to Financial Statements 27
KALMAR POOLED INVESTMENT TRUST
Financial Highlights
“GROWTH-WITH-VALUE” SMALL CAP FUND
Advisor Class Net asset value at beginning of period . . . . Investment Operations Net investment loss2 . . . . . . . . . . . . . . . . . . Net realized and unrealized gain (loss) on investments . . . . . . . . . . . . . . . . . . . . . . .
For the Six-Month Period Ended June 30, 2016 (Unaudited)
For the Year Ended December 31, 2015
For the Year Ended December 31, 2014
$ 14.60
$ 19.74
$ 22.81
For the Period Ended December 31, 20131
$
20.08
(0.07)
(0.09)
(0.15)
(0.07)
0.58
(1.26)
(1.49)
3.18
Total from investment operations . . . . . . .
0.51
(1.35)
(1.64)
3.11
Distributions From net realized gain on investments . . .
—
(3.79)
(1.43)
(0.38)
Total distributions . . . . . . . . . . . . . . . . . . .
—
(3.79)
(1.43)
(0.38)
Net asset value at end of period . . . . . . . . .
$ 15.11
Total return . . . . . . . . . . . . . . . . . . . . . . . . . Ratios to average net assets/ Supplemental Data: Expenses to average net assets after waivers and reimbursements . . . . . . . . . Expenses to average net assets before waivers and reimbursements3 . . . . . . . . . Net investment loss to average net assets . . . . . . . . . . . . . . . . . . . . . . . . . . . Portfolio turnover rate4 . . . . . . . . . . . . . . . . Net assets at end of period (000’s omitted) . . . . . . . . . . . . . . . . . . . . 1 2 3
4
* **
$ 14.60
$ 19.74
$
22.81
3.49%*
(7.06)%
(7.20)%
1.35%**
1.28%
1.26%
1.32%**
1.54%**
1.28%
1.26%
1.32%**
(1.03)%** 20.22%*
(0.43)% 50.01%
(0.70)% 25.12%
(0.70)%** 42.89%*
$20,594
$29,428
$76,856
15.48%*
$141,889
Advisor Class shares commenced operations on July 19, 2013. The net investment income per share is based on average shares outstanding for the period. During the period, certain fees were waived and/or reimbursed. If such fee waivers and/or reimbursements had not occurred, the ratios would have been as indicated. (See Note 6). Portfolio turnover is calculated at the Fund level. Not Annualized. Annualized.
See Accompanying Notes to Financial Statements 28
KALMAR POOLED INVESTMENT TRUST
Notes to Financial Statements For the Six Months Ended June 30, 2016 (Unaudited)
“GROWTH-WITH-VALUE” SMALL CAP FUND
1. Organization. The Kalmar “Growth-with-Value” Small Cap Fund (the “Fund”) is a series of Kalmar Pooled Investment Trust (the “Trust”), a Delaware statutory trust organized on September 30, 1996. The Fund is registered under the Investment Company Act of 1940, as amended (the “1940 Act”), as an open-end, diversified management investment company. The investment objective of the Fund is long-term capital appreciation. The Fund commenced investment operations on April 11, 1997. The Fund offers three classes of shares: Investor Class, Institutional Class and Advisor Class shares. Shares of the Fund are offered and sold on a no-load basis, without the imposition of sales charges. The Fund is an investment company that follows the accounting and reporting guidance of Accounting Standards Codification Topic 946 applicable to Investment Companies.
2. Risk Considerations. Market Risk: Because the values of the Fund’s investments will fluctuate with market conditions, so will the value of your investment in the Fund. You could lose money on your investment in the Fund or the Fund could underperform other investments. Counterparty Risk: The Fund may be exposed to counterparty risk, or the risk that an entity with which the Fund has unsettled or open transactions may default. Financial assets, which potentially expose the Fund to credit and counterparty risks, consist principally of investments and cash due from counterparties. The extent of the Fund’s exposure to credit and counterparty risks with respect to these financial assets is approximated by their fair value recorded in the Fund’s Statement of Assets and Liabilities. 3. Security Valuation. A description of the valuation techniques applied to the Fund’s major categories of assets and liabilities measured at fair value on a recurring basis follows: Common stock and exchange-traded funds: Common stock and exchanged-traded funds are valued at their market value as determined by their last sale price in the principal market in which these securities are normally traded. Securities traded on The Nasdaq Stock Market, Inc. (“NASDAQ”) are valued in accordance with the NASDAQ Official Closing Price, which may not be the last sale price. To the extent these securities are actively traded, valuation adjustments are not applied and they are categorized in Level 1 of the fair value hierarchy. Lacking any sales, the security is valued at the mean between the closing asked and bid price. Restricted securities issued by publicly held companies are valued at a discount to similar publicly traded securities and may be categorized as Level 2 of the fair value hierarchy to the extent that the discount is considered to be insignificant to the fair value measurement in its entirety, otherwise they may be categorized as Level 3. Open-end mutual funds: Investments in open-end mutual funds, including money market funds and securities lending collateral, are valued at their closing net asset value each business day and are categorized in Level 1 of the fair value hierarchy. Short-term securities: Short-term investments with remaining maturities of 60 days or less are valued at amortized cost, which approximates fair value, unless the Trust’s Board of Trustees determines that this does not represent fair value. To the extent the inputs are observable and timely, the values would be categorized in Level 2 of the fair value hierarchy. All other securities are valued at fair value as determined in good faith under the direction of the Board of Trustees.
29
KALMAR POOLED INVESTMENT TRUST
Notes to Financial Statements (Unaudited) — continued
“GROWTH-WITH-VALUE” SMALL CAP FUND
Fair Value Measurements. The inputs and valuation techniques used to measure fair value of the Fund’s investments are summarized into three levels as described in the hierarchy below: •
Level 1 — quoted prices in active markets for identical securities
•
Level 2 — prices determined using other significant observable inputs (including quoted prices for similar securities, interest rates, prepayment speeds, credit risk, etc.)
•
Level 3 — prices determined using significant unobservable inputs (including the Fund’s own assumptions in determining the fair value of investments)
The following is a summary of the inputs used, as of June 30, 2016, in valuing the Fund’s assets carried at fair value:
Common Stock* . . . . . . . . . . . . . . . . . . . . . . . . . . . . . . . . . . . Money Market Security . . . . . . . . . . . . . . . . . . . . . . . . . . . . . Securities Lending Collateral . . . . . . . . . . . . . . . . . . . . . . . . .
Total Value at June 30, 2016 $171,937,097 921,519 36,879,825
Level 1 – Quoted Prices $171,937,097 921,519 9,059,746
Level 2 – Other Significant Observable Inputs $ — — 27,820,079
Total . . . . . . . . . . . . . . . . . . . . . . . . . . . . . . . . . . . . . . . .
$209,738,441
$181,918,362
$27,820,079
Level 3 – Significant Unobservable Inputs $ — — — $
—
* Please refer to the Schedule of Investments for industry breakout.
At the end of each calendar quarter, management evaluates the classification of Level 1, 2 and 3 assets and liabilities. Various factors are considered, such as changes in liquidity from the prior reporting period; whether or not a broker is willing to execute at the quoted price; the depth and consistency of prices from third party pricing services; and the existence of contemporaneous, observable trades in the market. Additionally, management evaluates the classification of Level 1 and 2 assets and liabilities on a quarterly basis for changes in listings or delistings on national exchanges. Due to the inherent uncertainty of determining the fair value of investments that do not have a readily available market value, the fair value of the Fund’s investments may fluctuate from period to period. Additionally, the fair value of investments may differ significantly from the values that would have been used had a ready market existed for such investments and may differ materially from the values the Fund may ultimately realize. Further, such investments may be subject to legal and other restrictions on resale or otherwise less liquid than publicly traded securities. For the six-month period ended June 30, 2016, there were no transfers between Levels 1, 2 and 3 for the Fund. Foreign Currency Translation. The books and records of the Fund are maintained in U.S. dollars. Foreign currency amounts are translated into U.S. dollars on the following basis: (i) fair value of investment securities, assets and liabilities at the current rate of exchange; and (ii) purchases and sales of investment securities, income and expenses at the relevant rates of exchange prevailing on the respective dates of such transactions. The Fund does not isolate that portion of gains and losses on investment securities which is due to changes in the foreign exchange rates from that which is due to changes in the market prices of such securities. Foreign security and currency transactions may involve certain
30
KALMAR POOLED INVESTMENT TRUST
Notes to Financial Statements (Unaudited) — continued
“GROWTH-WITH-VALUE” SMALL CAP FUND
considerations and risks not typically associated with those of domestic origin as a result of, among other factors, the possibility of political and economic instability or the level of governmental supervision and regulation of foreign securities markets. Federal Income Taxes. The Fund intends to continue to qualify for treatment as a “regulated investment company” under Subchapter M of the Internal Revenue Code of 1986, as amended (the “Internal Revenue Code”), and to distribute all of its taxable income to its shareholders. Therefore, no Federal income tax provision is required. The amounts of dividends from net investment income and of distributions from net realized gains are determined in accordance with Federal income tax regulations, which may differ from accounting principles generally accepted in the United States (“U.S. GAAP”). These “book/tax” differences are either considered temporary or permanent in nature. To the extent these differences are permanent in nature, such amounts are reclassified within the composition of net assets based on their Federal tax-basis treatment; temporary differences do not require reclassification. As of June 30, 2016, the tax cost and related gross unrealized appreciation and depreciation were as follows: Cost of investments for tax purposes . . . . . . . . . . . . . . . . . . . . . . . . Gross tax unrealized appreciation . . . . . . . . . . . . . . . . . . . . . . . . . . . Gross tax unrealized depreciation . . . . . . . . . . . . . . . . . . . . . . . . . . . Net tax unrealized appreciation on investments . . . . . . . . . . . . . . . .
$138,330,906 73,903,568 (2,496,033) $ 71,407,535
Management has analyzed the Fund’s tax positions taken on federal income tax returns for all open tax years (current and prior three tax years) and has concluded that no provision for federal income tax is required in the Fund’s financial statements. The Fund’s federal and state income and federal excise tax returns for tax years for which the applicable statutes of limitations have not expired are subject to examination by the Internal Revenue Service and state departments of revenue. Use of Estimates in the Preparation of Financial Statements. The preparation of financial statements in conformity with accounting principles generally accepted in the United States requires management to make estimates and assumptions that affect the reported amounts of assets and liabilities and disclosure of contingent assets and liabilities at the date of the financial statements and the reported amounts of revenue and expenses during the reporting period. Actual results could differ from those estimates. Other. Investment security transactions are accounted for on a trade date basis. The Fund uses the specific identification method for determining realized gain or loss on investments for both financial and Federal income tax reporting purposes. Dividend income is recorded on the ex-dividend date. Interest income is recorded on an accrual basis. Securities denominated in currencies other than U.S. dollars are subject to changes in value due to fluctuation in exchange rates. Some countries in which the Fund invests require governmental approval for the repatriation of investment income, capital or the proceeds of sales of securities by foreign investors. In addition, if there is deterioration in a country’s balance of payments for other reasons, a country may impose temporary restrictions on foreign capital remittances abroad.
31
KALMAR POOLED INVESTMENT TRUST
Notes to Financial Statements (Unaudited) — continued
“GROWTH-WITH-VALUE” SMALL CAP FUND
4. Purchases and Sales of Investment Securities. During the six-month period ended June 30, 2016, purchases and sales of investment securities (excluding short-term investments) aggregated as follows: Purchases . . . . . . . . . . . . . . . . . . . . . . . . . . . . . . . . . . . . . . . . . . . . . . Sales . . . . . . . . . . . . . . . . . . . . . . . . . . . . . . . . . . . . . . . . . . . . . . . . .
$ 38,837,656 $122,008,655
5. Redemption Fees. In accordance with the prospectus, the Fund charges a redemption fee of 2% on proceeds from shares redeemed within 30 days following their acquisition. The redemption fee is included as a separate line item under the Share Transactions section on the Statements of Changes in Net Assets. 6. Investment Adviser and Other Services. The Fund employs Kalmar Investment Advisers (“Kalmar” or the “Adviser”) as its investment adviser. Pursuant to an Investment Advisory Agreement with the Trust, as from time to time amended, on behalf of the Fund, the Adviser selects investments and supervises the assets of the Fund in accordance with the investment objective, policies and restrictions of the Fund, subject to the supervision and direction of the Board of Trustees of the Trust. For its services, the Adviser is paid a monthly fee of 1.00% on the first $750 million of average daily net assets; 0.975% on the next $250 million of average daily net assets; and 0.95% on amounts exceeding $1 billion average of daily net assets. For the six-month period ended June 30, 2016, investment advisory fees were $940,420. Kalmar has contractually agreed to the reimbursement of other operating expenses or the waiver of all or a portion of its advisory fee in order to limit “Total Annual Fund Operating Expenses,” excluding extraordinary expenses, brokerage commissions, interest and “Acquired Fund” fees and expenses, to, as a percentage of average daily net assets, 1.50%, 1.25% and 1.35% with respect to the Investor Class, the Institutional Class and the Advisor Class, respectively (the “Expense Limitation”). Kalmar will reimburse expenses attributable to a specific class before waiving its advisory fee or reimbursing other expenses allocated to the Fund as a whole (“Fund-wide expenses”). The Expense Limitation will remain in place until April 30, 2017, unless the Board of Trustees approves its earlier termination. Subject to approval by the Board of Trustees, the Adviser may recoup any expenses reimbursed or fees waived within a three-year period from the year in which the Adviser reimbursed expenses of a Class or the Fund or waived its fees. No recoupment will occur unless expenses of a class or the Fund are below the Expense Limitation. For the six-month period ended June 30, 2016, the Adviser may seek recoupment of previously waived fees and reimbursed expenses of $147,575, expiring December 31, 2019. BNY Mellon Investment Servicing (US) Inc. (“BNY Mellon”), serves as administrator and accounting services agent for the Trust pursuant to an Administration and Accounting Services Agreement with the Trust. BNY Mellon also serves as transfer agent and dividend disbursing agent of the Fund pursuant to a Transfer Agency Services Agreement with the Trust. Foreside Funds Distributors LLC (the “Distributor”), provides principal underwriting services to the Fund pursuant to a Distribution Agreement with the Trust. The Distributor is not affiliated with the Trust, the Adviser, or any other services provided for the Fund. The Bank of New York Mellon, serves as Custodian of the assets of the Fund pursuant to a Custodian Services Agreement with the Trust.
32
KALMAR POOLED INVESTMENT TRUST
Notes to Financial Statements (Unaudited) — continued
“GROWTH-WITH-VALUE” SMALL CAP FUND
The aggregate remuneration paid to the Trustees who are not “interested persons” by the Fund during the six-month period ended June 30, 2016 was $51,527. Trustees of the Fund who are officers or employees of the Adviser are paid by the Adviser and not the Fund. Certain employees of BNY Mellon are officers of the Fund. They are not compensated by the Fund. The Chief Compliance Officer (“CCO”) is an employee of the Adviser. The Fund is responsible for reimbursing the Adviser for a portion of her salary allocated to her duties as the CCO of the Fund. Pursuant to the Shareholder Services Plans adopted by the Trust with respect to the Investor Class and Advisor Class shares of the Fund, the Fund, or the Adviser on behalf of the Fund, may enter into shareholder service agreements with securities broker-dealers and other securities professionals who provide shareholder servicing activities for their clients invested in the Fund. As compensation for shareholder servicing activities, the Fund is authorized to pay a fee of up to 0.25% of the Fund’s average daily net assets of its Investor Class shares and a fee of up to 0.10% of the Fund’s average daily net assets of its Advisor Class shares. 7. Distributions to Shareholders. Distributions of any net investment income and any net realized gains will be made annually. Additional distributions may be made to the extent necessary to avoid the payment of a 4% excise tax. Distributions to shareholders are recorded on the ex-dividend date. The tax character of distributions paid during the last two fiscal years was as follows: Distributions paid from: Long-term capital gains (20% capital gain rate) . . . . . . . . . . . . . . . . . . . . . .
December 31, 2015
December 31, 2014
$122,498,680*
$51,544,056
$122,498,680
$51,544,056
* Includes amounts deemed distributed due to the utilization of accumulated earnings and profits distributed to shareholders upon redemptions of shares.
Distributions from net investment income and short-term capital gains are treated as ordinary income dividends for federal income tax purposes. 8. Components of Distributable Earnings. As of December 31, 2015, the components of distributable earnings on a tax basis were as follows: Undistributed Ordinary Income
Undistributed Long-Term Gains
Unrealized Appreciation
$—
$—
$109,851,943
9. Contractual Obligations. The Fund enters into contracts in the normal course of business that contain a variety of indemnifications. The Fund’s maximum exposure under these arrangements is unknown. However, the Fund has not had prior claims or losses pursuant to these contracts. Management has reviewed the Fund’s existing contracts and expects the risk of loss to be remote.
33
KALMAR POOLED INVESTMENT TRUST
Notes to Financial Statements (Unaudited) — concluded
“GROWTH-WITH-VALUE” SMALL CAP FUND
10. Securities Lending. The Fund may make secured loans of its portfolio securities to brokers, dealers and other financial institutions to earn additional income and receive collateral equal to at least 100% of the current market value of the loaned securities, as marked to market each day that the net asset value of the Fund is determined. The Fund receives securities lending income in the form of fees or by retaining a portion of interest or dividends on the investment of any cash received or collateral. When the collateral falls below specified amounts, the lending agent will use its best effort to obtain additional collateral on the next business day to meet required amounts under the securities lending agreement. The Fund will pay administrative and custodial fees in connection with the loan of securities. Collateral is invested in shortterm investments and the Fund will bear the risk of loss of the invested collateral. Securities lending will expose the Fund to the risk of loss should a borrower default on its obligation to return the borrowed securities. As of June 30, 2016, the market value of the securities on loan and collateral are $36,307,938 and $9,059,746 in cash and $27,820,079 in non-cash collateral pledged at the broker, respectively. Securities lending transactions are entered into by the Fund under a Master Securities Lending Agreement (“MSLA”) which permits the Fund, under certain circumstances including an event of default (such as bankruptcy or insolvency), to offset amounts payable by the Fund to the same counterparty against amounts to be received and create one single net payment due to or from the Fund. The following table is a summary of the Fund’s open securities lending transactions which are subject to a MSLA as of June 30, 2016: Gross Amount Not Offset in the Statement of Assets and Liabilities
Securities Lending 1
Gross Amounts of Recognized Assets
Gross Amounts Offset in the Statement of Assets and Liabilities
Net Amounts of Assets Presented in the Statement of Assets and Liabilities
Financial Instruments1
Cash Collateral Received
Net Amount
$36,307,938
$—
$36,307,938
$36,307,938
$—
$—
Amount disclosed is limited to the amount of assets presented in the Statement of Assets and Liabilities. Actual collateral received may be more than the amount shown.
11. Subsequent Events. Management has evaluated the impact of all subsequent events on the Fund through the date the financial statements were issued, and has determined that there were no subsequent events.
34
KALMAR POOLED INVESTMENT TRUST
Other Matters (Unaudited)
“GROWTH-WITH-VALUE” SMALL CAP FUND
1. Proxy Voting Policies and Procedures. Information regarding how the Fund voted proxies relating to portfolio securities during the most recent 12-month period ended June 30, 2016 and a description of the policies and procedures that the Fund uses to determine how to vote proxies is available without charge, upon request, by calling 800-463-6670, by accessing the Adviser’s website, www.kalmarinvestments.com, or by accessing the SEC’s website at www.sec.gov. 2. Quarterly Portfolio Schedules. The Fund files its complete schedule of portfolio holdings with the SEC for the first and third fiscal quarters of each fiscal year on Form N-Q, which are available on the SEC’s website www.sec.gov. The Fund’s Form N-Q may be reviewed and copied at the SEC’s Public Reference Room in Washington, D.C. and information on the operation of the Public Reference Room may be obtained by calling 1-800-SEC-0330.
35
[THIS PAGE INTENTIONALLY LEFT BLANK]
[THIS PAGE INTENTIONALLY LEFT BLANK]
INVESTMENT ADVISER KALMAR INVESTMENT ADVISERS BARLEY MILL HOUSE 3701 KENNETT PIKE WILMINGTON, DE 19807 (WEBSITE) WWW.KALMARINVESTMENTS.COM
DISTRIBUTOR FORESIDE FUNDS DISTRIBUTORS LLC 400 BERWYN PARK 899 CASSATT ROAD BERWYN, PA 19312
SHAREHOLDER SERVICES BNY MELLON INVESTMENT SERVICING (US) INC. 4400 COMPUTER DRIVE WESTBOROUGH, MA 01581
CUSTODIAN THE BANK OF NEW YORK MELLON ONE WALL STREET NEW YORK, NY 10286
LEGAL COUNSEL PEPPER HAMILTON LLP 3000 TWO LOGAN SQUARE 18TH & ARCH STREETS PHILADELPHIA, PA 19103-2799
INDEPENDENT REGISTERED PUBLIC ACCOUNTING FIRM TAIT, WELLER & BAKER, LLP 1818 MARKET STREET, SUITE 2400 PHILADELPHIA, PA 19103
KALMAR POOLED INVESTMENT TRUST BNY MELLON INVESTMENT SERVICING (US) INC. 4400 COMPUTER DRIVE WESTBOROUGH, MA 01581 (WEBSITE) WWW.KALMARINVESTMENTS.COM
KL12—6/16