In�uences from the European Parliament on EU Emissions Prices Abstract The decisions of the European Parliament (EP) are shown to in�uence both EU emission allowance (EUA) prices and volatility. Reductions in price and increases in volatility are observed when EP decisions are (i) not �partypolitical� in origin, (ii) made during times of low market sentiment, or (iii) made during times of low market attention.
Daily EUA prices from 2007
to 2014 are used in the study, with decisions analysed using an event study approach for price impact, and a GARCH speci�cation for volatility impact. Our �ndings suggest the need for policymakers to improve communication of long-term strategies for the EUA market. This aims to reduce the evident ongoing uncertainty experienced by traders around each decision made by the EP. The �nding that sentiment and market attention at the time of an EP decision in�uences the market's reaction indicates a need to consider market dynamics in terms of decision timing, so that market turbulence is not an unintended by-product of an EP decision. Indeed some form of medium term forward guidance may be called for.
JEL: Q58, G14, C12 Keywords:
EU emission allowances, market sentiment, market attention,
European Parliament
1
1 Introduction In April 2013 the European Parliament was expected to pass a European Commission legislative proposal to �x the recognized oversupply issue in the EU Emissions Trading Scheme (EU ETS) (Koch et al., 2014). mission's proposal
1
The Com-
involved postponing until 2019-2020 the release of 900
million EU emissions allowances (EUAs) - each allowance granting permission to a regulated installation to emit one tonne of CO2 equivalent - that were originally due to be released into the market in 2013-15. The hope of the Commission was that this would support the declining price of allowances already trading in the emissions market and thus act as an incentive towards meeting the overall goals of the EU ETS, namely: encouraging investment in and consumption of cleaner energy production, incentivising more e�cient energy use and production processes, and reducing emissions across the EU. On 16th April 2013, however, the European Parliament narrowly voted against the proposal. There was an immediate impact on EUA prices, which dropped by over a third. The futures price of an EUA permitting the emission of one tonne of
CO2 ,
which had cost A C4.76 at close of business on 15th
April, fell to A C3.09 on 16th April. This is one example where legislation passed by the European Parliament (EP), which holds legislative authority over the EU ETS, impacted on EUA prices. Prior research supports a wider argument that EUA prices are
1 European
Commission Press Release accessed on 9th June 2015 at http://europa.eu/rapid/press-release_MEMO-13-343_en.htm
2
in�uenced by regulatory actions (Daskalakis et al., 2009; Koch et al., 2014; Kossoy and Guigon, 2012). Missing from prior studies though is a systematic investigation of the overall impact of emissions market speci�c and related legislation and resolutions passed by the EP, thus leaving a number of open questions. Do the legislative e�orts of the EP move the EUA market? Are particular types of legislation and resolutions more in�uential? Are there conditional e�ects under which legislation and resolutions have a greater market impact? These are important questions. It is clear from Blyth et al. (2007), Fuss et al. (2008) and Yang et al. (2008) that there is considerable regulatory risk in the EU ETS and the resulting uncertainty in the price of carbon, has major implications for investment decisions in the power sector. Indeed the uncertainty regarding the implementation of measures to combat climate change makes possible the contradictory opinions regarding the existence of 2
a carbon bubble and a projected higher demand for fossil fuels . Our study addresses these issues by tracking 29 relevant decisions made by the EP over Phase II and Phase III (to date) of the EU ETS, and examining how the origin of each decision, the level of market sentiment and the level of market attention all have an in�uence on EUA price behaviour. The decisions made by the EP act, on average, to reduce emission allowance prices.
2 The
Telegraph, The Guardian and Carbon Tracker accessed on 6th June 2015 display di�ering perspectives on the prospect of a carbon bubble. http://www.telegraph.co.uk/�nance/newsbysector/energy/oilandgas/11615079/Shell-CEO-carbon-bubble-campaignersignores-reality.html http://www.theguardian.com/environment/2013/apr/19/carbon-bubble-�nancialcrash-crisis http://www.carbontracker.org/resources/
3
This is quite striking given that the success of the trading scheme requires prices of emission allowances to be at a su�ciently high level so as to act as a disincentive to traditional high emission energy production and energyintensive business practices. We contrast �party-political� decisions brought 3
to the EP by the seven political groups of MEPs , with �non-party-political� decisions brought from other sources. The other sources are the committees of the European Parliament, the European Commission and the European Council; these are o�cial bureaucratic organizations rather the seven political groups of MEPs that respond to voters' concerns. The classi�cation of each decision is carried out by the EP itself.
An example of a non-party-
political decision would be that brought forward by the EP Committee on
th Transport and Tourism on 11 March 2008 concerning the inclusion of airlines in the EU ETS. An example of a party-political decision would be that 4
brought before the parliament by �ve of the political groups on 5
th
June 2008
concerning US emissions and climate change policy. When we analyse resolutions categorised as �non-party-political� and those termed �party-political�, we �nd that it is the non-party-political initiatives which are the particular
3 The
groups of MEPs for the present 8th European Parliament are, the European People's Party (EPP), the Progressive Alliance of Socialists and Democrats (S&D) containing the Party of European Socialists (PES), the Alliance of Liberals and Democrats for Europe (ALDE), the European Conservatives and Reformists, the European United Left � Nordic Green Left, the Greens / European Free Alliance (Greens-EFA) or the Europe of Freedom and Direct Democracy. Accessed on 6th June 2015 at http://www.europarl.europa.eu/aboutparliament/en/20150201PVL00010/Organisation 4 The groups were EPP, PES, ALDE, Greens-EFA and the UEN.The Union for Europe of the Nations (UEN) was an active political group in the European Parliament from 1999 to 2009.
4
drivers of these negative returns. We also �nd there is heightened volatility around key legislative decision dates when we incorporate this information in an appropriately designed GARCH volatility model, indicating that market uncertainty is a feature of prices around these dates. It may be the case that some form of
forward guidance
such as is used by central banks, would be
bene�cial in communicating, in advance, the nature of complex legislative decisions to the market . This action might reduce volatility in the market, as has been found to be the case by Campbell et al. (2012) and Kool and Thornton (2012) who analyse the macroeconomic e�ects of Federal Reserve forward guidance.
5
The main challenge though with this policy solution is
that the EP is subject to many competing in�uences, and does not have the independence and targeted focus of a central bank. A possible explanation for the strong e�ect of EP decisions on EUA prices during times of low media exposure can be found in the Investor Attention Hypothesis (Barber and Odean, 2008; Da et al., 2011; Hirshleifer et al. 2009, 2013; Vozlyublennaia, 2014). In an equity context this proposes that since attention is a limited resource, investors will make decisions about �rms to which their attention has �rst been drawn, and that until their attention is drawn to a stock its price will only slowly re�ect new information due to lack of trading interest. We draw on this line of argument and adopt the theory for emissions markets. The amount of attention given to emissions trading is normally small as it is only a very small part of the energy market. To
5 The
authors would like to thank an anonymous referee for this helpful comment.
5
illustrate this point from 2010 to 2014 the value of the trades of the most liquid EUA futures contracts (prompt December) was 0.88% of the value of trades of the most liquid futures contracts of Brent oil (prompt month); in 2012 the value of the trades in EUAs was $73 billion while the total value 6
of the world's oil production that year was $3.27 trillion . When attention is focused on emissions by the media or by the actions of MEPs, the market in turn pays attention and anticipates the decisions made by the European Parliament. When the European Parliament makes decisions about the emissions market when there is low media coverage or when the decision arises from non-party-political sources within the EU (namely, the European Parliament committees, the European Commission or the European Council), then market inattention will lead to a lagged corrective price adjustment and increase in volatility. We also test for di�erences in behaviour when sentiment is relatively high compared with times when it is low. We �nd that EP decisions made when sentiment is low have a negative impact on returns and are associated with an increase in volatility. The impact on returns is determined by an event study which shows that on days on which the EP makes a decision there are, on average, signi�cant negative returns, and these negative returns become cumulatively greater in the following week.
6 Data
An explanation for the cumu-
from Bloomberg, EU ETS Factsheet at http://ec.europa.eu/clima/publications/docs/factsheet_ets_en.pdf, and the Energy Information Administration EIA at http://www.eia.gov/ all accessed on 9th June 2015
6
lative reduction in prices is that this may be similar to the post earnings announcement drift (Bernard and Thomas, 1989; Hirshleifer et al., 2009). After an earnings announcement it is common to �nd that the price of the stock continues moving in the same direction due to a lack of investor attention. This e�ect is more pronounced when news a�ecting the price of the stock is di�cult to interpret (Song and Schwarz, 2010). We �nd that there is a similar continued movement of EUA prices after the announcement of an EP regulatory decision. We posit that this is due to similar investor inattention in the emissions markets. The implications of many of these decisions are more di�cult to interpret than straightforward messages like earnings announcements and so the e�ect is extended. This o�ers an explanation for the continued slow movement of prices after an EP announcement.. This study is similar in intent to a recent investigation by Lin and Tamvakis (2010) which examined the impact of OPEC output decisions on crude oil prices.
Based on an argument, in part, that OPEC had the ability to
a�ect the volume of oil produced and was thus a major actor in the market, a systematic investigation was carried out of each OPEC meeting where a quota decision was made. In the case of the EUA market the major player, the EP, has even greater power as it can alter the structure of the market's operation, a�ect supply through adjusting allowances available in the market, and even boost demand through an ability to determine which institutions must partake in the scheme. This suggests a need to formally investigate the in�uence of the EP on the prices at which EUAs trade in the market.
7
In a further contribution, extending work done independently by Koch et al. (2014), we examine the potential conditional determinants of market reaction to EP legislation. In particular we develop innovative measures of market sentiment and market attention, which are known in other markets to in�uence reaction to new information.
An emissions market sentiment
index is constructed by adapting the principal component analysis approach of Baker and Wurgler (2006) in equity markets, and particularly based on the oil sentiment index proposed in Deeney et al. (2015). The components of this index draw on volatility and speculative measures from the EUA market, while also drawing pertinent information from the wider energy markets, and wider �nancial markets. Sentiment has been found to be a signi�cant in�uence in equities markets (e.g. Baker and Wurgler, 2006; Schmeling, 2009) and more recently in the energy and commodity markets (Deeney et al., 2015; Sliverio and Szklo, 2012).
Sentiment has been found to be particularly e�ective at predicting
the prices of stocks with greater inherent uncertainty; these have been characterized by Baker and Wurgler (2006) as being young, small, unpro�table, non-dividend-paying, with high volatility, capable of extreme growth or becoming distressed.
It can be argued that the European emissions market
contains some of these same characteristics, albeit from di�erent sources. For example, there is the already discussed dependency on uncertain political events; a history of extreme movements (Koch et al., 2014); and strong crossover in�uences and volatilities from other energy markets (Bredin and
8
Muckley, 2011; Chevallier, 2011; Mansanet-Bataller, 2011). The sentiment state of market participants at the time that new information arrives is also known to be important. Mian and Sankaraguruswamy (2012) show that sentiment mediates how investors react to news, with high sentiment periods related to a positive reaction to news and the opposite for low sentiment periods. Investors tend to choose good news to focus on in high sentiment times and bad news to focus on in times of low sentiment. We thus expect that whether the market is in a time of high or low sentiment will mediate the reaction of prices to new legislation. Fang and Peress (2009) show that news exposure has an in�uence on the returns of stocks in the US market. We thus construct a market attention variable based on news stories about the EUA market and emissions trading.
We propose this variable as measuring market attention.
We argue
that market attention both informs market participants (Tetlock, 2007) and is informed by market participants (Oberlechner and Hocking, 2004), and therefore acts as a guide to the level of market interest in upcoming news events. Following from this, we �nd that low market attention of issues relevant to the EU ETS in advance of a legislative decision is associated with greater �price shock�, and we �nd there is a signi�cant cumulative negative price reaction in the days after a low market attention decision. The methodology is detailed in Section 2, followed by the �ndings and analysis in Section 3, and we conclude with further discussion of the implications for policy makers and market participants in Section 4. Our policy
9
implications centre on the general importance of understanding the reaction of market participants to legislative decisions and the need to improve communication with market participants as to the long-term policy goals for the EUA market and greater signposting of the intermediate steps that will be adopted to achieve these goals. There also needs to be greater understanding of the factors a�ecting the market at a given point in time, as shown particularly by the sentiment and media coverage �ndings. This conditional understanding is argued to be of potential bene�t to policy makers across a variety of regulated markets.
2 Methodology Prior research suggests that EUA prices are in�uenced by regulatory actions (Daskalakis and Markellos, 2009; Koch et al., 2014; Kossoy and Guigon, 2012). We add to prior studies by a systematic investigation of the overall impact of emissions market speci�c and related legislation passed by the EP. We contribute to the existing literature on the EU ETS by testing whether policy decisions of the EP in�uence the price and volatility of EUAs.
We
provide a distinction by means of examining whether there is a di�erential e�ect to the impact of EP policy decisions depending on: (i) the origin of EP policy decisions, i.e. whether non-party-political or party-political; (ii) the level of market sentiment (high or low); and (iii) the level of market attention (high or low) which we measure in terms of emissions market news exposure.
10
The origin of EP policy decisions in�uences the impact of those decisions on the price and volatility of emission allowance prices. The EP itself classi�es the origin of each decision. We divide these into �non-party-political� resolutions brought by a combination of the parliament's own committees, the European Council and the European Commission, and �party-political� resolutions brought by a combination of the political groups in the parliament. A full explanation is given in Section 2.2. This allows us to understand which sources of legislation and which parts of the European political system have the greatest impact on emissions markets. The investigation based on market sentiment provides policy makers with insights into the timing of policy decisions and to what extent the prevailing market dynamics impact. For this analysis, we uniquely develop an EUA market sentiment index based on �nancial proxy information relating to the emissions market and the wider energy markets, and wider �nancial markets. A decision is considered to be high sentiment if it takes place on a day on which the market sentiment index is higher than the median sentiment for all the decision dates under consideration. Construction of the market sentiment index follows the method of Baker and Wurgler (2006) - a detailed explanation is given in Section 2.3. Finally, the analysis based on emission market attention provides insights again into the the timing of policy decisions and to what extent the level of market attention to climate change and emissions issues impacts. The analysis allows us to consider how the level of public awareness of these issues
11
in�uences the tendency of MEPs to vote in a way which the market expects. This has implications for policy makers who simultaneously must plan to avoid damage to the environment, give clear signals to the market and must attempt to carry out the wishes of their electorate.
A policy decision is
considered to be high news if its news exposure measure is higher than the median for all the decision dates under consideration.
The news exposure
measure is based on Fang and Peress (2009) and is detailed in section 2.4. We use event study and GARCH methods to test changes in the price returns and volatility at the times of EP decisions, following Lin and Tamvakis (2010) and Lu and Chen (2011). The remainder of this section is organized as follows. We �rstly describe the EUA price data considered for our analysis, and then, to support the objectives above, we describe the method used to identify the dates for the EP policy decisions and how these break down as either party-political or non-party-political. The method used to build an appropriate market sentiment index for the emissions and energy markets is then given, followed by the method used to measure market attention. Finally, the testing speci�cations for the price-based event study and the GARCH-based volatility analysis are provided.
2.1 EUA Prices We use the prices of prompt December futures in our anlaysis; these are the futures contracts with an expiry of the next December. A futures contract for a commodity, such as an emission allowance, is an agreement to buy or
12
sell an agreed quantity of that commodity at a speci�c time in future. The contract may be settled in cash rather than in delivery of the commodity itself. These contracts are traded in much higher volumes than EUAs on the spot market (Zhu et al., 2015), while also being the most liquid of the futures contracts available. Futures contracts for Phase II (2008 - 2012) and Phase III (2013 - 2020) allowances are examined using daily data beginning on 2nd October 2007 and ending on 5th February 2014. Phase I allowances (2005 2007) are not examined as they were not permitted to be used after Phase I �nished in 2007, whereas Phase II allowances could be banked and used during Phase III. The data before 1st January 2008 refers to the December
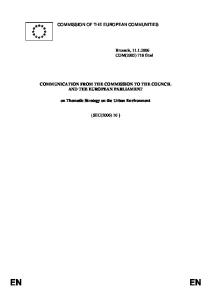
descriptive statistics for the log returns of the prompt December EUA futures contract over the sample period and Fig. 1 shows the time series. A discussion of the outlier on 16th April 2013 follows at the end of section 2.2. 2008 futures contract. Table 1 presents
�>
2.2 EP Policy Decision Selection and Classi�cation The overall objective of our study is to test what impact policy decisions of the EP have on the level of EUA prices and their volatility.
Therefore,
identifying the dates of EP policy decisions relating to the EU ETS is fundamental to our objective. During the course of legislation making its way through the EP, there are many stages before the date of the actual decision,
13
Statistic Log Return EUA # daily observations 1,625 min -0.43208 max 0.24525 mean -0.000815 median 0.00000 standard deviation 0.03294 skewness -0.90640 excess kurtosis 23.305 5% percentile -0.051038 95% percentile 0.045303 ADF (p value) 4.84 x 10⁻²⁴ Jaque Beara (p value) 0.00000 The table presents descriptive statistics for the log returns of the prompt December EUA futures contract from 3rd October 2007 to 5th February 2014. Table 1: Descriptive statistics of EUA futures returns
Figure 1:
14
including debates in the council, votes by relevant committees, and debates in the parliament. We select the �Decision by Parliament� date for each policy decision as given in the European Parliament Legislative Observatory.
7
This source provides a list of key stages of a resolution as it makes its way through the EP and gives the origin of each resolution. The EP itself classi�es resolutions brought to it. Thus we may objectively distinguish resolutions originating from the political groups of the MEPs (which we term �party-political�), from resolutions brought by the EP's committees, the European Council, or the European Commission (termed by us as �non-party-political�). To �nd all the relevant decisions, we search for the terms: �EU ETS�, �emissions trading� and �carbon trading� in the European Parliament Legislative Observatory. We do not use the term �climate change� as this was found to be too broad and would have found EP policy decisions which concern climate change mitigation, adaptation and other matters only loosely related to the EU ETS. A list of the dates and classi�cations of the EP decisions, obtained from our search, is given in Tables 2 and 3, along with brief explanations of their connection and potential in�uence on the EU ETS. Thirty seven policy decisions were identi�ed over our sample period of 2nd October 2007 to 5th February 2014. In order to ensure a reasonable period for the calculation of the parameters needed in the event study described in Section 2.5.1, we choose 20 days for the length of the estimation
7 Accessed
on 20th ropa.eu/oeil/home/home.do.
November
15
2014
at
http://www.europarl.eu-
window and �ve days on either side of the event day as the event window. This is shorter than similar studies such as Lin and Tamvakis (2010), but we must compromise between having a reasonable number of events and adequate lengths for each of the estimation and event windows. Having chosen a 20 day estimation window and �ve days on either side of the event as the event window we are compelled to omit 8 of the 37 identi�ed events. This is because we cannot have an event occurring in the estimation window of another event as the estimation window is used to calculate the parameters of normal behaviour. This means that two events must be closer than 5 days apart or farther than 25 days, therefore we chose 29 of the 37 events. It can be seen that there are 10 events classi�ed as party-political, with 19 events classi�ed as being non-party-political.
A list of the EP decisions and the
totals for each category are found in Tables 2, 3 and 5. The 16th April 2013 requires special consideration for the reasons outlined in the introduction.
On this date there was a very close vote of the EP
rejecting backloading.
8
As noted earlier, backloading was the proposal to
delay the release of 900 million EUAs until 2019-2020, which were originally due to be released into the market in 2013-15. On this date the price of EUAs fell from A C4.76 to A C3.09 on the futures market, a collapse of approximately 35%. This was the largest percentage drop in a single day observed in the
8 On
the same day there was also a resolution to delay the imposition of penalties arising from the failure of aircraft operators to abide by an earlier directive on emissions, but this would not have had the same importance as the rejection of backloading as it a�ects penalties applied in one sector of the market and whereas backloading is looking to address on a system-wide basis the recognized oversupply of allowances in the market.
16
EUA futures market. This can be clearly seen in the EUA log returns series provided in Figure 1. The EP backloading rejection date may therefore be deemed an extreme event. While this anecdotally illustrates the ability of an EP decision to move EUA prices, it presents the problem that inclusion of this one day's data may drive the conclusions on its own. For robustness, we therefore conduct our statistical analysis with and without the inclusion of 16th April 2013 - which we will herein refer to as the backloading rejection date - for both the event study and the GARCH analyses.
2.3 Measurement of Market Sentiment The second important question in our analysis, as earlier set out, is whether the impact of policy decisions depends in any way on the level of market sentiment. Towards answering this question, we uniquely develop an emissions market sentiment index following a similar index constructed for the oil markets in Deeney et al. (2015). For our purposes, we use �nancial proxy information relating to the emissions markets and wider energy markets, and wider �nancial markets. A decision of the EP is characterized as being high sentiment if it occurs on a day when the market sentiment index is above the median for the set of decisions under consideration. A daily market sentiment index is constructed for the emissions market using principal component analysis (PCA) of appropriately chosen �nancial proxies, in line with Baker and Wurgler (2006), Lemmon and Portniaguina (2006), and Deeney et al. (2015). This approach
17
Date
Classi�cation
Category
Sentiment
News
Relevance of Decision
11/10/2007
INI
EP-led
High
High
Support for EU ETS to include air transport
11/03/2008
INI
EP-led
High
Low
Air transport to be included in EU ETS
24/04/2008
INI, RSP
TOP
High
High
Increasing the ambit of the EU ETS and support for the poluter pays principle
05/06/2008
RSP
TOP
High
High
08/07/2008
COD
EP-led
High
High
09/07/2008
INI
EP-led
High
High
Expresses hope that US will trade emissions with EU ETS Air transport to be included in EU ETS Support for low carbon energy e�cient technologies
04/09/2008
INI
EP-led
High
Low
21/10/2008
INI
EP-led
High
High
Policy to curb CO2 emissions Commitment to Global Climate Change Alliance and plans for spending EU ETS income.
17/12/2008
COD
EP-led
High
High
Resolution to extend EU ETS to include maritime, shipping and aviation
03/02/2009
INI
EP-led
High
Low
Second strategic energy review aiming to reduce GHG by 80% by 2050
11/03/2009
RSP
TOP
High
High
Resolution on an EU strategy for a comprehensive climate change agreement in Copenhagen and the adequate provision of �nancing for climate change policy
23/04/2009
RSP
TOP
High
High
Proposal of a Global Forest Carbon Mechanism and committements to spend EU ETS income
22/10/2009
RSP
TOP
Low
High
Resolution on the upcoming EU-US Summit calling for stronger cooperation in energy e�ciency and bio-fuels.
25/11/2009
RSP
TOP
Low
High
Resolution on the EU strategy for the Copenhagen Conference on Climate Change (COP 15)
The table shows the European Parliament (EP) decisions under consideration from 2007 to 2009. Decisions are either less than 5 trading days or more than 25 days apart. The classi�cations are assigned by the EP itself and indicate the following types of decisions: resolution on topical subjects (RSP, 10), own initiative procedure (INI, 11), ordinary legislative procedure (COD, 6) and consultation procedure directive (CNS, 1).
We categorize RSP as topical and denote it �TOP� and categorize all other decisions as �EP-led�.
Two decisions were taken on 24th April 2008 and since a topical decisions was taken this date has been categorized as topical. Decisions for 2010 - 2013 are in Tab.3.
Table 2: List of selected Dates of European Parliament Decisions 2007 - 2009 18
Date
Classi�cation
Category
Sentiment
News
11/03/2010
RSP
TOP
Low
Low
Decision Commitment to meet GHG targets and the use of the European Investment Bank to support low carbon targets
06/05/2010
INI
EP-led
Low
Low
Adapting to climate change: towards a European framework for action. Possible changes of electricity generation using renewable and fossil fuels.
17/06/2010
RSP
TOP
Low
Low
Resolution on the EU-US disagreement on air transport in EU ETS
25/11/2010
INI
EP-led
Low
High
08/03/2011
INI
EP-led
Low
Low
05/07/2011
INI
EP-led
Low
Low
Inclusion of maritime transport in the EU ETS Financial Transaction Tax and strengthening of EU ETS Options to move beyond 20% GHG emission reductions and assessing the risk of carbon leakage
14/09/2011
COD
EP-led
Low
Low
Wholesale energy market integrity and transparency
17/11/2011
RSP
TOP
Low
Low
Resolution on the EU-US disagreement on air transport inclusion in EU ETS
15/03/2012
INI
EP-led
Low
Low
Roadmap for moving to a competitive low carbon economy in 2050
19/04/2012
CNS
EP-led
Low
Low
22/11/2012
RSP
TOP
Low
Low
12/03/2013
COD
EP-led
Low
Low
Proposal to tax electricity generation using GHG output as one component Resolution on the Climate Change Conference in Doha, Qatar Greenhouse gas emissions, climate change: mechanism for monitoring and reporting
16/04/2013
COD
EP-led
Low
Low
* (Backloading rejected) Scheme for greenhouse gas emission allowance trading: temporary derogation from the EU ETS
23/10/2013
RSP
TOP
Low
Low
10/12/2013
COD
EP-led
Low
Low
Resolution on the climate change conference in Warsaw, Poland (COP 19) Greenhouse gas emission allowance trading: timing of auctions
The table shows the European Parliament (EP) decisions 19 from 2010 to 2013. For an explanation of the EP
classi�cation of decisions see Table 2. The decision * on 16th April 2013, the backloading rejection day, caused the largest drop in EUA prices during the period of the investigation. The EP narrowly rejected a plan to delay the release of EUAs known as backloading. All statistical tests were repeated omitting this date so as to ensure the robust nature of our conclusions.
Table 3: List of selected Dates of European Parliament Decisions 2010 - 2014
has most popularly been applied to the equities markets, where there are abundant data available and levels of market liquidity are for the most part high. By contrast, in the emissions market liquidity is lower, with the volume of options traded for instance being particularly low. This makes the use of emissions market speci�c �nancial information less reliable on a stand-alone basis than we would desire.
To overcome this weakness, we construct an
index which includes additional �nancial information from the wider energy markets not just the emissions market. This aligns with Bredin and Muckley (2011), Chevallier (2011), and Mansanet-Bataler et al. (2011), who �nd the emissions market to be intrinsically linked with the energy markets. We choose the coal and gas markets because they have an established connection to the prices of EUAs, as shown by Alberola et al. (2008) and Chevallier (2011). For coal prices, we use the API2 grade for Amsterdam-RotterdamAntwerp (ARA) prompt month futures contract, following Chevallier (2011). For gas prices, we use the UK's National Balance Point (NBP) prompt month futures price, following Creti et al. (2012) and Aatola et al. (2013). For oil prices, we use the benchmark Brent prompt month futures contract, providing us with a key oil market indicator and proxy measure of economic activity (Zhu et al., 2015).
To capture a measure of �market fear� in the
European economy, we use the implied volatility index associated with the FTSE index, termed VFTSE. This follows Whaley (2000) who associates index volatility and market fear. (As a robustness check the sentiment index calculations were repeated using the Euro Stoxx 50's volatility index instead
20
of the VFTSE. The classi�cation of the 29 days was identical.) The speci�c �nancial proxies used in the construction of the market sentiment index comprise volume, open interest and volatility measures and are as follows:
1. The volume of trades of the prompt December EUA futures contract
2. The aggregate total of all EUA futures contracts of all expiry dates excluding the prompt December contract
3. The 20-day volatility of the prompt December EUA futures contract
4. The 20-day volatility of the prompt month Brent crude oil futures contract
5. The 20-day volatility of the prompt month NBP natural gas futures contract
6. The 20-day volatility of the prompt month ARA coal futures contract
7. The open interest of Brent crude oil futures contracts
8. The open interest of NBP natural gas futures contracts
9. The implied volatility of the FTSE index, i.e. VFTSE
For our �rst two proxies we use the volume of EUA futures contracts. Baker and Stein (2004), Baker and Wurgler (2007), Canbas and Kandir (2009) and Scheinkman and Xiong (2003) use the volume of trades as a proxy for investor
21
sentiment across equity markets. The volume of trades is a natural measure of market activity and as shown by this literature it is also an indicator of market sentiment. The volatility of futures prices is also a recognized indicator of market sentiment (Whaley, 2000) as it indicates rapid changes in price.
For our
analysis we calculate twenty-day historical volatility for emissions, oil, gas and coal futures prices; a period of 20 trading days corresponds approximately to one calendar month.
The twenty-day time frame is chosen as a
reasonable balance between a su�ciently long period for the accurate calculation of volatility and a short enough period for the volatility information to be current, this choice follows the monthly time scale used by Baker and Wurgler (2006) in their seminal paper on sentiment indices. The level of open interest of futures contracts is an indicator of the level of speculation and market activity in the oil and gas markets. It is the quantity of futures contracts which are not closed, liquidated or delivered.
Open
interest data for coal and EUA futures was not available for the period under examination and so we include just information from the oil and natural gas markets. The volatility of a large stock index has commonly been used as a measure of market fear in the literature.
Simon and Wiggins (2001), Whaley
(2000) and Whaley (2009) have used the VIX implied volatility index as a proxy of market sentiment, speci�cally fear. The VFTSE is used here as a European equivalent to the US-centred VIX. The VFTSE is calculated from
22
the implied volatility of FTSE 100 index options covering out-of-the-money strike prices for the near and next term maturities.
An alternative choice
would be the volatility of the Euro Stoxx 50 but the VFTSE is chosen as the FTSE 100 has a greater weighting of large energy �rms (including BG Group, BP, Petrofac, Royal Dutch Shell, Tullow Oil and Wood Group) with a total market capitalization of Stg¿286 billion (389 billion) compared with the Euro Stoxx 50 (including ENI, Repsol and Total ) which have a total market 9
capitalization of 194 billion . This is shown to be a robust choice because when the sentiment index calculations were repeated using the volatility of the Euro Stoxx 50 (V2X) the new sentiment index produced the same categorization of high or low sentiment for each of the 29 EP decisions. The Euro Stoxx 50 is the index of the top 50 �rms of the Euro zone by capitalization, its volatility index is calculated similarly to the VFTSE. The two are very highly correlated and so it is not surprising that the substitution of the V2X and VFTSE did not change the designation of high and low sentiment. To take into account the possibility that some of the proxies may be more strongly leading indicators of market sentiment than others, we follow the method of Baker and Wurgler (2006). A �rst stage index
Ft
is prepared by
entering the current values of the nine proxies and their �rst lags in a principal component analysis (PCA). The �rst principal component of this PCA of
9 Data
accessed on 9th June 2015 from http://www.londonstockexchange.com/exchange/prices-and-markets/stocks/indices/summary/summary-indicesconstituents.html?index=UKX , and http://www.londonstockexchange.com/exchange/prices-and-markets/internationalmarkets/indices/home/eurostoxx-50.html
23
Energy and Emissions Sentiment Index Current or First Lag Loading Volume of Prompt Dec EUA Futures
Lag
-0.36
Volume of non Prompt Dec EUA Futures
Current
-0.40
20 Day EUA Volatility
Current
-0.17
20 Day Brent Oil Volatility
Current
0.38
20 Day NBP Gas Volatility
Lag
0.32
20 Day ARA Coal Volatility
Lag
0.35
Open Interest of Brent Futures
Current
-0.26
Open Interest of NBP Futures
Lag
-0.32
Volatility of the FTSE
Lag
0.38
The table shows the choices of current or �rst lag of the listed �nancial proxies and the PCA-derived weights for the linear combination of these proxies to produce the emissions and energy market sentiment index. The �rst principal component explains 27% of the variance. Table 4: Loadings for the emissions and energy market sentiment index
the 18 series is the �rst stage index,
Ft
. For each individual proxy Pt the
correlation between the current value and the �rst stage index, Corr(Pt ,Ft ), and the correlation between its �rst lag and the �rst stage index Corr(Pt−1 ,Ft ) are calculated.
For each individual proxy the larger of these two values
determines whether to use the current or �rst lag for each proxy; these are entered into a second PCA which produces the sentiment index as its �rst principal component.
2.4 Measurement of Media Coverage For the third part of our analysis, we consider to what extent the level of market attention on issues pertinent to the emissions market at the time of policy decisions impacts on price and volatility. Fang and Peress (2009) show
24
that news exposure has an in�uence on the returns of stocks in the US market. This is in line with the Investor Attention Hypothesis (Barber and Odean, 2008; Da et al., 2011; Vozlyublennaia, 2014) which posits that since attention is a scarce commodity, that investors are more likely to trade stocks to which their attention has already been drawn.
Motivated by this work, we thus
construct a media exposure variable based on news stories about the EUA market and emissions trading, a variable we propose as measuring �market attention�. Media coverage both informs market participants (Tetlock, 2007) and is informed by market participants (Oberlechner and Hocking, 2004), and therefore acts as a guide to the level of market interest in upcoming news events. A policy decision of the EP is categorized as being of high news importance if the news exposure on the day of the decision is above the median for the set of decisions under consideration. Fang and Peress (2009) de�ned the news exposure of a particular stock as a count of stories which appeared in either the Dow Jones Newswire service, or in any of four US newspapers: The New York Times, USA Today, The Wall Street Journal or The Washington Post (which together accounted for 11% of daily circulation of newspapers in US at that time). Motivated by this approach, we consider the following sources of news: the news wire services Agence France Presse (APF), The Associated Press (AP), Thomson Reuters ONE and Thomson Reuters Financial News Super Focus; and the UK broadsheets The Daily Telegraph, The Financial Times, The Times, The Independent and The Guardian (which
25
account for 18% of daily circulation of newspapers in the UK
10
). The list of
broadsheets is taken from Lexis Nexis and excludes Sunday papers as these would give a biased result for that one day of the week which is not a trading day. We search the Lexis Nexis database for the following terms: �EU ETS�, �climate change�, �carbon emission�, and �CO2�. When the search term �EU ETS� was used on its own very low counts were made so that such data was too sparse, hence a wider selection of search terms were used. For an article to be counted at least one of these four search terms must have occurred three times in the article. This provides an objective way to ensure that the article is actually about the EU emissions market and not merely referring to it while discussing other emissions related topics, such as the Chinese emissions trading schemes for instance.
We therefore de�ne the following
time series:
N ewspapert =
the number of stories on day
t
in any of the newspapers
listed, with each story containing at least three occurrences of at least one of the search terms listed;
N ewsW iret =
the number of stories on day
t
in any of the news wires
listed, with each story containing at least three occurrences of at least one of the search terms listed. In order to measure the e�ect of the media on EP decisions, we construct
10 Source:
Audit Bureau Circulations (ABC). Site accessed on 2nd February 2015 at http://www.abc.org.uk/
26
Origin Topical (TOP)
10
European Parliament Led (EP- led)
19
Sentiment High
14
Low
15
News Exposure High
13
Low
16
The table records the number of decisions of the European Parliament in each of the categories tested. Table 5:
Distribution of the decisions across origin, sentiment and news
exposure
a time series which captures the level of coverage of the EU ETS and related issues over the previous three days. We therefore de�ne
N ewst
for the time
period under consideration as follows
N ewst =
t−1 X
(N ewspaperi + N ewswirei ) , t = 4, 5, .., 1626
i=t−3 This time series is calculated and the median for the 29 days under consideration is calculated. High news coverage is considered to happen on days when the news is higher than the median. To summarise the classi�cation set out in this section and that of Sections 2.3 and 2.4, Table 5 provides a breakdown of the 29 events dates by origin, sentiment and news exposure.
27
2.5 Testing Methodology In this section we set out the technical details of the event study employed to examine price e�ects and follow this with the speci�cation of the GARCH modelling used to examine volatility e�ects.
2.5.1 Event Study Speci�cation Following the method of Kothari and Warner (2007), MacKinlay (1997) and, Lin and Tamvakis (2010) we use an event study on the 29 identi�ed dates of EP policy decisions. In addition to this, we perform separate event studies using the categorizations based on (i) the EP policy decision origin, (ii) the level of market sentiment and (iii) the level of news market attention. An event study is chosen as it is ideally suited to test for the presence of changes in the mean of time series where the date of the change is known approximately. It will allow us to see when the event is re�ected by a change in the mean log returns. We use an estimation window of 20 days and an event window of 11 days, comprising the 5 days before the event, the event day itself and the 5 days after the event. Lin and Tamvakis (2010) used lengths of 40 days for the estimation window and 20 days for the event window to examine quarterly OPEC meetings. Here we retain the approximate ratio of 2:1 for the estimation window and event window lengths by choosing a 20 day estimation window and 11 day event window. There is an inherent limitation of an investigation of EP decisions, as they do not occur at a constant frequency. The selection
28
for the estimation and event window lengths are chosen as a compromise between obtaining a reasonably accurate estimation for the parameters for normal behaviour away from events (during the estimation window periods), keeping the event window short to detect events more e�ectively (Kothari and Warner, 2007) and selecting a reasonably large number of decisions to test. At the same time it is necessary to keep an event window long enough to test for price movements before EP decisions (possibly due to information leakage) and the possibility of price movements after the event day itself. Akin to the phenomenon of post earnings announcement drift (Hirshleifer et al., 2009) the e�ect of an EP decision on EUA prices may not end on the day of the decision itself, but may continue for a short period after. Therefore we select 11 days in keeping with the ratio of Lin and Tamvakis (2010). Setting longer periods for the estimation window will improve the accuracy of the parameter estimates for the statistical testing (Kothari and Warner, 2007) however in this application the cost of this increased accuracy is the loss of the number of EP decisions which can be analysed. The abnormal returns are calculated as the di�erence between the day's return and the expected return using two models of normal behaviour: a zero log return model; and a constant rate of return model.
MacKinlay
(1997) states that although a constant return model is a very simple, it is surprisingly useful at identifying changes in price behaviour compared with more sophisticated models. In particular we follow Lin and Tamvakis (2010) by using both a zero log return and a constant log return model for the
29
behaviour of EUA prices during normal periods.
The conclusions drawn
from these two models are the same giving practically the same p-values; the results presented in Table 6 are for the simpler zero log return model (results for the constant rate of return model are available upon request). We de�ne
ri,τ
as the observed EUA log return, with
the particular event and event. In this case
τ
i
being an index for
being an index for time during this particular
i = 1, 2, .., N ,
where
N = 29
for all of the events under
consideration. When we examine only a subset of these, such as days when decisions are party-political in origin, or days with high sentiment or high news then
N = 10
the day of event,
τ
or
N = 14
respectively. We set the event time
then takes values between
−25
and
5. Ki,τ
τ =0
on
is de�ned to
be the expected return based on a model calibrated during the estimation window, which are the 20 days when the residual
�i,τ = ri.τ − Ki,τ .
−25 6 τ 6 −6.
We therefore de�ne
In this application of the event study, as is the
case in Lin and Tamvakis (2010) we assume
Ki,τ = 0.
Very similar results
and identical conclusions are obtained when using a constant return model for
Ki,τ ,
calculated as the mean during the estimation windows. Following
the standard approach, the average abnormal return
ARτ
at event time
τ
is
de�ned as
ARτ =
N 1P �i,τ . N i=1
The cumulative average abnormal return between two days τ1 and τ2 ,
30
(1)
CAR(τ1 , τ2 ),
is therefore de�ned as
CAR(τ1 , τ2 ) =
τ2 X
ARτ .
t=τ2 This is calculated for all 29 events and for the di�erent categories of events, party-political, non-party-political, and high and low sentiment and news. We calculate an associated test statistic
CAR(τ1 , τ2 ) T = p ∼ N (0, 1) σ 2 (τ1 , τ 2 ) where
σ 2 (τ1 , τ2 ) = Lσ 2 , σ 2
estimation window, and
τ1
is �xed at
τ1 = −5
labelled in the form
is the variance of the
L = τ2 − τ1 + 1.
while
CAR τ2 .
τ2
varies from
ARτ
calculated during the
In our application the value of
−5, −4, ..., 5;
we present results
The results of the event studies are presented in
Table 6 both with and without the extreme event of the backloading rejection date, 16th April 2013. Repeating the event studies in this way provides a robustness check for our analysis.
2.5.2 GARCH Model Speci�cation In addition to the impact on returns, we are also particularly interested in the e�ect of EP policy decisions on the volatility of the EUA emissions market. To test this we use a GARCH model with dummy variables in the variance equation, following Lu and Chen (2011). In line with Chevallier (2011) and, Engle and Ng (1993) the standard GARCH(1,1) model for EUA prices is
31
speci�ed as follows:
rt = µ + ρrt−1 + εt , εt ∼ i.i.d.(0, σt2 ),
2 σt2 = α0 + α1 ε2t−1 + βσt−1
where
rt
is the log return for day
correlation;
µ, α0 , α1 and β
t;ρ
is the coe�cient of �rst order auto-
are constants, and
with mean zero and conditional variance
σt2 .
εt
is the error term process
We test whether there is an
e�ect on the event days by introducing a dummy variable
dt
in the variance
speci�cation. We test the period before the event day, by setting
dt = 1
on
each of �ve days before each event and zero on all other days. We test the period of and after the event by setting
dt = 1
on the day of each event and
on the following �ve days. These periods are chosen so that we may make compare the event study results and the GARCH results. That is, we specify
2 σt2 = α0 + α1 ε2t−1 + βσt−1 + γdt
where
dt
is the value of the dummy variable on day
t.
We use Marquardt's
method in Eviews and present the results before the event in Table 7 with the results on and after the event in Table 8. Again, as a robustness check we repeat the GARCH modelling while excluding the extreme event of the backloading rejection date, 16th April 2013.
32
3 Empirical Results Following the method set out in the previous section, Table 6 (Panel A) presents the results of the event studies while Tables 7 and 8 (Panel A) present the results of the GARCH modelling before and after the same events. Our principal �nding is that EP policy decisions taken as a whole have a signi�cant e�ect on EUA prices. From the event study analysis, this e�ect starts on the day of the policy decision itself and results in a reduction of EUA prices, while from the GARCH modelling we see an increase in volatility before and after the decision.
The decrease in the EUA price is strongly
statistically signi�cant, as evidenced for the cumulative abnormal returns over event dates
τ = 0, . . . , 5.
These event study results were found to be
robust to a change in the model used to calculate the abnormal returns in Eqn.
1, where instead of a zero log returns model we use a constant log
returns model to calculate the abnormal returns (calculated as the mean during the estimation windows). From the GARCH modelling, an increase in volatility clustering is evidenced after the event dates with a smaller e�ect before. There is a very strong result after event days as seen in the higher value of the
γ
parameter.
As set out in the previous section, (Section 2), given the in�uence and hence potential source of bias from the backloading vote event, we check the robustness of our �ndings by means of repeating the testing but removing from the data set the extreme event date of the 16th April 2013, i.e. the date
33
of the backloading rejection by the EP. Panel B of Table 6 presents the results of the event studies in this case. As this date falls into the classi�cations of �non-party-political�, �low sentiment� and �low news�, we report the updated results for these categories only. When the e�ect of the vote on backloading is removed from the analysis the statistical signi�cance of the results is less striking, although the results remain statistically signi�cant at the conventional levels. So our �ndings hold after accounting for the potential bias of the extreme backloading event.
In a similar manner, Panel B of Tables 7
and 8 present the results of the GARCH modelling when the backloading rejection date is removed.
When we re-examine the all-decisions grouping
we notice that before the event the size of the coe�cient for the dummy variable,
γ,
is lower without the outlier and has lost statistical signi�cance,
but the volatility dummy variable on and after the event is practically the same and remains strongly signi�cant. This indicates that the backloading rejection date was an important part of the overall pattern in the data but was not responsible on its own for the pattern. A drop in EUA prices is seen not only on the event day itself but for several more days after the EP decision. We may conclude that the emissions market is taken by surprise when EP decisions are made. Then similarly to the post earnings announcement drift (Barber and Odean, 2008; Da et al., 2011; Vozlyublennaia, 2014) the change in price continues for several days. Our second key �nding is that when the EP is dealing with a policy decision which is non-party-political, i.e. legislation which originated from the
34
European Parliament's committees, the European council or the European commission, there is on average a large reduction in the price of EUAs and an observable increase in the volatility of the EUA price. These e�ects are not seen for decisions brought forward by the party-political groups of MEPs, decisions made in these cases tend not to move the price signi�cantly and there is some evidence that volatility decreases after such decisions. The results are seen to hold when the backloading rejection vote is excluded. This would indicate that if the political groups of the MEPs are themselves the source of the discussion, then the resulting decisions of the EP do not take the market by surprise.
This may be caused by the political groups' will-
ingness to publicise their activities.
The market is more strongly a�ected
by the non-party-political decisions from more bureaucratic sources which are less likely to seek publicity and so these decisions are less anticipated by the market. This �nding has an important implication for policy makers as it shows that non-party-political legislation has the greatest impact on the emissions markets, and these on average cause market shocks. Our third main �nding is that the EP policy decisions are associated with a decrease in the level of EUA price and an increase in volatility after the decision during times of low market sentiment but not in times of high sentiment. This suggests a particular e�ect of EP policy decisions during times of low market sentiment. A similar pattern is seen without the backloading event date.
These sentiment �ndings indicate a need for policy makers to
consider market dynamics in terms of policy decision timing.
35
Our fourth and �nal �nding is that when there are low levels of emissions market attention (as measured by media coverage), the EP decisions again move the price of EUAs signi�cantly downwards after the event and signi�cantly increase volatility both before and after the event. In contrast, when there are high levels of emissions market related news, the EP decisions do not, on average, have an e�ect on the level of EUA prices but actually lower the volatility after the decision takes place. This suggests that policy decisions that directly or indirectly relate to the structure and functioning of the EUA market impact on price and volatility when general market attention is low. These �ndings indicate a need to inform market participants more e�ectively as to upcoming EP decisions that might impact on the market. There are some weaknesses in the testing method used here which would prompt future investigations. Firstly the media analysed is only in the English language. While it is certainly the case that the chosen newspapers and newswires have international respect it would be interesting to test the exposure in other languages. Another weakness is that we only test 29 decisions, while this is a much larger sample size than Koch et al. (2014) it is always desirable to have more datapoints. This selection was a compromise between the length of the estimation window and the number of decisions used for the event study, because an increased estimation window size would reduce the number of decisions available for the event study.
36
Panel A Event Study using all data All Topical EP-led High Low High Low Decisions Sentiment Sentiment News News CAR -5 CAR -4 CAR -3 CAR -2 CAR -1 CAR 0 CAR 1 CAR 2 CAR 3 CAR 4 CAR 5 N=
-0.004
-0.002
-0.005
-0.013
-0.010
-0.014*
-0.016
-0.022
-0.013
-0.012
-0.021
-0.007
-0.013
-0.018
-0.036***
-0.028
-0.045*** -0.039***
-0.009
-0.006
-0.003
-0.005
-0.020*
-0.014
-0.012
-0.010
-0.022*
-0.021*
-0.012
0.000
-0.023
-0.009
-0.015
-0.010
-0.003
-0.022
-0.010
-0.015
-0.041**
-0.020
-0.051**
-0.020
-0.049**
-0.019
-0.059***
-0.019
-0.070***
-0.009
-0.074***
-0.013
-0.052***
-0.012
-0.064***
0.000
-0.070***
-0.047***
-0.020
-0.062***
-0.020
-0.073***
0.001
-0.086***
-0.056***
-0.014
-0.078***
-0.018
-0.082***
-0.000
-0.101***
-0.060***
-0.024
-0.079***
-0.036*
-0.083***
-0.006
-0.105***
29
10
19
0.001
14
15
13
Panel B Event Study omitting the backloading rejection day All EP-led Low Decisions Sentiment CAR -5 CAR -4 CAR -3 CAR -2 CAR -1 CAR 0 CAR 1 CAR 2 CAR 3 CAR 4 CAR 5 N=
16
Low News
-0.001
-0.001
-0.004
-0.007
-0.005
-0.008
0.000
-0.011
-0.004
-0.011
-0.001
-0.009
-0.003
-0.018
-0.010
-0.010
-0.006
-0.018
-0.010
-0.019 *
-0.014
-0.018
-0.018
-0.024 **
-0.027 *
-0.029
-0.037 *
-0.021 *
-0.026 *
-0.031
-0.040 *
-0.031 **
-0.038 **
-0.043 *
-0.059 **
-0.037 **
-0.050 **
-0.046 *
-0.068 ***
-0.044 ***
-0.055 **
-0.051 **
-0.077 ***
28
18
14
Panel A shows results of tests comparing the e�ect of European Parliament decisions on the mean of log returns of EUA prices on the �ve days before, the day itself and the �ve days after the decision. Panel B repeats these tests without the outlier on the backloading rejection day, 16th April 2013. Topical refers to EP decisions originating from the political groups of MEPs, EP-led refers to all other sources of EP decisions. High sentiment refers to levels of sentiment above the median. The EUA sentiment index uses only data from the EUA and Energy markets, and the volatility of the Stoxx 50 to construct a sentiment index. News is a measure of the exposure of the EU ETS in broadsheet and newswire stories. The event study measures changes 37in the cumulative abnormal returns for an event window of 11 days. These tests are repeated with a constant level of change model to calculate the abnormal returns. These results yield very similar results and identical conclusions; they are omitted for brevity and are available from the authors. N indicates the number of events in each test. The usual */**/*** indicates 10%, 5% and 1% p-values for the coe�cient signi�cance test. Table 6: Event study results
0.003
15
Panel A GARCH before the Event days Base Model
α0
(x 10−5 )
1.54 ***
All Topical EP-led Decisions
High Low High Sentiment Sentiment News
Low News
1.28***
1.54***
1.24***
1.44***
1.41***
1.56***
1.23***
α1
0.160 ***
0.157***
0.160***
0.156***
0.159 ***
0.157***
0.160***
0.151***
β1
0.839 ***
0.843***
0.839***
0.845***
0.840***
0.842***
0.839***
0.846***
γ (x 10−5 )
-
1.99*
-0.53
3.06*
1.27
2.57
-0.29
8.7***
N
-
29
10
19
14
15
13
16
Panel B GARCH before the Event Days omitting the backloading rejection day Base Model
α0 (x 10−5 )
1.54 ***
All Decisions
EP-led
Low Sentiment
Low News
1.33***
1.28***
1.45***
1.22***
α1
0.160 ***
0.157***
0.157 ***
0.158***
0.153***
β1
0.839 ***
0.843***
0.844 ***
0.841***
0.846***
γ (x 10−5 )
-
1.47
2.11*
1.15
5.90***
N
-
28
18
14
15
The table shows the results of GARCH models for the 1,625 daily log returns of EUA prices. Panel A uses all 29 decisions of the European Parliament (EP) selected according to origin, sentiment and news exposure. Panel B repeats these tests, omitting an outlier on the backloading rejection day, 16th April 2013. The base model is the standard GARCH model without the dummy variables around the times of EP decisions, and this model is shown for comparison purposes. Topical refers to a categorization of each decision by the EP itself where the decision originates from the political groups of the EP. High sentiment refers to levels of sentiment above the median. The sentiment index uses only data from the EUA and Energy markets, and the volatility of the Stoxx 50 to construct a sentiment index. News is a measure of the exposure of the EU ETS in broadsheet and newswire stories. The change of variance is based on the addition of a dummy variable dt to the 2 variance equation in a GARCH model σt2 = α0 + α1 ε2t−1 + β1 σt−1 + γdt . The dummy variable dt takes the value 1 on the 5 days before the European Parliament decision and zero otherwise. N refers to the number of events (EP decisions) in each model. The usual */**/*** indicates 10%, 5% and 1% p-values for the coe�cient signi�cance test. For brevity the mean equation results are not included but are available from the authors. Table 7: GARCH results for the �ve day period before European Parliament decisions
38
Panel A GARCH on and after the Event Days Base Model
α0
(x 10−5 )
α1 β1 γ (x
10−5 )
N
1.54 ***
All Topical EP-led High Low High Decisions l Sentiment Sentiment News
Low News
1.33***
1.56***
1.32***
1.51***
1.41***
1.75***
1.35***
0.160 ***
0.164***
0.159***
0.166***
0.161***
0.162***
0.161***
0.166***
0.839 ***
0.836***
0.841***
0.834***
0.839***
0.837***
0.837***
0.832***
-
2.35**
-2.69*
3.93***
0.56
3.55**
-2.88**
9.39***
-
29
10
19
14
15
13
16
Panel B GARCH on and after the Event Days omitting the backloading rejection day Base Model
α0
(x 10−5 )
1.54 ***
All Decisions
EP-led
Low Sentiment
Low News
1.33***
1.31***
1.40***
1.32***
α1
0.160 ***
0.163***
0.166***
0.162***
0.165***
β1
0.839 ***
0.836***
0.835***
0.838***
0.833***
γ (x 10−5 )
-
2.23**
3.70***
3.25**
8.60***
N
-
28
18
14
15
The table shows the results of GARCH models for the same tests as in Table 7 with the change that the dummy variable dt takes the value 1 on the day of the decision and on the following 5 days, and is zero otherwise. This tests for a change of variance after an event. Table 8: GARCH results for the day of the European Parliament decisions and the following �ve days
39
4 Conclusions and Policy Implications Koch et al. (2014) are clear that there is much yet to be discovered about the drivers of EUA prices beyond the fundamentals. It is not surprising that policy maker decisions from the European Parliament have a direct e�ect on the volatility and level of EUA prices. This study shows that EP in�uence is changed by the type of decision, the sentiment of the emissions markets, and the level of market attention (as measured by news coverage) in advance of the decision. The emissions market has some insight into the likely outcome of decisions made by the European Parliament in three circumstances, (i) when it is the party-political groups in the parliament who propose the legislation, (ii) when market sentiment is high and (iii) when the level of market awareness is high, that is when there are high levels of media coverage.
The decisions made
under these circumstances seem to be anticipated correctly by the market and there is little price movement. Of greater interest are the occasions when EUA market prices systematically react as if it has just been surprised. The decisions that we have termed non-party-political in this study; those decisions originating from one of the EP committees, the European Council or the European Commission, significantly lower EUA prices and are associated with heightened price volatility. The GARCH volatility �ndings indicate a high level of trader uncertainty around the outcome of these decisions and their potential impact on prices.
40
Better communication by policy makers would help reduce this. Clearly setting out a timeline of planned legislative decisions over the medium-term and what these policies will broadly aim to achieve can help provide some improved certainty to market participants.
Ideally some form of forward
guidance might be given. A bene�t of this is that current prices would be a more accurate re�ection of true value and thus organizations that must buy allowances will be paying an appropriate price.
Reducing uncertainty
will also encourage the market to move from being a short-term speculative market to one where institutions interested in long-term participation will be attracted, thus helping to add depth to the market. With regard to the sentiment and media �ndings, these o�er some additional important implications. Firstly the �nding that sentiment and media coverage might in�uence price reaction is of interest in terms of informing the timing of decisions. Political decisions are often timed based on judgements of public receptiveness, and perhaps this needs to be considered for EP decisions on the EUA market. EUAs are not like normal commodities; the supply of EUAs is under political control and the demand for them is caused by regulation. Hence they have a high level of regulatory uncertainty attached to their valuation. The sentiment literature in equity markets, starting with Baker and Wurgler (2006), has consistently recognized that more uncertain assets are more prone to sentiment in�uence. The presence of high uncertainty in the pricing of EUAs (and not just for the EUA market, but also other highly regulated markets subject to political in�uence), suggests
41
a greater need for awareness of these behavioural drivers of price. It is clear that EP decisions have a signi�cant and important in�uence on EUA price levels and volatility. We have provided a systematic investigation of this in�uence in this study. Providing greater certainty to market participants, possibly through forward guidance, would enhance market participation, while improved awareness of behavioural in�uences regarding the market's reaction to EP decisions, can help strengthen the operation of the EUA market. A next step is to delve more qualitatively into the nature of individual EP decisions and ascertain particular facets of those decisions that might be driving market reactions. There is also strong scope for integrating market sentiment deeper into our understanding of emissions markets pricing.
References Aatola, P., Ollikainen, M., Toppinen, A. 2013. Price determination in the EU ETS market: Theory and econometric analysis with market fundamentals. Energy Economics 36, 380 - 395. Alberola, E., Chevallier, J., Cheze B., 2008. Price drivers and structural breaks in European carbon prices 2005-2007. Energy Policy 36(2),787 - 797. Baker, M. ,Wurgler, J., 2006.
Investor sentiment and the cross section of
stock returns. Journal of Finance 61, 1645 - 1680. Baker, M., Wurgler, J., 2007. Investor sentiment in the stock market. The
42
Journal of Economic Perspectives 21(2),129 - 151. Barber, B. M., Odean, T. 2008. All that glitters: The e�ect of attention and news on the buying behavior of individual and institutional investors. Review of Financial Studies, 21, 785 - 818. Bernard, V. L., Thomas, J. K. 1989. Post-Earnings-Announcement Drift: Delayed Price Response or Risk Premium? Journal of Accounting Research 27, 1 - 36. Bird, R., Yeung, D.2012.
How do investors react under uncertainty?
Paci�c-Basin Finance Journal 20, 310 - 327. Blyth, W., Bradley, R., Bunn, D., Clarke, C., Wilson, T., Yang, M. 2007. Investment risks under uncertain climate change policy. Energy Policy 35, 5766 - 5773. Bredin, D., Muckley C., 2011. An emerging equilibrium in the EU emissions trading scheme. Energy Economics 33(2), 353 - 362. Campbell, J. R., Evans, C. L., Fisher, L. D. M., Lustiniano, A. 2012. Macroeconomic E�ects of Federal Reserve Forward Guidance.
Brookings
Papers on Economic Activity 1 - 80. Canbas, S., Kandir, S.Y., 2009. Investor sentiment and stock return evidence from Turkey. Emerging Markets Finance and Trade 45(4), 36 - 52. Chevallier, J. 2011.
Econometric Analysis of Carbon Markets.
Springer,
Dordrecht ; London. Cifarelli, G., Paladino G., 2010.
Oil price dynamics and speculation:
multivariate �nancial approach. Energy Economics 32(2),363 - 372.
43
A
Creti, A., Jouvet, P., Mignon, V., 2012. Carbon price drivers: Phase I versus phase II equilibrium? Energy Economics 34(1), 327 - 334. Da, Z., Engelberg, J., Gao, P. 2011. In search of attention. Journal of Finance. 66, 1461-1499. Daskalakis, G., Markellos, R.N., 2009.
Are electricity risk premia a�ected
by emission allowance prices? Evidence from the EEX, Nord Pool and Powernext. Energy Policy 37(7), 2594 - 2604. Deeney, P., Cummins M., Dowling, M., Bermingham, A., 2015. Sentiment in the Oil Markets. International Review of Financial Analysis 27, 179 - 185. Delarue, E.D., D'haeseleer W.D., 2007.
Price determination of ETS al-
lowances through the switching level of coal and gas in the power sector. International Journal of Energy Research 31(11),1001 - 1015. Dowling, M., Cummins, M., Lucey B.M., 2014. Psychological barriers in oil futures markets. Energy Economics. in press. Engle, R.F., Ng. V.K., 1993. Measuring and testing the impact of news on volatility. Journal of Finance 48(5), 1749 - 1778. Fang, L., Peress, J., 2009. Media Coverage and the Cross-Section of Stock Returns. Journal of Finance 64(5), 2023 - 2052. Fuss, S., Szolgayova, J., Obersteiner, M., Gusti, M. 2008.
Investment
under market and climate policy uncertainty. Applied Energy 85, 708 - 721. Hirshleifer, D., Hsu, P. , Li, D. 2013.
Innovative e�ciency and stock
returns. Journal of Financial Economics 107, 632 - 654. Hirshleifer, D., Lim, S., Teoh, S. 2009. Driven to Distraction: Extraneous
44
Events and Underreaction to Earnings News. Journal of Finance 64, 2289 2325. Koch, N., Fuss S., Grosjean G., Edenhofer, O., 2014. Causes of the EU ETS price drop: Recession, CDM, renewable policies or a bit of everything? New evidence. Energy Policy 73,676 - 685. Kool, C.J.M. and Thornton, D.L. 2012. How e�ective is central bank forward guidance? Federal Reserve of St Louis Working Paper Series 2012-063A. Kossoy, A., Guigon P., 2012. World Bank Report: State and trends of the carbon market 2012. Technical Report World Bank. Kothari, S.P., Warner J. B., 2007. Econometrics of event studies in: Eckbo, B.E. (Ed.), Handbook of Corporate Finance Vol 1. North Holland Elsevier, Amsterdam. Lee, C.M.C., Shleifer, A., Thaler, R.H., 1991.
Investor sentiment and the
closed-end fund puzzle. Journal of Finance 46(1),75 - 109. Lemmon, M., Portniaguina, E., 2006. Consumer con�dence and asset prices: Some empirical evidence. The Review of Financial Studies 19(4),1499 - 1529. Lin, S.X., Tamvakis, M., 2010. OPEC announcements and their e�ects on crude oil prices. Energy Policy 38(2),1010 - 1016. Lu, Y., Chen. W., 2011. Unreliable inference for business and economic event studies based on variance dummy variable in a GARCH regression model. Journal of Applied Business and Economics 12(5), 45 - 53. MacKinlay, A.C., 1997. Event Studies in Economics and Finance. Journal of Economic Literature 35(1),13 - 39. Mansanet-Bataller, M., Chevallier, J., Hervé-Mignucci, M., Alberola, E.,
45
2011. EUA and sCER phase II price drivers: Unveiling the reasons for the existence of the EUA sCER spread. Energy Policy 39(3),1056 - 1069. Merton, R.C., 1987.
A simple model of capital market equilibrium with
incomplete information. Journal of Finance 42(3), 483 - 510. Mian, G.M., Sankaraguruswamy, S., 2012.
Investor sentiment and stock
market response to earnings news. Accounting Review 87(4),1357 - 1384. Pindyck, R.S.. 2004. Volatility and commodity price dynamics. Journal of Futures Markets 24(11),1029 - 1047. Scheinkman, J.A., Xiong W., 2003.Overcon�dence and speculative bubbles. Journal of Political Economy 111(6), 1183 - 1220. Schmeling, M. 2009.
Investor sentiment and stock returns: Some interna-
tional evidence. Journal of Empirical Finance 16(3), 394 - 408. Silverio, R., Szklo, A., 2012.The e�ect of the �nancial sector on the evolution of oil prices: Analysis of the contribution of the futures market to the price discovery process in the WTI spot market. Energy Economics 34,1799 - 1808. Simon, D.P., Wiggins III, R.A., 2001.
S&P futures returns and contrary
sentiment indicators. Journal of Futures Markets 21(5),447 - 462. Solt, M.E., Statman, M., 1988. How useful is the sentiment index? Financial Analysts Journal. Sept-Oct. 45 - 55. Song, H., Schwarz, N. 2010. If it's easy to read, it's easy to do, pretty, good, and true. Psychologist 23, 108 - 111. Tetlock, P.C., 2007. Giving content to investor sentiment: The role of media in the stock market. The Journal of Finance 62(3),1139 - 1168.
46
Vozlyublennaia, N., 2014.
Investor attention, index performance, and
return predictability. Journal of Banking & Finance 41, 17 - 35. Whaley, R. E., 2000. The investor fear gauge. Journal of Portfolio Management 26(3),12 - 17. Whaley, R. E. 2009. Understanding the VIX. Journal of Portfolio Management 35(3), 98 - 105. Yang, M., Blyth, W., Bradley, R., Bunn, D., Clarke, C., Wilson, T. 2008. Evaluating the power investment options with uncertainty in climate policy Energy Economics 30, 1933 - 1950. Zhu, B., Chevallier, J., Ma, S., Wei, Y., 2015.
Examining the structural
changes of European carbon futures price 2005 to 2012. Applied Economics Letters 22(5),335 - 342.
47