Chapter
1
INTRODUCTION
The main aim of a vehicle’s suspension system is to isolate the occupants from external terrain induced disturbances, while still allowing the average driver to maintain control over the vehicle and drive it safely. The design of vehicle suspension systems always involves a compromise between ride comfort and handling. For good ride comfort a compliant suspension system is normally required, while good handling demands a stiff suspension system to control body roll. With a normal passive suspension system, the characteristics of the springs and dampers are fixed at the design stage and cannot be changed afterwards. By using controllable springs and dampers, the suspension characteristics can be changed while the vehicle is moving. It therefore becomes possible to have soft settings for good ride comfort whilst traveling in a straight line on a good road, while the suspension characteristics can be changed to a hard setting moments later to give good handling when the vehicle has to change direction as required for lane changing or even accident avoidance. Settings can also be adjusted based on the terrain roughness. With limited suspension travel available, increased terrain roughness might require an increase in spring stiffness to prevent bumpstop contact and therefore improve ride comfort. The problem becomes even more severe when the operational requirements of a vehicle are in conflict with the suspension design. On most off-road vehicles high ground clearance is required to enable crossing obstacles. Large suspension travel is also required to keep all wheels in contact with the ground in order to maintain traction. Even load distribution amongst the different wheels improves traction but requires soft springs. A problem however arises when these vehicles have to be operated at high speeds on smooth roads. The high center of gravity, large suspension travel and soft springs create an inherent handling and stability problem making these vehicles prone to rollover. A satisfactory solution cannot be obtained with a passive suspension system, but controllable suspension systems have the potential to reduce or even eliminate the ride comfort vs. handling compromise. The type of controllable suspension system that is the topic of the current research, can significantly improve the situation by having a choice of two discrete spring characteristics, as well as two discrete damper characteristics. The system also features ride height adjustment capabilities giving control over ground clearance and center of gravity height. This means that the suspension can be switched to a setting optimized for off-road use (ride comfort and traction). Another setting, optimized for high-speed on-road use, is available under conditions where good handling is required. To obtain maximum benefit, switchover must occur automatically without driver intervention. This being the main challenge that needs to be addressed before these
1.2
INTRODUCTION systems can be successfully applied to vehicles: decision”.
the “ride comfort vs. handling
The rest of this chapter gives background on several relevant topics such as vehicle models, classification of controllable suspension systems, hydropneumatic springs, production and concept applications of controllable suspension systems and global viewpoints. The chapter closes with the problem statement and hypothesis. 1.1
Vehicle models
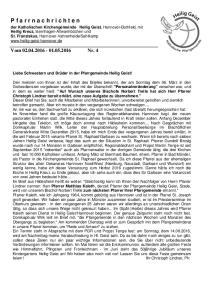
It can be argued that the simplest model of a car suspension system that is really useful is the ¼ car representation as indicated in Figure 1.1. Here the vehicle body is represented by the sprung mass M. The suspension, wheels and tyres are lumped as an unsprung mass, m. The unsprung mass is connected to the sprung mass via a spring and damper and to the road input via the tyre, normally represented only by a spring. Tyre damping is usually small and therefore often neglected in ¼ car analyses. Suspension kinematics is ignored and the two masses are only allowed vertical translation. If the spring, damper and tyre characteristics are linear, the analysis can be performed in either the frequency domain or the time domain. Non-linear characteristics however require time domain analysis where a weighted root mean square (RMS) value of the sprung mass acceleration is normally used as a measure of ride comfort. This model can be useful to obtain first order values of spring and damper characteristics required to meet a ride comfort specification. Although many authors attempt to get an indication of handling by looking at the tyre force variations, this is an extreme oversimplification of the handling phenomena (Miller 1988b). Handling is much more complicated to simulate or measure on a vehicle, not least because it is very dependent on the human driver. Human driver preferences and characteristics vary widely making subjective vs. objective comparison of vehicle handling troublesome.
M ks
c m kt
Figure 1.1 – ¼ Car suspension system
INTRODUCTION
1.3
The ¼ car model can be expanded to a ½ car model considering either roll or pitch motion, resulting in a model with four degrees of freedom. The next logical step is a full car model with seven degrees of freedom taking roll, pitch and vertical movement into account. This type of model usually still ignores suspension kinematics and only allows for vertical translation of the unsprung mass. However, to obtain useful results for handling, longitudinal and lateral translations need to be added. Throughout the present study, use is made of a non-linear full vehicle model. The model is developed using the ADAMS multi-body dynamics code (Anon, 2002). The model includes suspension kinematics, a non-linear tyre model and a human driver model. Simulation is performed over real off-road terrain profiles. The model is validated against vehicle test results and the full details are discussed in Chapter 2. 1.2
Controllable suspension system classification
Before continuing it is necessary to discuss the main categories of controllable suspension systems. Confusion has been created by the inconsequent use of the terms adaptive, semiactive and active suspension systems. Suspension systems are classified for the purpose of the current study as given in Table 1. This classification is based on that proposed by Decker et.al. (1988). Williams (1994) also gives a description of various concepts. All the controllable systems have physical limits imposed on them. Maximum force, displacement, velocity and response times are usually limited by the hardware. Passive suspension systems are very well known and still used on the vast majority of new vehicles. Passive implies that the force-displacement and force-velocity characteristics of the suspension system remain fixed at the design values throughout the useful life of the components. Some degradation in performance usually takes place due to wear and fatigue, but the characteristics cannot be modified without replacing or manually adjusting components. Adjustable dampers that can be switched between different characteristics using simple tools such as a screwdriver also fall in this category. Adaptive systems can usually change certain characteristics slowly to adapt to changes in vehicle load, speed or other operating conditions. These changes may take a few seconds or a few minutes to have an effect. Self-levelling is the best-known example. Buchholz (2003b) describes the ZF Sachs Nivomat mono tube damper with self-levelling feature. Self-levelling is accomplished by using the energy that is generated by relative movement between the vehicle body and suspension whilst moving. To accomplish levelling, typically 1.6 to 2.4 km of driving is required. Adding an electric pump will eliminate the need to drive the vehicle to accomplish self-levelling. The Nivomat system boasts two features that normal air levelling systems lack, namely a load dependent spring rate (which controls the ride frequency), and load dependent damping (which provides control for additional mass/payload in rebound). The conventional Nivomat system first appeared in the US market in 1996, fitted to a Chrysler vehicle. Semi-active systems are classified as systems where the characteristics can be changed rapidly (typically in less than 100 milliseconds). These systems can still only store energy (springs) or dissipate energy (dampers). The most common example is the semi-active damper where the damper force-velocity characteristic can be varied either between
1.4
INTRODUCTION
certain pre-defined discrete values (e.g. hard and soft), or continuously between a certain minimum and maximum boundary. Table 1.1 – Classification of suspension systems Class Passive
Characteristics fixed at design stage
Adaptive
Characteristics can change slowly
Semi-active: Discreet Characteristics can change quickly between certain discrete values Semi-active: Continuous Characteristics can change quickly and continuously between certain limits
Active Characteristics can change quickly and continuously between certain limits
Forces
Actuating times
Energy requirements
-
-
Force
•
x, x
Force
•
x, x
Longer than characteristic periods of oscillation
Low
Force
•
x, x
Shorter than characteristic periods of oscillation
Low
Force
•
x, x
Shorter than characteristic periods of oscillation
Low
Force
•
x, x
Shorter than characteristic periods of oscillation
High
According to Harty (2003), “the next step beyond current successful damper designs that switch between two or a few more discrete calibrations – allows ‘step-less’ damper characteristic modifications but represents a relatively new production technology. Adjusting damper characteristics does not alter fundamental handling balance, although it
INTRODUCTION
1.5
can modify transient events (e.g. turn-in) by phasing damper switching front to rear and/or side to side. Benefits include significant ride enhancements for a given level of handling performance and the potential for control of transient effects using more sophisticated algorithms than currently employed. However, handling balance cannot be continuously altered.” The Magnetic Ride Control dampers on the Cadillac XLR are a production example. This system employs magneto-rheological (MR) fluid and can continuously vary damping at speeds approaching 1 millisecond. The working principles of semi-active dampers can be divided into two main categories namely: hydraulic dampers with bypass valves, and dampers employing magnetorheological fluids. The Ohlins dampers fitted by Volvo amongst others, as well as the semi-active dampers used in the present study are basically normal hydraulic dampers fitted with a valve that can bypass the damper orifices. This bypass valve can have anything from two states (open and closed) to being continuously variable. Lord Corporation is one of the world leaders in the development and manufacture of magneto-rheological fluids. New fluids have been developed in response to improvements in MR technology driven by high volume production (Ponticel 2002). Both hydrocarbon oil and water-based products are available. The viscosity of MR fluids is dependent on the magnetic field applied. MR materials can change from a fluid to a near-solid state within milliseconds when applying a magnetic field. System design is simple and control power requirements are low. MR fluids are used in various applications, including automobile dampers and seat suspension systems. Delphi and Lord Corporation co-developed the MR fluid used in the Cadillac Seville STS dampers (Jost 2002b). The MR fluid consists of iron particles suspended in a synthetic hydrocarbon base fluid specifically developed for shock absorber application. In the “off” state the MR fluid is not magnetized and the iron articles are dispersed randomly. When applying a magnetic field, the iron particles align into fibrous structures, changing the fluid rheology in the “on” state and thus the damping properties. The damping fluid can change from a mineral oil type consistency (low damping forces) to a jelly-like substance (high damping) within one millisecond. Active suspensions usually replace springs and dampers with fast hydraulic, pneumatic or electric actuators. A soft spring is often used in parallel with the actuator to reduce power consumption by carrying the static wheel load. Active systems are still in the prototype stage and suffer from high power demands and cost. Active suspension has the ability to add significant amounts of energy to the system. Low-bandwidth active suspensions can only control primary suspension modes and front/rear roll moment balance at frequencies typically below 5 Hz. The Mercedes-Benz Active Body Control (ABC) system is a current production example. Low-bandwidth active suspension systems can offer ride benefits for a given level of handling performance. The cost can also be considerably less compared to higher bandwidth solutions (Harty 2003). Full-bandwidth active suspensions can provide control up to 25 Hz. High-bandwidth examples offer control of handling as well as body dynamics and thus theoretically
INTRODUCTION
1.6
improved performance compared to low-bandwidth systems. Several successful motor sport applications and research vehicles, notably from Lotus, exists but no production examples are known. The high bandwidth requires expensive hydraulic systems. High forces and displacements means that power consumption is also high (Harty 2003). Active suspension control using a linear electromagnetic actuator is described by Buckner et.al. (2000). The actuator is installed in parallel with a soft spring supporting the static load. The application is for a high mobility off-road military vehicle (HMMWV). Decker et.al. (1988) also describes a magnetic spring in parallel with the conventional steel spring. A recent variation on the theme of controllable suspension systems is active or semiactive roll control. Kim and Park (2004) describe an electrically actuated active roll control system. This system uses an electric actuator acting on the vehicle’s anti-rollbar. The addition of a variable damper is also investigated. Several control strategies are investigated with simulation and hardware-in-the-loop (HiL) testing. The system is said to be effective in spite of the limited bandwidth of the actuator. “Active anti-rollbars for warp control on one or both axles provide some of the platform-levelling benefits of lowband active suspension plus the ability to alter the handling balance continuously”. A production system is implemented on the 2004 model year BMW 7 Series. Handling benefits by being continuously adjustable from passive understeer to oversteer. The technology has minimal package and power requirements, and is lower cost than even low-band active suspensions. Disadvantages are the lack of pitch control and absolute authority for roll control, unless both front and rear bars are used. 1.3 Semi-active springs The two viable options considered for creating semi-active springs are either hydropneumatic or air springs. Although the rest of this document will refer to hydropneumatic springs, the same principles can be applied to air springs – the main difference being the working pressure. Hydropneumatic springs have been applied to military vehicles for many years. The most well known applications in passenger cars are by Citroën (Nastasić & Jahn, 2005). The spring force in a hydropneumatic suspension system is generated by compressing a gas in a closed container. The spring characteristic is non-linear and governed by gas laws. For low speed excitation, the spring characteristic can be approximated by isothermal compression, while for very high speeds, adiabatic compression yields more accurate results. Care must be taken when the ideal gas approach is used, as this results in significant errors for the typical pressures found in hydropneumatic suspension systems. Different models can be used to predict the spring characteristic of hydropneumatic springs. A thermal time constant model is used by Els (1993), Els & Grobbelaar (1993) and Els & Grobbelaar (1999). They take heat transfer effects and non-ideal gas behaviour into account. Another modelling technique is to use an anelastic model consisting of two parallel springs, one of which is in series with a damper. This approach is described by Kornhauser (1994) and Giliomee, Els and Van Niekerk (2005) amongst others.
INTRODUCTION 1.4
1.7
Current applications of controllable suspension systems
Citroën is considered to be the pioneers in the application of controllable suspension systems to passenger cars. The working principles of the different Citroën hydropneumatic suspension systems are described in considerable detail by Nastasić and Jahn (2005). All models since the introduction of the Citroën DS at the 1955 Paris Motor Show are described. This includes Hydractive I (first used on the Citroën XM), Hydractive II (launched in 1993), Activa (used on some Citroën Xantia models), Hydractive 3 and Hydractive 3+ (introduced on the C5). The number of commercial applications of controllable suspension systems in production cars is increasing rapidly. Most applications are however still limited to top of the range models where the cost penalty can be easily justified. An example is Continuous Damping Control (CDC), as developed by ZF Sachs. CDC was launched in 2001 as optional equipment on cars such as the BMW 7 Series and Ferrari Modena and is now available as optional equipment on the new (2004) Opel Astra (Jost 2004). The total number of CDC equipped vehicles on the road was expected to rise to 225 000 in 2005 (Anon, 2004). For the present study, application of controllable suspension systems to off-road vehicles is of special interest. Land Rover implemented a cross-linked electronic air suspension system on the 2003 model year Range Rover (Mayne 2002). The system joins the left front and right front air springs via an electronically controlled valve. The same happens on the rear suspension. When the valve is open, roll stiffness is dramatically reduced as air flows between the left and right suspension system to equalise the pressure. This results in low variation between wheel load left and right. The effect is less rocking on rough terrain and better traction, because all wheels maintain effective ground contact. If the valve is closed, the left and right suspension systems are isolated from each other – the setting used for on-road driving. An electronic control unit, that uses vehicle speed and suspension displacements as inputs, determines valve switching. The system is also fitted with automatic load levelling and ride height control. Volkswagen’s SUV, the Touareg, is fitted with air suspension and adjustable damping (Birch 2002b). Manual adjustment of four different suspension height levels and three different damper settings is provided. On-road ride height varies automatically according to vehicle speed. Ground clearance is reduced from 215 mm to 190 mm above 125 km/h although the driver can manually set other levels. Above 180 km/h the ride height is automatically reduced to 180 mm. The SmarTruck II, developed for the U.S. Army Tank-Automotive and Armaments Command’s National Automotive Centre, is based on a Chevrolet Silverado 2500 pickup. It features a heavy-duty adjustable air suspension system (Buchholz 2003a). A summary of current production and prototype applications of controllable suspension systems to light vehicles is given in Table 1.2. Features include adjustment of ground clearance, ride height control to compensate for load changes and selectability of different modes e.g. “Sport” or “Comfort”. This summary does not intend to be complete, but rather aims to give the reader an overview of the typical applications of controllable suspension systems.
1.8
INTRODUCTION Table 1.2 – Applications of controllable suspension systems
Audi Le Mans Concept, 2003 Audi RS6 Bently Continental, 2003 BMW 7-series (2001) opt. equip. Cadillac Seville STS, Post mid 2002 Cadillac Seville STS, Pre mid 2002 Chrysler Pacifica, 2003 Citroën Citroën Activa 2 Concept, 1990 Citroën C5 Citroën C-Airlounge Concept, 2003 Citroën DS, 1955 Citroën Xantia Citroën XM Citroën Xsara Dynactive Citroën, 1993 Ferrari 306, 2003 Ferrari Modena (2001) opt. equip. Ford Visos Concept, 2003 Jaguar XJ, 2003 Jeep Grand Cherokee Lamborghini Gallardo, 2003 Land Rover Range Rover, 2003 Maserati Quattroporte, 2004 Maserati Spyder, 2002 Mercedes Benz (2004) Opel Astra, 2004
A-class
Opel Insignia Concept, 2003 Toyota Soarer, 1986 US Army SmarTruck II, 2003 Volkswagen Phaeton, 2002 Volkswagen Touareg SUV, 2004 Volvo S60R and V70R, 2003 Number of applications
X
X
X
X X X
X
Dynamic ride control (DRC) X
CDC (Continuous Damping Control)
X
MagneRide (Delphi)
X X
X X
X
X X
X
Hydractive 3
X X
X
X
X
X
X
Hydractive 3+ Hydractive 3
X X X X X
X X X X X
X X X X X
X X X
X X X
X X X
X
X X X
X
X X
X
X
X X
Birch 2003b Birch 2003c Carney 2004b Birch 2003d Mayne 2002
Electronic Air Suspension (EAS) Audi Magnetic Ride Technology
Continuously Variable Road Sensing Suspension (CVRSS)
Nastasić and Jahn 2005 Birch 2003b Nastasić and Jahn 2005 Nastasić and Jahn 2005 Nastasić and Jahn 2005 Birch 1999 Nastasić and Jahn 2005 Carney 2003a Gehm 2004
X X
X X X X
X
Jost 2002b; Alexander 2003 Jost 2002b Gehm 2003 Nastasić and Jahn 2005 Birch et.al. 1990
X
X
Birch 2002c Birch 2003d Gehm 2004
Acronym
Semi-active Continuous
X
Semi-Active: Discrete
X
Adaptive
X X
Class
Passive
X
Magneto-rheologic (MR)
Hydraulic
X
Passive
X X
Hydropneumatic
Adaptive
Audi All-Road Quattro
Birch 2004a Birch 2002a; Birch 2002c Jost 2002a; Jost 2005 Birch 2003b
Damper
Load levelling
Audi A6 (2004) Audi A8, 2003
Class
Ride height control
Spring
Active anti-roll bar
Reference
Air
Manufacturer
Activa Hydractive I Hydractive 3 Hydractive II ?
? X
CDC (Continuous Damping Control)
X X
Computer Actives Technology Suspension (CATS) DHS (Dynamic Handling System)
X X
X
X
X
X
X X
Carney 2003b Kelly 2001; Carney 2003b Birch 2004b
X X
X X
Jost 2004
X
X
X X
X
Birch 2003b Hirose et.al. 1988 Buchholz 2003a
X X
Jost 2002a; Jost 2005 Birch 2002b
X X
X X
X
X X X
X X
X X
X X
Weissler 2003 4
8
9
15
15
X X
“Skyhook” “Skyhook”
X
Continuous Damping Control (CDC); ISDPlus
X
Electronic Air Suspension (EAS)
X
Continuously Controlled Concept (four-C)
X
X
X
3
X
X
7 16
20
2
7
3
Chassis
3 12
It is clear that the application of controllable suspension systems is quickly gaining ground in new passenger cars. Current fitment is to top-end road vehicles only. Current systems are mostly semi-active dampers and/or ride height control. A few applications of active anti-rollbars are also noted. Switching between various gas volumes have been employed by Citroën and Land Rover. Fully active systems have only been realized on prototypes. The developments by Lotus (Wright, 2001) are especially notable. 1.5
Global viewpoints
The viewpoints of several global experts in the vehicle suspension field are now discussed to determine general trends and forecasts.
INTRODUCTION
1.9
Vertical load modification systems (e.g. springs and dampers) have a direct influence on handling (Harty 2003). The scope for these systems to improve handling and stability is dependent on the relationship between the vertical force applied to the tyre and the corresponding lateral and longitudinal forces generated by the tyre. According to Harty (2003) ride comfort can be significantly improved using adaptive damper control. Stability can be influenced to a limited extent by damper control, because the damper can only have an influence during transients. Stability is currently improved by using brake-based systems. Brake-based systems are proven in the market. Active antirollbar technology can be used to good effect. The other candidate is variable geometry active suspension, but packaging problems and bandwidth issues hamper progress. Many of the current technical obstacles centre on sensing difficulties. Reliable sensing of friction coefficient between the tyre and road is a problem. The body slip angle of the vehicle also poses problems with many attempts focussed on calculating slip angle using state estimators and techniques such as Kalman filtering to retrieve robust estimates from noisy data. Land Rover’s Director of Product Development, Steve Ross, comments on the use of advanced technology as follows: “However, for us, technology is used to enhance both off- and on-road capabilities. Technology is a means to an end in achieving greater safety, security and refinement” (Birch 2001a). Range Rover’s computer-controlled air suspension, which can vary vehicle height on and off road, is an added safety element, lowering the centre of gravity (cg) when necessary, according to Ross. Birch (2003a) summarized comments from several European industry experts on the topic of integration of electronically controlled chassis and suspension systems. Hugh Kemp, Engineering Director of International Automotive Technology Business at Prodrive regards continuously variable dampers as having the potential to offer most of the benefits promised by active suspension but at a “more realistic price”. Prodrive favours mechanical variable orifice technology. Electronic control will also allow a single damper specification to be used across a vast range of vehicles. Michael Paul, Main Board Executive Director, Research and Development at ZF, agrees that there are great opportunities for more intelligent single components. “The new BMW 7 Series has an intelligent stabilizer system and electronically adjustable dampers. As for fully active suspension, I would be very hesitant; it requires a lot of power, which opposes the target of reducing fuel consumption”, he said. “… for cost reasons, air springs and particularly active body control (ABC) will remain in ‘privileged’ market sectors” according to Hans-Joachim Schöpf, Executive Vice President for Development, Mercedes Car Group. Nevio di Giusto, Head of Product Development, Fiat/Lancia Business unit, believes that any worthwhile project deserves a good chassis. “In the short term, I cannot envisage a well-designed chassis not using electronic control” he said. Clive Hickman, Managing Director of Ricardo Vehicle Engineering, regards the integration of chassis electronics as a significant challenge, with the development of air-
INTRODUCTION
1.10
springs, roll control, adaptive steering and damping systems complementing antilock, traction and stability programs. Roberto Fedeli, who is responsible for the development of all Ferrari development platforms, says that electronic systems should help the driver in some types of conditions and support safety. On normal road and normal climatic conditions, electronics must not mask the driver’s enjoyment of driving the car. He considers this to be a tuning problem that depends on the control algorithms used. Buchholz (2003c) looks at chassis developments for trucks and SUV’s from a North American perspective and interviews experts in the field. Scott Bailey, Director of Engineering for Energy and Chassis Systems at Delphi Corporation says: “With advanced technologies, [we] can all but eliminate ride and handling compromises”. Volvo became a first-to-market application example via the 2003 XC90 SUV’s active Roll Stability Control System, which was co-developed by Ford Motor Company and Continental Teves. Gyroscopic sensors are used to determine roll speed and roll angle. The system uses the braking and traction control systems to prevent rollover. Bailey also comments on trucks: “It’s an entirely different dynamic at play when you’re dealing with a pickup truck versus a passenger car. A truck can be partially loaded, or fully loaded, and is often towing something. Any of those conditions can significantly change the mass of the vehicle, which means the dynamic models have to change. You have to get much smarter about the different models that are at play to improve upon the control schemes. The result is a much more sophisticated modelling requirement”. Bob Walker, Engineering Director of Suspension and Exhaust Product Development for Visteon Corporation says programs at several companies include the concept of an “active corner” suspension. One particular active four-corner suspension system involves “inducing force into the suspension system – typically to a shock absorber or strut – so it can counteract the energy when the vehicle pitches in a particular direction”, says Walker. Aly Badawy, TRW Automotive Vice President of Steering, Linkage, and Suspension Engineering expects a production intent vehicle using the “active corner” concept to be ready by 2008, but production will be dependent on the development of 42 Volt technology, which he sees as “a must for an active corner”. In another article on chassis integration from a North American perspective by Alexander (2004b), Aly Badawy, TRW Automotive Vice President of Steering, Linkage, and Suspension Engineering states that rollover avoidance and mitigation is getting a lot of attention but there is no single technology to make a vehicle safe from rollover. Active roll control (ARC) is under development and about to go into production. Active damping control (ADC) is similar but allows for control of different sides of the vehicle. The key to improvements is to integrate all systems. “Fundamentally, the industry all has the same technology”. Sensing and control technology is the key to having the best product. Delphi has MagneRide in production that uses magneto-rheological fluid. Delphi’s active stabilizer comes in two variations namely a single channel and a two-channel version. It operates hydraulically but an electric version is under development according to Brian Murray, Manager of Delphi’s Innovation Center in Brighton, MI. It is clear that many industry specialists see the development of controllable suspension systems as one of the trends that will increase in future.
INTRODUCTION 1.6
1.11
Problem statement
Controllable suspension systems have been implemented successfully in the case of topend passenger cars and is seen by industry specialists as the development trend of the future. A void exists within the scope of vehicles that require good off-road capability (high ground clearance, large suspension travel and soft springs), but also good handling and stability on smooth roads at high speeds (low center of gravity and stiff springs). Military wheeled vehicles, Sports Utility Vehicles (SUV’s) and Crossover utility vehicles (CUV’s) all fall within this category. The following hypotheses are made: i) ii) iii)
iv)
v)
vi)
Ride comfort and handling have opposing requirements in terms of spring and damper characteristics. Suspension requirements for off-road use differ substantially from requirements for high-speed on- road use. A set of passive spring and damper characteristics, called the “ride comfort characteristic” can be obtained that will optimise ride comfort over prescribed off-road terrains at prescribed speeds. Additional improvements might be possible by using “control” but is not considered for the purposes of this thesis. A set of passive spring and damper characteristics, called the “handling characteristic”, can be obtained that will optimise handling for prescribed high-speed manoeuvres on good roads. Additional improvements might be possible using “control” but is not considered for the purposes of this thesis. Advanced suspension system hardware that can switch between the passive “ride comfort” and “handling” spring and damper characteristics, can be feasibly implemented. Response time must be quick enough to enable control of the sprung mass natural frequencies. A robust decision can be made whether “ride comfort” or “handling” is required for the prevailing conditions.
Chapters 2 to 6 of this thesis will investigate the validity of these hypotheses. Fully active suspension systems have been explicitly eliminated for the purposes of the current study due to prohibitive cost as well as power requirements during off-road driving (although both power requirements and cost can be improved). The purpose of this research is to design, develop, manufacture and test an advanced suspension system that can eliminate the ride comfort vs. handling compromise for vehicles that require good off-road capability, but also good handling and stability on smooth roads at high speeds. The resulting suspension hardware is tested and characterized to obtain all the parameters required for mathematical modeling. A Land Rover Defender 110 vehicle was chosen as the platform for simulation and testing of the controllable suspension concept proposed in the present study. The Land Rover Defender is still considered by many, not least the marketing division, to be the “best 4x4xfar” but the design is now dated. Although the vehicle behaves very well offroad, the on-road handling is less than desirable due to the soft suspension with large suspension travel and the high centre of mass. The vehicle, with its ladder frame chassis
INTRODUCTION
1.12
and boxy styling, makes it relatively easy to change suspension components and suspension mounting points. The vehicle is also fitted with coil springs. This means that all the axle-locating functions are performed by suspension links (e.g. leading arms, trailing arms, Panhard rods etc.) and not the springs, as is the case on many other vehicles in this class fitted with leaf springs. These factors combine to make the Land Rover Defender the ideal platform to test the controllable suspension concept. In order to investigate the feasibility of the proposed suspension system, the project consists of nine tasks namely: i)
Develop a full vehicle dynamics simulation model to predict ride comfort and handling. ii) Validate the vehicle dynamics simulation model. iii) Determine the required suspension characteristics for the “best” ride comfort and “best” handling respectively, using the vehicle dynamics model. iv) Design a prototype suspension system capable of producing the required characteristics. v) Manufacture the prototype suspension system according to the design. vi) Test and characterise the prototype suspension system to determine feasibility and conformance to specification. vii) Develop a mathematical model of the prototype suspension system that can be incorporated into the vehicle dynamics model. viii) Develop a decision making methodology that can be used to switch the suspension system between ride comfort and handling modes. From now on this will be called the “ride vs. handling decision”. The ride vs. handling decision constitutes the main challenge for the successful implementation of the controllable suspension system proposed in this study and is therefore seen as the major contribution of the present study. ix) Fit the prototype suspension system to a test vehicle, implement the ride vs. handling strategy and validate the strategy using vehicle tests. The nine steps listed are represented graphically in Figure 1.2. The chapter in this thesis where each step is further discussed is indicated below each block. In Chapter 2, a validated, non-linear full vehicle model is used to investigate the “optimal” characteristics for both ride comfort and handling. The conflicts between these requirements are investigated and analysed using simulation. The focus of Chapter 3 is on possible controllable suspension solutions to the ride vs. handling compromise. A possible solution is formulated and investigated in greater detail in Chapter 4 where the design, manufacturing, testing and mathematical modelling of the proposed prototype system is described. Chapter 5 looks at the crucial “ride comfort” vs. “handling” decision. Test data for different driving conditions is analysed and different decision-making ideas investigated. Vehicle implementation of the proposed hardware as well as the decision-making strategy and final test results are discussed in Chapter 6.
1.13
INTRODUCTION
i) Non-linear full vehicle model
ii)Validate (Chapter 2)
(Chapter 2)
Ride comfort criteria (objective vs. subjective)
Handling criteria (objective vs. subjective) (Chapter 2)
(Chapter 2)
iii) “Optimal” suspension for ride comfort
iii) “Optimal” suspension for handling
Conflicting requirements
(Chapter 2)
(Chapter 2)
(Chapter 2)
Assume ride comfort control strategy is known
Assume handling control strategy is known
(Chapter 3)
(Chapter 3)
Two-state semi-active hydropneumatic spring combined with Two-state semi-active damper (Chapter 4)
viii) Investigate how the decision between “ride” and “handling” can be made based on easily measurable parameters (Chapter 5)
ix) Vehicle implementation (Chapter 6)
Conclusion Figure 1.2 - Flow diagram of present study
iv) Design v) Manufacture vi) Test vii) Model (Chapter 4)
Chapter
2
THE RIDE COMFORT VS. HANDLING COMPROMISE
It is commonly accepted that vehicles with soft suspension systems generally provide very good ride comfort at the expense of handling. Most sports cars suffer from the opposite symptoms in that a firm suspension system offers excellent handling up to very high speeds but then the ride comfort is often described as harsh or rough. It is apparent that the design of a passive suspension system always involves a compromise between ride comfort and handling. In this chapter the ride comfort vs. handling compromise is investigated by means of two case studies. The case studies are presented after analyses of literature on the subject. The chapter concludes with the development and experimental validation of an ADAMS model of a Land Rover Defender 110 vehicle. The ADAMS model is used to determine spring and damper characteristics optimised for ride comfort and handling respectively. 2.1
Literature
In order to analyse the ride comfort vs. handling compromise, it is important to define the concepts of “ride comfort” and “handling” separately. In general “ride comfort” is associated with the vertical dynamics of the vehicle, primarily caused by road input excitation. “Handling” is usually associated with the lateral, yaw and roll degrees of freedom that are primarily a result of steering inputs by the driver. In the remainder of this study, ride comfort is associated with vehicle dynamics caused by road excitation. Handling is associated with vehicle dynamics due to steering inputs by the driver. 2.1.1
Ride comfort
Ride comfort is described by Harty (2003) as follows: “Ride comfort is a frequencyweighted measure of vertical acceleration, together with subjective assessments of harshness over lateral features and other secondary behaviours”. Four methods to objectively evaluate ride comfort (also referred to as human response to vibration) are used throughout the world today. The ISO 2631 standard (International Standards Organisation, 1997) is used mainly in Europe and the British Standard BS 6841 (British Standards Institution, 1987) in the United Kingdom. Germany and Austria use VDI 2057 (Hohl, 1984) while Average Absorbed Power or AAP (Pradko &
THE RIDE COMFORT VS. HANDLING COMPROMISE
2.2
Lee, 1966) is used by the United States of America and by NATO in the NATO Reference Mobility Model (NRMM). This presents two questions namely: (i) which method is most suitable for the evaluation of off-road vehicle ride comfort, and (ii) how does the results differ if different methods are used. The correlation between objective methods for determining ride comfort and subjective comments from crew driving in vehicles was investigated by Els (2005). For objective measurements, the ISO 2631, BS 6841, AAP and VDI 2057 methods were used. The emphasis was on the ride comfort of military vehicles operated under off-road conditions over typical terrains. An experiment was devised in which a 14-ton, 4x4 mine protected military vehicle (see Figure 2.1) was driven over seven different terrains, using various vehicle speeds and tyre pressures. The terrains were chosen to be representative of typical operating conditions in Southern Africa and excite significant amounts of body roll, pitch and yaw motion. Seven groups, consisting of 9 people each, were used for determining subjective comments using a questionnaire, while simultaneously recording acceleration data required for objective analysis at 11 positions in the vehicle.
Figure 2.1 - Test vehicle The resulting sets of measured data were converted into objective ride comfort values according to the ISO 2631, BS 6841, AAP and VDI 2057 methods. The unweighted values were also used for comparative purposes. Objective values were calculated for all the relevant parameters and measurement positions and compared to subjective ratings. It is concluded by Els (2005) that any of the four methods under consideration, namely ISO 2631, BS 6841, AAP and VDI 2057, could be used to objectively determine ride
THE RIDE COMFORT VS. HANDLING COMPROMISE
2.3
comfort for the vehicles and terrains of importance for the study. The vertical acceleration measurements give the best, and in fact the only reliable correlation and should be used in all cases. The RMS values are sufficient for ISO 2631, BS 6841 and unweighted values. Correlation for roll, pitch and yaw acceleration with subjective values is poor and not useful. According to Murphy (1984), a 6-Watt limit is normally assumed to be sustainable while values as high as 12 Watts can be sustained only for a short period of time. It was found by Els (2005) that a subjective response of 50% agrees with the 6 Watt AAP limit. Els reports the corresponding limit for the other methods to be 2.0 m/s2 RMS (according to ISO 2631 - rated as “very uncomfortable” according to Table 9 and Annex C in International Standards Organisation, 1997). Limits of 2.8 m/s2 for the unweighted RMS values, 1.8 m/s2 RMS for BS 6841, a VDI 2057 value of 88 and a 4-hour vibration dose value (VDV) of 26 m/s1.75 were also found. The 4-hour VDV of 26 m/s1.75 is significantly higher than the VDV of 15 normally assumed to be the guideline. Terrain inputs used for measuring or simulating ride comfort are usually described as a kind of Gaussian random or white noise input, often band limited to the frequency range of interest (Karnopp, 1968). The power spectral density (PSD or roughness number) approach is also used (International Standards Organisation, 1995; Gillespie, 1992; Cebon 1999). Very few studies use physically measured road profile data as input, because of the difficulties in accurately measuring the profile of rough roads. Discrete obstacles and sinusoidal inputs are also used. 2.1.2
Handling, rollover and stability
Simulation of vehicle handling is virtually non-existent in literature when analysing advanced suspension concepts. In isolated cases, handling is evaluated using step inputs and evaluating transient response. Figure 2.2 provides a graphical representation of the broader term “handling” as described by Harty (2005). Harty defines handling using this representation as the percentage of the available friction or the maximum achievable lateral acceleration utilised by the vehicle-driver combination. At values lower than the linearity limit, everybody can control the vehicle and avoid accidents. At values higher than the friction limit, control over the vehicle is physically impossible and even the most experienced driver in the best handling vehicle will loose control. He states several reasons why intervention by electronic stability enhancement systems is required namely: • Most drivers’ “in-head” model of the vehicle is based on linearity and zero phase lags. • Most drivers have no experience of significant loss of linearity. • Most drivers have no experience of phase lag in yaw/sideslip resonance. • When the vehicle departs from linearity, the population is very variable in its ability to retain control of the car. • There is a group of events where crashes occur even though the vehicle was not exceeding the friction limit due to the driver’s lack of control skill. • For road cars we need to match the car to the skill of the population. • For motor sport we can calibrate the car to the individual driver’s skill level.
THE RIDE COMFORT VS. HANDLING COMPROMISE
2.4
Harty sees the task of the vehicle designer as having two components namely: to raise the absolute friction limit and to raise the linearity limit. These simplistic statements ignore some problems namely: • is the distance between the friction limit and the linearity limit a function of the population only and not the car? • are we allowing some people to have crashes at higher speeds than they could previously have had? Harty (2005) also compares several advanced methods for improving vehicle handling. These methods include active front steering, rear wheel steering, brake-based stability control as well as front / rear torque distribution. No mention is made of semi-active suspension control.
Figure 2.2 – Handling classification according to Harty (2005) While human response to vibration (ride comfort) has been extensively researched, a single, unambiguous objective criterion for handling has eluded the vehicle science community despite numerous studies pertaining to the topic. As Vlk (1985) notes with respect to truck-trailer devices: "It is most desirable to define evaluation criteria for the handling performance of vehicle combinations, both for steady state and transient driving behaviour”. For this reason a study was performed in order to establish relationships that can be used to objectively quantify vehicle handling (Uys, Els & Thoresson, 2006). The idea was to
THE RIDE COMFORT VS. HANDLING COMPROMISE
2.5
identify parameters that can be used to specify handling and that can be used as the objective function in suspension optimisation studies. Literature on the topic will now be reviewed, followed by test results for three different vehicles and four different drivers. 2.1.2.1 Literature survey on handling, rollover and stability Horiuchi et. al. (1989) determined that drivers focus attention on yaw angle rather than on lateral position error, Ye, for steering a two-wheel active steering vehicle (2WS). For a four-wheel steer (4WS) vehicle, Ye becomes more important. Handling (steer response) is measured in terms of yaw rate and lateral acceleration for handling characteristics of four wheel active steering vehicles over a full manoeuvring range of lateral and longitudinal accelerations (Masato, 1989). Sharp and Pan (1991) comment that a vehicle that exhibits no body roll in general has better steering behaviour than one that rolls. Crolla et. al. (1998) obtained data using the ISO defined steady state, step input (J-turn) and impulse steer tests (International Standards Organisation, 1982 and 1988). Metrics used for their subjective/objective driver-handling correlations include: peak lateral acceleration response time, peak road wheel steer angle and road wheel steer angle response time, and peak steering angle torque and steering angle torque response time. The authors conclude that frequency response results (lateral acceleration gain, yaw gain, steering gain, steering phase) are of greater value in assessing vehicle response than has to date been proven to be the case. These metrics, along with the change in sideslip with respect to the change in lateral acceleration, were rated by drivers as uniform and unequivocal indicators of steering response required. From an investigation on the correlation between the different metrics, the authors found that, over smooth roads, the degree of roll angle correlates with lateral acceleration gain; yaw gain and peak roll rate and response. The degree of roll angle in transient cornering correlates with lateral acceleration phase and yaw rate in a J–turn and steady state roll angle at 2 m/s2. Controllability during a single lane change correlated with the J-turn yaw rate response at 2 m/s2 lateral acceleration (Crolla et. al., 1998). From these studies it can be concluded that the degree of roll angle is indicative of the lateral acceleration and yaw rate, which are both effective inputs for driver response. Lateral transient response to step input is a frequently adopted measure for assessing handling characteristics according to Reichardt (1991). Since rollover is to an extent related to handling, although handling capability and rollover aptitude is not similar, rollover considerations as deducted from the National Highway Traffic Safety Administration (NHTSA) survey were investigated (National Highway Traffic Safety Administration, 2000). In a proposed rulemaking exercise NHTSA was considering a safety standard “that would specify minimum performance requirements for the resistance of vehicles to rollover in simulations of extreme driving conditions". The conclusion was that “vehicle rollover response is dominated by the vehicle’s rigid body geometry with dynamic contributions from suspension effects.” Analysis of 100 000 single-vehicle rollover crashes eventually focused on two static measurements: tilt table angle (the angle at which a vehicle will begin to tip off a gradually tilted platform) and critical sliding velocity (the minimum velocity needed to trip a vehicle which is sliding sideways) – both measurements address situations in which
THE RIDE COMFORT VS. HANDLING COMPROMISE
2.6
a vehicle encounters something that trips it into rollover (a curb, soft dirt, the tyre rim digging into the pavement). Taking safety objectives into account, the following vehicle stability metrics were considered as having a potentially significant role in rollover: centre of gravity height, static stability factor, tilt table ratio, side pull ratio, wheelbase, critical sliding velocity, rollover prevention metric, braking stability metric and percentage of total weight on the rear axle (National Highway Traffic Safety Administration, 2000). The following aspects were considered by NHTSA for rollover rating: a) Static stability factor (SSF): This is the present static rollover rating calculated by taking half a vehicle’s track width divided by its centre of gravity height. b)
J-turn & Fish hook manoeuvres: In order to inform the public about a vehicle’s stability with specific reference to rollover, NHTSA has chosen the J-turn and the fishhook manoeuvre to rate a vehicle’s performance. “They are the limit manoeuvre tests that NHTSA found to have the highest levels of objectivity, repeatability and discriminatory capability.” The intention is that “vehicles will be tested in two load conditions, using the J-turn at up to 97 km/h and the fish hook manoeuvre at up to 80 km/h”. “Light load conditions will be provided by the test driver who will be the test vehicle’s sole occupant. Heavy load conditions will be created by adding a 79.5 kg mannequin to each rear seating position”. “The dynamic manoeuvre test performance will be used to rate resistance to untripped rollovers on a qualitative scale such as A - for no tip-ups, B - for tip-up in one manoeuvre, C - for tip-ups in two manoeuvres etc.” (National Highway Traffic Safety Administration, 2000) “The reverse steer of the fishhook manoeuvre will be timed to coincide with the maximum roll angle to create an objective ‘worst case’ for all vehicles regardless of differences in resonant roll frequency".
In response to NHTSA’s request for development of a dynamic test for rollover resistance (National Highway Traffic Safety Administration, 2000), the following limiting values for good rollover resistance were mentioned by General Motors: a) quasi-static centrifuge test tip-up threshold of at least 0.9g; b) maximum lateral acceleration in a circular driving manoeuvre of at least 0.6g; and c) a stability margin (a)-(b) at least 0.2g or 1.5/wheelbase [units in m2]. GM estimated that a centrifuge measurement of 0.9g would correspond to a SSF of 1.06. NHTSA however, estimated the centrifuge measurement as corresponding closer to a SSF of 1.00, based on comparisons with tilt table tests with an allowance for the vertical load error inherent with the tilt table. Ford (National Highway Traffic Safety Administration, 2000) suggested lane change manoeuvres producing a maximum lateral acceleration of 0.7g. In the same survey NHTSA posed the question: Should measures of vehicle handling be reported so that consumers can be aware of possible trade-offs? What indicators of vehicle handling would be appropriate to measure, and how should this consumer information be reported? The following responses are documented: a)
Steady state lateral acceleration and lateral transient response: Nissan recommended that NHTSA measure handling rather than rollover resistance, on the basis that the fishhook test may be too severe for the purposes of consumer information, and that Nissan had no data regarding the correlation of fishhook test
THE RIDE COMFORT VS. HANDLING COMPROMISE
2.7
performance to real-world crashes. It suggested a steady state lateral acceleration test and a lateral transient response test. b)
The following comments based on ISO 3888 Part 2 (International Standards Organisation, 2002) were made: • Optimised cornering capability and “limit condition performance". Daimler-Chrysler addressed the question directly by stating that its recommended ISO 3888 PART 2 test does not give incentives for negative trade-offs, but rather encourages optimised cornering capability and “limit condition performance” by giving lower ratings for “bad handling”. In its recommendation of the ISO 3888 PART 2 test, Continental-Tyres actually described it as a handling test. • Entry speed and peak-to-peak yaw rate. Toyota suggested using the ISO 3888 PART 2 test as a handling test with both entry speed and peak-to-peak yaw rate as performance criteria. The peak-topeak yaw rate would reflect on the yaw stability of the vehicle. • Centrifuge and steady state lateral acceleration tests. General Motors also recommended the centrifuge test, but suggested combining its results with a driving test of steady state maximum lateral acceleration to create a stability margin and set a lower limit for handling. In addition to static and dynamic rollover resistance tests, a steady state lateral acceleration test on a ski pad and “track-type tests to assess the vehicle’s controllability, response and grip” is also recommended. • Evaluation of double lane change Daimler-Chrysler, Mitsubishi, Volkswagen, BMW and Continental-Tyres recommended the ISO 3888 PART 2 closed-loop tight double lane change test as the best dynamic rollover test, but also described it as a handling test. Toyota, University of Michigan Transport Research Institute, Nissan, Volkswagen and Ford recommend a separate handling test distinct from the rollover rating with particular emphasis on yaw stability and Electronic Stability Control. • Double lane change vs. fishhook and J-turn. Although all rollover resistance manoeuvres are influenced by both a vehicle’s handling characteristics and its resistance to tip-up, it appears that handling dominates the double lane change manoeuvres but is less important for the JTurn and Fishhook manoeuvres. The double lane change manoeuvres are better for studying emergency vehicle handling than rollover resistance. Clean runs of the CU and ISO 3888 tests are not limit manoeuvres in the sense of the J-Turn and Fishhook because they cannot measure tip-up after the vehicle’s direction control is lost. One way to characterize manoeuvres is by the number of major steering movements they involve. The J-Turn has just one major steering movement, the initial steer. A Fishhook has two major steering movements, the initial steer and the counter steer. A double lane change has four major steering movements, the initial lane change steer, the second lane change steer, the recovery steer, and the stabilization steer, plus some minor steering movements. These additional major steering movements increase the influence of handling for Double Lane Change results compared to J-Turn and Fishhook manoeuvres. • Highest clean run.
THE RIDE COMFORT VS. HANDLING COMPROMISE
2.8
NHTSA comments: "double lane change manoeuvres scored on the basis of highest “clean” run speed had no value as dynamic tests of rollover resistance". For a sample of test vehicles, there was actually an inverse relationship between double lane change speed scores and the incidence of tipup in more severe manoeuvres that induced tip-up. The test vehicle that tipped-up the most often in other manoeuvres and at a consistently lower tipup speed than other test vehicles, would be rated the best vehicle for rollover resistance by ISO 3888 Part 2 double lane change on the basis of maximum clean run speed. These tests measure a type of handling performance but do not measure rollover resistance”. Holdmann & Holle (1999) use effective dynamic wheel loads as a measure of driving safety. By taking into account the RMS values of the dynamic loads, a hard damper system assures driving comfort as well as driving safety up to 4 Hz. A soft damper system assures good results for both at frequencies from 4 to 8 Hz. At higher frequencies, a soft damper minimises body movement and a hard damper minimises dynamic wheel loads. They state that different damping systems have a very small effect on lateral dynamics. Choi et. al. (2001) indicate pitch motion and roll angle as measures of steering stability in the evaluation a semi-active Electro Rheological suspension system. For experimental comparison of passive, semi-active on/off and semi-active continuous suspensions, Ivers and Miller (1989) use RMS tyre contact force as an indication of wheel hop and road holding capability. Data and Frigero (2002) note that it is possible to obtain valid objective indications of vehicle handling behaviour by comparing subjective evaluations by drivers of steady state circular tests, step steering wheel input and double lane change with objective parameters. This resulted in the following objective parameters being proposed as representative of vehicle behaviour: • Lateral acceleration versus steering wheel angle, • Yaw velocity versus steering wheel angle, • Lateral acceleration versus yaw velocity, • Roll angle versus lateral acceleration and • Sideslip angle versus steering wheel angle. Parameters, which are considered functions of lateral acceleration, are standardised with respect to steering wheel activity, which is strongly influenced by driver activity. The objective parameters representative of vehicle behaviour are the values of the regression lines and their angular coefficients at 0.4 g lateral acceleration. It was found that there is no correlation between a single partial rating and a single objective indicator. Linear combinations of the objective indicators were used to find a maximum regression coefficient. This resulted in a series of equations called partial indices that predict a subjective rating, given objective parameters as input. From this paper the most important parameters related to handling performance are roll angle, lateral acceleration and roll velocity, which are related to steering wheel angle, yaw velocity and lateral acceleration. In its presentation of rollover propensity testing of light vehicles (Forkenbrock and Garrot, 2001), NHTSA suggests measuring steering wheel angle during a simple step steer test, a J-turn and a fishhook turn; measuring dynamic weight transfer during a
THE RIDE COMFORT VS. HANDLING COMPROMISE
2.9
double lane change and measuring the roll rate for a steering rate of 1000 o/s in a J-turn and for 720 °/s during a fish hook turn. In his studies of the onset of rollover, Dahlberg (2000) states that for the detection of instability the most frequently used method is in-vehicle measurement of lateral acceleration, followed by comparison to the steady state rollover threshold (SSRT) where the accelerometer is mounted on the front axle. SSRT is considered the maximum value of lateral acceleration that the vehicle may resist during steady state driving not to roll over. It is a sufficient but not necessary requirement for rollover to occur. The static stability factor (SSF) = ½ (average front and rear track width) divided by total centre of gravity (cg) height, is a first order approximation to SSRT. It is the least conservative estimation of rollover propensity and thus predicts a higher threshold. SSRT becomes smaller as more flexibility is introduced in the analysis (suspension compliance, lateral shift of cg, flexibility of tyres, chassis and frame flexibility). Another approach, taking roll and roll moment into account in addition to lateral acceleration, gives a better understanding of individual axle roll resistance. From such information it can be determined that the vehicle can roll over when the lateral acceleration is larger than the value corresponding to wheel lift. Rollover does not take place during steady state driving, but during transient manoeuvres. SSRT is a best-case measure of roll stability, whereas a worst-case measure is needed. Therefore the Dynamic Rollover Threshold is defined being the minimum absolute peak value of lateral acceleration of all manoeuvres bringing the vehicle to rollover. This defines a worst-case measure of roll stability. It is a necessary but not sufficient condition for rollover. Garrot et. al. (2001) describe experiments to determine untripped rollover propensity. Different categories of vehicles are used – passenger cars, light delivery vehicles, vans and sport utility vehicles. Vehicle characterisation is done by means of manoeuvres designed to determine fundamental handling properties. For vehicles with relative higher rollover propensity, measures are designed to produce two-wheel lift off. Vehicle characterisation manoeuvres include: pulse steer, sinusoidal sweep, slowly increasing steer and slowly increasing speed (at constant steering angle up to 0.7 g lateral acceleration). Rollover propensity is determined from the following manoeuvres: J-turn, J-turn with pulse braking, a Fishhook manoeuvre using a fixed 270 degree initial steering input, a Fish hook manoeuvre using an initial steering angle 7.5 times the overall steering ratio of a given vehicle and resonant steer. They relate the degree of lift off (minor, moderate, major) and vehicle manoeuvring steer score, to rollover stability metrics (SSF, tilt table ratio and critical sliding velocity). Uffelman (1983) relates handling to the steering factor, p, calculated using the following equation: C l p = αf f (2.1) C αr l r where: Cαf is the cornering stiffness of the front tyres, Cαr is the cornering stiffness of the rear tyres, lf is the distance from the front axle to the centre of gravity and lr is the distance from the rear axle to the centre of gravity.
The limit of handling instability is considered at the point of a level tangent of the steering wheel angle versus the acceleration graph. Uffelman considers performance
THE RIDE COMFORT VS. HANDLING COMPROMISE
2.10
characteristics for quasi-steady-state cornering and braking. He shows that for a passenger car the ratio p and steering wheel angle increase sharply for a lateral acceleration around 5 m/s2 for braking at 1m/s2 and between 4 and 5 m/s2 for braking between 2 and 4 m/s2 where the limit of adhesion is approached. These limits are dependent on braking balance and load conditions. El-Gindy and Mikulcik (1993) indicates that yaw rate gain (ratio of yaw rate to steering angle) increases with increasing speed. The sensitivity of yaw rate gain to steering input frequency increases with increasing speed, but the sensitivity to and increase in speed, decreases as speed increases. The effect of mass, moment of inertia, front and rear cornering stiffness and location of centre of gravity is also addressed. They conclude that the strongest parameter on the yaw rate gain is the location of the centre of gravity. The cornering stiffness of the front wheels has a more pronounced effect than the rear cornering stiffness. Starkey (1993) derives yaw rate and sideslip frequency response for a highway vehicle from a yaw-plane handling model valid in the linear range.
Suspension technology capable of reconciling handling, stability and ride comfort has been designed by Toyota Motor Company. The front and rear suspension settings react to the lateral force input to the tyres (Kizu et. al. 1989). In order to objectively evaluate handling performance, Harada (1997) derives stability criteria for typical lane change cases and running against cross winds, applying a linear preview control model to the driver and a bicycle model of the vehicle. The performance index is composed of the weighted mean square values of state variables such as the course deviation, steering correction angle, yaw velocity and lateral velocity. Stability criteria consist of the steering control gain and steering time constant, which are obtained numerically for a closed loop system by the Hurwitz criteria. In his survey of the handling performance of truck-trailer vehicles, Vlk (1985) mentions the following criteria that were used: lateral stability and movement, Hurwitz criterion for stability, yaw angle, lateral displacements in tyre road contact paths, lateral play at the hitch, side amplitude of trailer, frequency of trailer yaw oscillations, yaw rate gain, lateral axle deviation, side slip angle, overturning risk, lateral acceleration, change of wheel vertical loads, longitudinal tyre slip and cornering forces as a result of directional response due to braking. He also mentions experiments by Zhukov who ascertained that the roll rotation of a trailer was accompanied by a lateral displacement of both truck and trailer from their direct path. The most outstanding correlation found was between trailer roll and yaw. EL-Gindy and Ilosvai (1983) mention a study of Yim et. al. that indicated that the slipratio of the front wheels relative to that of the rear wheels correlated with stability. ElGindy investigated lane change and braking manoeuvres on dry and wet asphalt and uses lateral acceleration, yaw rate, lateral displacement and heading angle to determine stability.
It is apparent from this survey that measurement of vehicle handling is not a clear-cut matter. The aim of the survey was to determine whether a metric existed that could be used to decide when a switch over from a soft to a hard suspension setting and vice versa
THE RIDE COMFORT VS. HANDLING COMPROMISE
2.11
should occur. It should also be such that it can be used to optimise the suspension settings. It is concluded from the information presented here that no such unambiguous metric is apparent. Different authors use a variety of different metrics. There are, however, some parameters that are worth considering. For example, the use of roll angle is frequently encountered. These frequently encountered parameters were used to direct the experimental investigation discussed in paragraph 2.1.2.3. 2.1.2.2 Handling tests
Handling tests can be divided into two main categories namely steady state handling tests and dynamic handling tests (also called transient response tests). The most widely used steady state handling test is the constant radius test, where the vehicle is driven around a circle with constant radius (e.g. a dry skid pan). The most important parameters that need to be measured are steering wheel angle and lateral acceleration. The test starts at the lowest speed the vehicle can drive smoothly. Speed is gradually increased until the constant radius cannot be safely maintained. A graph of lateral acceleration against vehicle speed is used to determine whether the vehicle exhibits oversteer (negative gradient), understeer (positive gradient) or neutral steer (zero gradient) behaviour (Gillespie, 1992). Variations on this test method are the constant steering angle test (where speed and radius changes) and the constant speed test (where steering angle and radius changes). Dynamic handling tests can be either closed loop where a human driver tries to steer the vehicle through a prescribed path, or open loop where the steering angle vs. time is prescribed. Closed loop tests include the severe double lane change test (ISO 3888-1, International Standards Organisation, 1999), obstacle avoidance test (ISO 3888-2, International Standards Organisation, 2002) and “Moose” or “Elk” test (Birch, 1998). Open loop tests can be performed either by an experienced test driver or a computer controlled steering robot. These include the J-turn (Garrot et. al., 2001), Fishhook (Garrot et. al., 2001), step steer and pulse steer tests (ISO 7401, International Standards Organisation, 1988). 2.1.2.3 Experimental investigation of handling
In previous simulation studies by Els and Uys (2003) it was shown that measurements of roll angle could be used for optimisation of suspension settings. Choi et. al. (2001), Data & Frigero (2002) and Crolla et. al. (1998) also refer to roll angle as a measure of handling, as does the NHTSA survey and Vlk (1985) (see section 2.1.2.1). Other parameters that have prominence in handling quality measurements are lateral acceleration, dynamic weight transfer, roll rate, maximum entry speed to a clean run on a double lane change and peak to peak yaw rate. Since dynamic weight transfer is very dependent on the tyre model used in simulations and direct measurement poses complications, this property is disregarded. For suspension control it is argued that in general drivers do not drive vehicles at their performance limits, since they are not trained to do so. Preferably parameters should be sought that can be measured during regular offroad driving, on highways and over mountain passes requiring greater handling skills. Also, experience with the optimisation of suspension settings for both handling and comfort, has indicated that convergence to an optimum can readily be obtained if optimisation is first performed with respect to handling and then with respect to ride
THE RIDE COMFORT VS. HANDLING COMPROMISE
2.12
comfort, with boundaries set on the handling parameters (Els and Uys, 2003). These limits of secure handling, as experienced by drivers, have not been quantified as in the case of comfort (see paragraph. 2.1.1). With this background, an experiment was designed in which three vehicles were test driven by four drivers. The vehicles consisted of a Ford Courier LDV, a Volkswagen Golf 1 Chico and a Volkswagen Golf 4 GTI. The drivers included a man in his twenties, a woman in her forties, a man in his thirties and one in his forties. The vehicles were equipped with accelerometers, displacement sensors, roll angle sensors and equipment to measure speed. The measurements taken are indicated in Table 2.1. Measurements were taken on two tracks at the Gerotek Test Facility outside Pretoria in South Africa: a ride and handling track and a dynamic handling track for light vehicles. A single run on a rough track representing off-road conditions was also performed. These tests are considered preliminary to establish a procedure and base of comparison for future tests that may also include a constant radius and double lane change test and will be supported by a larger number of drivers. Table 2.1 - Summary of measurements Instrument Accelerometer
Position Front centre
Accelerometer
Right rear
Accelerometer
Left rear
Angle sensor Gyro Displacement Speed sensor
Measurement Lateral acceleration Longitudinal acceleration Vertical acceleration Lateral acceleration Longitudinal acceleration Vertical acceleration Lateral acceleration Longitudinal acceleration Vertical acceleration Roll angle Yaw angle Roll rate Yaw rate Pitch rate Steering wheel angle Longitudinal speed
The Ride and Handling Track, of which a plan view is indicated in Figure 2.3, was designed to evaluate the ride and handling characteristics and driveline endurance of wheeled vehicles. The track is 4.2 km long and has 13 left turns and 15 right turns. The maximum gradient on the low mobility course used for the tests is 15%. The Dynamic Handling Track for light vehicles, indicated in Figure 2.4, was designed to evaluate the high speed handling characteristics of light vehicles. The track is 1.68 km long (excluding the spiral curve) and has an asphalt surface. The coefficient of friction is 0.7 Scrim (average). The track consists of a wave curve, trapezium curve, spiral curve as well as a kink/hairpin combination. 2.1.2.4 Results of experimental investigation
The results of the experimental investigation into the development of handling criteria will be discussed in more detail (Uys, Els and Thoresson, 2006). All measured data was filtered with a 4 Hz low-pass filter so that only low frequency dynamics were observed. The 4 Hz limit was also used because that is the specified frequency response limit of the
THE RIDE COMFORT VS. HANDLING COMPROMISE
2.13
roll angle sensors used. Due to the large number of graphs, the graphs are given in Appendix A and only the main conclusions are represented here. Figures A-1 to A-4 in Appendix A refer to dynamic handling performance of a Volkswagen Golf 4 GTI as related to two different drivers. Figures A-5 to A-16 are concerned with the performance of the different vehicles, considering all the drivers, in order to obtain a global impression of vehicle performance on both the dynamic handling and ride and handling tracks. Only the results of the Courier and GTI are shown since these indicated the lowest and highest performance levels. Figures A-17 and A-18 show some results of tests performed on a Land Rover Defender 110. Unfortunately, roll angle sensors were not installed on the Land Rover. The Land Rover data is included to determine if the same trends as those observed for the other vehicle tests apply. The figures relate lateral acceleration, yaw rate and vehicle speed. Figures A-1 and A-2 indicate measurements for the VW Golf 4 GTI on the ride and handling track for two different drivers. The trends in the relationships of longitudinal acceleration vs. lateral acceleration, yaw rate vs. roll angle, yaw rate vs. lateral acceleration and roll angle vs. lateral acceleration, are the same. This has been verified for the other drivers as well. The limiting values do however differ. For example the upper limit of the lateral acceleration is significantly higher for driver A than for driver B. The same trends are also observed for different vehicles on different tracks, although the absolute values differ (compare Figures A-5, A-6, A-11, A-12 and A-17).
Figure 2.3 – Ride and Handling track
THE RIDE COMFORT VS. HANDLING COMPROMISE
2.14
Climbing curve R 80
Wave curve R 15
R 75
High speed sweeps
Trapezium curve
R 130
R 100
Spiral curve
R 130 R 22.5
Workshop Parking area
R 22.5
Kink / hairpin combination Figure 2.4 – Dynamic handling track – light vehicles
Referring to the yaw rate vs. roll angle, yaw rate vs. lateral acceleration and roll angle vs. lateral acceleration graphs in Figures A-1 and A-2, linear dependency is observed. The linear dependency amongst the indicated parameters holds true for: i)
Different drivers (Figure A-1 compared to A-2),
ii)
Different vehicles (Figure A-5 compared to Figure A-11 and Figure A-6 compared to Figure A-12, refer also to Figure A-17 for yaw rate vs. lateral acceleration)
iii)
Different test tracks (Compare Figures A-5 and A-6 and Figures A-11 and A-12).
Differences in gradients amongst the vehicles can be attributed to differences in suspension roll stiffness. This effectively means that the same levels of lateral acceleration can result in different roll angles for different vehicles, depending on spring, damper and anti-rollbar characteristics as well as other vehicle parameters such as suspension kinematics, centre of gravity height etc. This is especially true for off-road vehicles with high centres of gravity that will normally roll over before the limits of tyre side force are reached. In these vehicles, body roll and rollover propensity is more important than the ultimate lateral acceleration that can be generated by the tyre forces. The limiting hyperbolic tendency between lateral acceleration and vehicle speed is apparent from Figures A-5, A-6, A-11 and A-12 (see “envelope in figures), confirming the applicability of the handling control based on these limits (Hirose et. al. 1988).
THE RIDE COMFORT VS. HANDLING COMPROMISE
2.15
The non-linear tendency between yaw rate and lateral acceleration for the Ford Courier on the dynamic handling track (Figure A-5), is attributed to side-slip of the rear wheels, since the vehicle exhibits considerable understeer behaviour that goes into limit oversteer. Limited test results that were available for a Land Rover Defender 110 were also analysed (Figures A-17 and A-18) and similar trends were observed. The lateral acceleration and roll angle histograms (Figures A-3, A-4, A-7 to A-10, A-13 to A-16 and A-18) indicate more clearly the limits in lateral acceleration and roll angle achieved on the various tracks by the different vehicles and drivers. It is clear from Figures A-3 and A-4 that driver A spent more time at the vehicle limits, while driver B kept within safer boundaries. The difference in limiting values for the different vehicles, drivers and tracks can also be observed. The limits are thus related to the track, driver and vehicle properties. More noise is observed on the ride and handling track than on the dynamic track. The irregular surface and bumps induce more high frequency motion. No relation similar to that observed for yaw rate, lateral acceleration and roll angle is observed for roll rate. The limiting values relating to the tracks on which the tests were performed are listed in Table 2.2. Table 2.2 - Limiting parameter values (all vehicles and all drivers) Parameter Roll angle [°] Lateral acceleration front centre [g] Roll rate [°/s] Yaw rate [°/s] Steering angle [°] Vehicle speed [km/h] Longitudinal acceleration [g]
Ride and handling track -3.5 to +3.5 -1.4 to +1.0 -32 to +32 -35 to +35 -60 to +130 0 to 120 -0.8 to +0.4
Dynamic handling track -2 to +2 -1 to +0.7 -10 to +15 -32 to +35 -48 to +48 0 to100 -0.1 to +0.5
Lateral acceleration is often considered by analysts as a measure of handling performance. The observed relationship between lateral acceleration and roll angle can be verified by considering the moment distribution of a total vehicle about the roll axis during steady state cornering (Gillespie, 1992): Wh 1 /g ay, K φf + K φr − Wh 1 i.e. linear dependence determined by the roll stiffness.
φ=
(2.2)
Here ay is the lateral acceleration, Kφf is the front roll stiffness of the suspension, Kφr the rear roll stiffness, W the weight and h1 the distance from centre of gravity to the roll axis. 2.1.2.5 Conclusion from the handling investigation
A linear relationship between lateral acceleration and roll angle has been observed in the case of all drivers of different vehicles on a ride and handling as well as a dynamic handling track. The range of values of roll angle observed for the tracks referred, is between –3.5˚ and 3.5˚. The same levels of lateral acceleration result in different roll angles for different vehicles, depending on vehicle parameters. This is especially true for
THE RIDE COMFORT VS. HANDLING COMPROMISE
2.16
off-road vehicles with high centres of gravity that will normally roll over before the limits of tyre side force are reached. In these vehicles, body roll and rollover propensity is more important than the ultimate lateral acceleration that can be generated by the tyre forces. Although the maximum lateral acceleration that can be achieved by a vehicle during, e.g. a constant radius test, can be used as a measure of handling, at lower speeds the lateral acceleration will only be a function of the vehicle speed and the radius of the turn, and not of the vehicle suspension or tyre characteristics. Suspension and tyre characteristics will however influence the over- or understeer behaviour. If a vehicle was tested through e.g. a double lane change or constant radius test, at a speed below the maximum capability of the vehicle, the lateral acceleration will be essentially the same for a wide range of suspension characteristics, but the body roll angle will differ significantly. The tests conducted strongly suggest that roll angle is a suitable metric to measure the effect of suspension stiffness and damping on vehicle stability during handling tests. From previous results it is known that roll angle is also suitable for the optimisation of suspension settings given a prescribed road and manoeuvre. If levels of acceptable roll angle can be determined, this metric can be used as criterion to ascertain the moment of switchover for a semi-active suspension. Whether the value of the roll angle is a sufficient indicator to determine suspension settings on rough roads, remains to be verified. Although this study with four drivers and three vehicles is definitely not exhaustive, and does not include off-road vehicles driven over rough terrain, it substantiates the use of body roll angle as a measure of vehicle stability during handling tests. This result is sufficient for the requirements of this study. Future research should include tests on a larger number of vehicles and include more drivers to determine the limits of acceptable roll angle. 2.1.3
Ride comfort vs. handling
According to Harty (2003), controllable suspension systems must be designed to deliver improvements in ride comfort, handling and stability. These characteristics are to some extend in conflict with each other. It is also important that controllable systems give the maximum benefit for the smallest possible actuation forces or energy requirements. Karnopp (1983) states that for ride comfort, the suspension should isolate the body from high frequency road inputs. At lower frequencies the body and wheel should closely follow the vertical inputs from the road to improve handling. Resonance of the body and wheel should be controlled, so that these disturbances are not excessively amplified and so that wheel hop and loss of wheel contact with the ground can be avoided. The suspension must also control forces due to change in payload, forces from braking and cornering and aerodynamic forces. Wallentowitz and Holdman (1997) conclude that two spring stages are sufficient to overcome the compromise associated with passive systems. A soft spring is required to optimise ride comfort while a stiff spring is only used during cornering and braking when the soft spring will result in unacceptable body roll and pitch.
2.17
Body acceleration
THE RIDE COMFORT VS. HANDLING COMPROMISE
Constant damping rate Constant spring rate
• Sports car
Comfort
k c Active suspension goal area
Safety
• Passenger car
Dynamic wheel load
Figure 2.5 - Suspension design space according to Holdman and Holle (1999) Holdman and Holle (1999) investigate the possibilities to improve ride comfort and handling of a 3.5-ton delivery vehicle. They illustrate the compromise in terms of the graph given in Figure 2.5. Any passive system will only resemble one point on this graph and is thus always a compromise between comfort and safety. They use three different damping curves namely soft (2/3 of standard), standard and hard (1.5 times standard) and investigate various skyhook-derived strategies. They find that for the passive damper, damping should be high at frequencies below 4 Hz to ensure comfort and safety. Between 4 and 8 Hz, low damping gives best results for both comfort and safety. Above 8 Hz a soft damper improves comfort, but a hard damper improves safety (minimizes the dynamic wheel load). Different damping systems have a small effect on lateral dynamics (handling). Additional forces need to be applied between the body and the wheel as a function of lateral acceleration to reduce body roll angle. Karnopp and Margolis (1984) discuss the effects of a change in spring and damper rates on the transfer function of a single degree of freedom suspension system. It is said that changing the damping alone is not a very efficient way of stiffening or softening a suspension system. Changing the spring stiffness changes the natural frequency of the system but the asymptotic attenuation at higher frequencies stays the same. The study concludes that a system containing variable spring and damper rates can be very advantageous in improving ride comfort.
A vehicle suspension system must be designed to provide adequate damping over a range of driving conditions e.g. smooth and rough roads, laden and unladen conditions as well as good ride comfort and handling according to Hine and Pearce (1988). This leads to
THE RIDE COMFORT VS. HANDLING COMPROMISE
2.18
the well-known conflict between the maximum use of suspension working space for best ride comfort and the need to provide sufficient displacement for all road conditions and road surfaces. Their proposed solution is a two- or three-state semi-active damper with ride height control. According to Ikenaga et. al. (2000), vehicle suspension system performance is typically rated by its ability to provide improved road handling and improved passenger comfort. Automobile suspension systems using passive components can only offer a compromise between these two conflicting criteria by providing fixed spring and damper characteristics. Sports cars usually have stiff, harsh suspensions with poor comfort while luxury cars offer good ride but poor handling. This compromise has existed since the development of the first automobiles in the late 1800’s. Nell (1993) states that suspension design involves a compromise between two conflicting requirements. To ensure good support of the vehicle body, stability, handling and side wind stability a stiff suspension is required. Good vibration and shock isolation on the other hand requires a soft suspension. Soft suspension characteristics suffer drawbacks e.g. when the suspension working space is limited, frequent bump stop contact can occur. Large static position changes due to variations in vehicle load can also be a problem.
Many investigators therefore agree that ride comfort and handling requirements are often in conflict with each other. The two case studies that will be presented now analyses the spring and damper characteristics required for optimum ride comfort and handling stability as applicable to off-road vehicles. 2.2
Case study 1: Landmine protected vehicle
Els & Van Niekerk, (1999) perform evaluation of the ride comfort and handling of a heavy off-road military vehicle using DADS (Dynamic Analysis and Design System) software. The vehicle used for simulation is a 12-ton 4x4 military vehicle, designed for off-road use over very rough terrain. A photograph of the vehicle is shown in Figure 2.6.
The three-dimensional, multiple degree of freedom, non-linear DADS simulation model consists of 11 rigid bodies (vehicle body, 4 wheels, front axle, rear axle, ground, 2 front hubs and steering pivot). The wheels and hubs are connected to the axles using 7 revolute joints while axle locating rods and steering links are modelled using 10 sphericalspherical joints. Force elements consist of non-linear dampers, springs (linear and hydropneumatic, depending on simulation), bump stops, as well as a generic non-linear tyre model. The resulting model has 66 degrees of freedom but after adding joints, constraints and a driver model, 14 unconstrained degrees of freedom remain. These consist of the vehicle body displacements (lateral, longitudinal, vertical, roll, pitch and yaw), wheels (rotation), front axle (vertical, roll) and rear axle (vertical, roll). Non-linear spring, damper, bump stop and tyre characteristics are used. The vehicle is steered over a predetermined course by a simple driver model that estimates the lateral position error based on the yaw angle of the vehicle body at the current time step and the desired lateral position at the driver preview time of 0.6 seconds. The driver model is implemented using amplifiers, summers and input elements.
THE RIDE COMFORT VS. HANDLING COMPROMISE
2.19
Figure 2.6 - Photograph of vehicle used in simulation 2.2.1
Vehicle model
To make provision for controlling the semi-active spring-damper system in future simulation work, the DADS model is exported for use in Matlab/Simulink by defining plant inputs and outputs. By doing this, the complete non-linear DADS model is included as an S-function and solved in Simulink. In this case, the DADS model provides relative spring displacements, damper velocities and other parameters needed as inputs to the control algorithm. Simulink then calculates the spring and damper forces according to the control strategy and outputs these forces to the DADS model. 2.2.2
Terrain inputs
In this study, typical rough terrain inputs, such as a Belgian paving track, were used. Instead of performing only the normal straight line ride comfort simulation, the vehicle is also steered over the terrain in order to try and follow a predetermined course. A typical double lane change manoeuvre was performed over the Belgian paving.
THE RIDE COMFORT VS. HANDLING COMPROMISE 2.2.3
2.20
Results
Simulation was performed with different spring and damper characteristics in order to complete a sensitivity analysis. A severe double lane change manoeuvre, performed over Belgian paving at a vehicle speed of 60 km/h, was chosen as representative of high speed off-road driving on gravel roads and tracks. The speed of 60 km/h is close to the maximum double lane change speed achievable with the particular vehicle on a level paved surface. As the simulation included ride comfort, stability and handling, interpretation of the results are difficult and it is necessary to define certain performance criteria. For ride comfort, the vertical acceleration at the vehicle body’s centre of gravity was filtered using the BS 6841 Wb filter and the RMS value determined. Motion sickness dose values were determined in a similar fashion using the motion sickness or Wf filter. When driving in off-road conditions, body roll and pitch usually give the first indication that the vehicle speed is excessive. Furthermore, it is more difficult to brace the human body against roll and pitch motion than is the case for yaw or vertical motion. Stability and handling were therefore evaluated using the RMS roll angle, RMS roll velocity and RMS pitch velocity of the vehicle body. Two suspension configurations were simulated namely linear springs (see Table 2.3 for the stiffness and static deflection) as well as non-linear hydropneumatic springs (see Table 2.4). In both cases the damper force ratios (damper force normalised to the baseline damper force at any specific damper speed) were varied between 0.001 and 3. For both linear and hydropneumatic springs, 9 different spring and 12 different damper characteristics were simulated, giving a total of 108 simulation runs. The simulation results are presented as contour plots (Figures 2.7 to 2.10) where the horizontal axis represents the damper force ratio and the vertical axis the natural frequency (or stiffness) of the suspension system. The contours represent the percentage improvement in the respective values relative to that of the baseline suspension (damper force ratio of 1 and natural frequency of 1.2 Hz). The left hand bottom corners of the graphs (low spring and damper rates) have no contour lines since the suspension is so soft that the vehicle could not perform the double lane change manoeuvre and rollover occurred. Figures 2.7 to 2.10 represent the results for the linear springs but the trends are very similar for the hydropneumatic springs. Table 2.3 - Calculated spring stiffness for linear spring Natural Frequency [Hz] 0.6 0.8 1.0 1.2 1.4 1.6 1.8 2.0 3.0
Required spring stiffness [N/m] 33 034 60 276 97 486 146 671 210 800 294 324 404 095 551 123 3 985 988
Static deflection [m] 0.668 0.366 0.226 0.151 0.105 0.075 0.055 0.040 0.0055
2.21
THE RIDE COMFORT VS. HANDLING COMPROMISE Table 2.4 - Natural frequencies for hydropneumatic spring Static Gas Volume [Litre] 0.3 0.5 0.6 0.8 1.0 1.3 1.6 2.0 3.0
Natural Frequency [Hz] 1.51 1.20 1.10 0.96 0.86 0.76 0.69 0.62 0.50
Stiffness in Static Position [N/m] 255 100 146 280 120 550 89 200 70 780 54 050 43 710 34 830 23 100
Figure 2.7 indicates the relationship between natural frequency (spring stiffness) and damper force ratio on the ride comfort for the linear spring configuration. A maximum improvement of 55% is reached at a natural frequency of 1 Hz and damper force ratio of 0.2. The percentage improvement is calculated using Equation 2.3. % improvement =
(baseline value − new value) *100 baseline value
(2.3)
The trend indicates that further improvements in ride comfort may be possible at lower natural frequencies, but that the vehicle becomes unstable and rolls due to the handling manoeuvre. The best spring characteristic for ride comfort is therefore as low as can be tolerated from a stability and handling perspective. Although a reduction in damper force ratio improves ride comfort, a certain minimum damping level is required. A maximum improvement of 51% in the motion sickness dose value (not indicated) was achieved for the lowest natural frequency and highest damper force ratio. The motion sickness dose value was however much less sensitive to the damping value than to the natural frequency. It was expected that the motion sickness dose value should increase with a reduction in suspension natural frequency, but apparently this is offset by the improved isolation performance of the lower natural frequency suspension. Figure 2.8 indicates that a maximum pitch velocity improvement of 11% is achievable at a damper force ratio of 0.7 and natural frequency of 1.2 Hz. This is in close correlation to the ride comfort optimum although the improvement is not very significant in magnitude compared to the ride comfort improvement of 55%. A maximum improvement of 77% in roll angle (Figure 2.9) is achieved at a suspension natural frequency of 3 Hz. The roll angle improvement is insensitive to the damper force ratio as can be expected. The optimal characteristics for roll velocity (improvement of 32%) are achieved at a suspension natural frequency of 2 Hz and damper force ratio of 1.8 (see Figure 2.10). Both roll angle and roll velocity are therefore reduced by higher spring and damper characteristics although the trends indicate that there is little improvement after the spring and damper characteristics have been doubled from the base-line values. This is due to the increase in tyre deflection that occurs as the spring stiffness is increased.
THE RIDE COMFORT VS. HANDLING COMPROMISE
2.22
All the graphs shown are for the linear suspension configuration mainly due to the wider range of suspension natural frequencies that could be indicated. All the tendencies are however similar for the non-linear hydropneumatic suspension system.
Figure 2.7 - Improvement in weighted RMS vertical acceleration (ride comfort – linear spring)
The expected conclusion is made that ride comfort requires opposite characteristics to handling and stability. The suspension resulting in the best ride comfort, leads to rollover. This fact gives a good motivation for the use of a semi-active spring-damper system to improve both ride comfort and handling. The semi-active spring-damper system has to be designed with natural frequencies of approximately 0.6 and 2 Hz respectively while damper force ratios of 0.2-0.5 and 2.0 are required. It must be emphasised that these characteristics are for the passive suspension case only and may change when research on control strategies is continued. The results are also only valid as long as terrain inputs do not result in contact with the bump-stops. When bump-stop contact occurs, stiffer suspension may result in improved ride comfort. The semi-active hydropneumatic springdamper system can however adapt to these circumstances if a suitable control strategy is employed. Valve dynamics and response times may also affect the results. Although the simulation results indicate optimal values for the spring and damper characteristics, these characteristics may not always be obtainable on a practical vehicle suspension system because of certain physical constraints.
THE RIDE COMFORT VS. HANDLING COMPROMISE
Figure 2.8 - Improvement in pitch velocity (linear spring)
Figure 2.9 - Improvement in roll angle (linear spring)
2.23
THE RIDE COMFORT VS. HANDLING COMPROMISE
2.24
Figure 2.10 - Improvement in roll velocity (linear spring)
The maximum rebound damper force is limited by the pressure difference across the damper. When the pressure difference becomes so large that the pressure in the hydraulic strut approaches zero, then cavitation will occur. The oil will boil and apart from the physical damage that may result, the damper force will stay constant. The minimum damper characteristic on the other hand is limited by the flow loss through the channels and hydraulic valves. The sprung mass natural frequency of a quarter car suspension system is calculated by approximation according to equation 2.4. ⎛ ks ⋅ k t ⎞ ⎟ ⎜ 1 ⎜⎝ k s + k t ⎟⎠ fn = 2π M
(2.4)
= Sprung mass natural frequency [Hz] Where fn = Spring stiffness [N/m] ks = Tyre stiffness [N/m] kt M = Sprung mass [kg] For the vehicle under consideration, kt = 1 000 000 N/m and M = 2 250 kg. Table 2.3 indicates the required linear spring stiffness and static deflection for different natural frequencies. It is evident that in order to obtain a natural frequency of 3 Hz, the spring stiffness must be four times higher than the tyre stiffness while the static deflection of the spring is only 5.5 mm. This implies that the tyre will deflect significantly, negating the effect of the stiff
THE RIDE COMFORT VS. HANDLING COMPROMISE
2.25
spring. On the other hand, the static deflection of 0.668 m, required for a 0.6 Hz natural frequency, is also unreasonable. Similar limitations are applicable to the hydropneumatic spring except that the spring stiffness used for calculation of the natural frequency is linearised through the static suspension position. Table 2.4 indicates the natural frequencies calculated for different static gas volumes. An accumulator of 2 or 3 litre capacity is bulky and it is doubtful whether this will fit into the space envelope normally available on a vehicle. 2.2.4
Conclusions from Case Study 1
The results indicated that for best ride comfort, the damper force ratio should be between 20 and 50% of the baseline value and the natural frequency should be in the region of 0.6 Hz. For optimal stability and handling, the natural frequency should be around 2 Hz and the damper force ratio double the baseline value. These characteristics will be used as the starting point for determining the best “on” and “off” characteristics for a controlled, twostage semi-active hydropneumatic spring and damper system. It should however be noted that these values may differ for other vehicle speeds, terrain inputs or handling manoeuvres. The values might also be vehicle-specific. 2.3
Case Study 2: Land Rover Defender 110
A Land Rover Defender 110 vehicle was chosen for case study 2 as well as for the rest of the research discussed in this thesis. This vehicle is ideal due to the following reasons: i) A used vehicle in good condition could be obtained at an affordable price. ii) The vehicle has a good reputation for its off-road capability. iii) It is a “low technology” vehicle that greatly simplifies the required modifications. iv) The vehicle has a ladder frame chassis that makes it possible to easily modify mounting points for fitting a controllable suspension system. v) The design is square and boxy resulting in enough space in the wheel arches. vi) It is easy to mount different springs and dampers to the vehicle. vii) Considerable improvements in handling can be obtained. viii) The vehicle has a high center of gravity that should highlight the improvements offered by a controllable suspension system. ix) The vehicle is fitted with coil springs. The suspension is already located by links and bars, i.e. spring and damper characteristics can be changed without changing kinematics. The springs and dampers also perform no axle locating functions. 2.3.1
Vehicle model
In order to simulate the ride comfort and handling of the vehicle, a first order DADS simulation model, based on a combination of measured and estimated parameters for a Land Rover Defender 110 sports utility vehicle (see Figure 2.11), was developed. A second, more detailed model was later developed and is discussed in paragraph 2.4.
THE RIDE COMFORT VS. HANDLING COMPROMISE
2.26
Figure 2.11 - Land Rover Defender 110 vehicle
The DADS model has 81 degrees of freedom, but after adding joints, constraints and a driver model, 14 unconstrained degrees of freedom remain. These consist of the vehicle body displacements (lateral, longitudinal, vertical, roll, pitch and yaw), wheel rotations, front axle vertical displacement and roll and rear axle vertical displacement and roll. Nonlinear spring, damper, bump stop and tyre characteristics are used. The vehicle is steered over a predetermined course by a simple driver model which estimates the lateral positional error based on the yaw angle of the vehicle body at the current time step and the desired lateral position at a specified driver preview time. The driver model is implemented using amplifiers, summers and input elements. The basic components of the DADS model are summarized in Table 2.5. 2.3.2
Definition of “design space”
The upper limit of spring stiffness is limited by the tyre stiffness. If the spring stiffness becomes too high, the tyre stiffness will become dominant, negating the effect of the stiff spring. As tyre deflection increases, the lateral force capability will decrease as the tyre’s lateral stiffness decreases. The lower limit of the spring stiffness is limited by two factors namely motion sickness and restricted suspension movement (“rattle space”). If the spring stiffness is so low that the suspension natural frequency is well below 1 Hz, the incidence of motion sickness in the vehicle will increase. A softer spring will also require more travel than a stiff spring over the same terrain roughness. The upper limit for damper force in rebound is the cavitation of the oil when the pressure in the damper drops to the vapour pressure of the oil. There is no physical limit to compression damping, although the effect of the bulk modulus will increase and mechanical buckling of the damper rod may arise. The lower limit for damping is determined by the flow losses through the damper valves, valve block channels as well as friction. The coil springs on the baseline suspension were replaced with hydropneumatic springs where the spring stiffness is determined by the gas volume in the static position. Static gas volumes were varied between 0.01 litres and 3.0 litres. This gives a range of spring stiffness from about 10 to 0.1 times that of the baseline coil spring stiffness. To simplify the damper characteristics, the baseline damper force was scaled with a constant factor that varied between 0.5 (i.e., softer than baseline) up to 3 (3 times higher than baseline). Simulations were performed for 7 damper characteristics and 10 spring characteristics within these ranges, giving a total of 70 simulation runs.
2.27
THE RIDE COMFORT VS. HANDLING COMPROMISE Table 2.5 – Summary of the DADS simulation model Model entities
Components
Quantity
Spherical-spherical joints (5)
Vehicle body Wheels Front axle Rear axle Ground (fixed in space) Front hubs (left & right) Anti-rollbars Front wheels to front hubs Front hubs to front axle Rear wheels to rear axle Body torsional stiffness Anti-rollbar left and right Axle locating and push-pull rods, steering links
2 4 1 1 1 2 2 2 2 2 1 2 5
Revolute-revolute joint (1)
Radius rod
1
Revolute-spherical joints (2)
A-arm rear Panhard rod front Steering control input Forward speed Non-linear dampers Springs (choice of hydropneumatic and coil springs) Bump stops Generic tyres Body torsional stiffness spring Anti-rollbar stiffness Amplifiers Summers Inputs Steering angle limiter Output torques left and right
1 1 1 1 4 4 4 4 1 1 2 2 2 1 2
Vehicle forward speed
1
Rigid bodies (13)
Revolute joints (9)
Constraints (2) Force elements (18)
Control elements (9)
Initial conditions (1)
2.3.3
Simulation results
The DADS model was used to predict ride comfort and handling of the vehicle with different combinations of spring and damper characteristics. Simulation results were used to determine first order indications of the “best” soft and hard characteristics for both spring and damper. 2.3.3.1 Ride comfort
Ride comfort was simulated over a typical off-road terrain (Belgian paving block course) at a vehicle speed of 60 km/h. Ride comfort was evaluated using the vertical acceleration at the driver position (right front) as well as the left rear passenger position. The vertical acceleration was weighted using the British Standard BS 6841 Wb weighting filter and
THE RIDE COMFORT VS. HANDLING COMPROMISE
2.28
calculating a weighted root mean square (RMS) value. A three-dimensional plot of weighted RMS acceleration vs. spring static gas volume and damper scale factor, for the driver’s seat position, is indicated in Figure 2.12. The lowest acceleration levels (best ride comfort) are obtained with low damping (damper scale factor of 0.8) and soft springs (static gas volume > 0.5 litres). Motion sickness values do however increase with very soft springs (not shown). 2.3.3.2 Handling
Handling was simulated by performing a severe double lane change manoeuvre at a speed of 60 km/h for the same values of spring and damper characteristics used for ride comfort analysis. Maximum body roll angle was used as the evaluation parameter of handling and stability. Figure 2.13 indicates the results of the handling simulations. The smallest body roll angle is achieved with the stiffest spring (static gas volume of 0.01 litre) while the roll angle is insensitive to the damper scale factor as could be expected. The “best” suspension is therefore given by the highest possible spring stiffness. The areas where there are no data points on the graph are where the vehicle could not complete the lane change without rolling over. 2.3.3.3 Combined ride comfort and handling
The investigation was further extended by looking at a scenario where ride comfort and handling were simultaneously required. For this analysis, a double lane change was performed over the Belgian paving. The result is indicated in Figure 2.14. The infeasible area where the vehicle rolls over is now significantly enlarged. The suspension design is forced towards higher spring stiffness to keep the vehicle safe, at the expense of ride comfort. 2.3.4 Conclusion from Case Study 2
It is concluded that for best ride comfort, a soft suspension is needed and for best handling a stiff suspension is needed. This is in line with general design rules and was the motivation for initializing this research project. The simulation results do however indicate that for the hard suspension setting, a static gas volume of 0.1 litre and damping scale factor of between 2 and 3 is suitable and for the soft suspension setting, a gas volume of greater than 0.5 litre and a damping scale factor of 0.8 will be suitable first order values for the design. The high damper characteristic used in the design of the suspension system will therefore be between 2 and 3 times the baseline values, while the low damping should be less than 0.8 times the baseline value. This also confirms the results obtained for case study 1.
THE RIDE COMFORT VS. HANDLING COMPROMISE
Figure 2.12 - Results of ride comfort analysis
Figure 2.13 – Results of handling analysis
2.29
2.30
THE RIDE COMFORT VS. HANDLING COMPROMISE
Roll angle [°]
25
20
15
10
5 3 0 3
2 2.5
2
1.5
Damper scale factor
1
1 gas volume scale Gas volume [l] fact 0.5
0
Figure 2.14 – Combined ride comfort and handling 2.3.5 Follow-up work by Uys, Els & Thoresson
In case study 2, simulations were performed for 7 damper characteristics and 10 spring characteristics within specified ranges, giving a total of 70 simulation runs. Ride comfort simulation was only performed for one terrain profile at one speed. Handling was also simulated only for one handling manoeuvre (the double lane change) at one vehicle speed. This process was performed manually. The next logical step was to investigate the applicability of mathematical optimization techniques to the problem in an attempt to decrease the number of required simulation runs. This should enable the simulation of more terrain profiles at various speeds, as well as a more in-depth look at handling. Els and Uys (2003) optimise the handling of a vehicle, equipped with a hydropneumatic spring-damper suspension system, in conjunction with ride comfort. This is seen as a challenge due to the fact that the suspension characteristics determining ride comfort and handling respectively tend to oppose one another. The complexity and non-linearity of the dynamics of suspension systems impose further difficulty. Furthermore the suspension characteristics imply a large number of variables. The Dynamic-Q gradient-based optimisation method is used in conjunction with the dynamics simulation code DADS. Dynamic-Q is a robust and reliable algorithm particularly suitable for solving engineering optimisation problems. It applies an existing dynamic trajectory optimisation algorithm to successive spherical quadratic approximate sub-problems and can be used when analytical functions are not available and only discrete function values can be obtained via numerical simulation of engineering processes.
2.31
THE RIDE COMFORT VS. HANDLING COMPROMISE
22 20 18 16
Roll angle [°]
Ro 14 ll an 12 gle 10 8 6 4 2 0
0.5
1
1.5
2
2.5
3
Gas volume [l] gasvolum escalefactor
0.5
1
1.5
2.5 2 damper scalefactor
3
Damper scale factor
Figure 2.15 - Path followed by Dynamic-Q
The purpose of the investigation by Els and Uys was to determine whether the DynamicQ method is suitable for optimising the design of a vehicle suspension system modelled in DADS. Optimisation of the spring and damper characteristic was performed to obtain the best characteristics for handling on a smooth road, best characteristics for ride comfort while driving in a straight line and best characteristics for ride comfort and handling combined (performing a handling manoeuvre on a rough road). Thoresson (2003) builds on the work by Els and Uys (2003) and performs mathematical optimisation on a Land Rover Defender 110 vehicle looking at ride comfort and handling separately (Els et. al., 2003). His results are summarized in Table 2.6. Table 2.6 – Summary of results by Thoresson (2003)
Two design variables Four design variables Seven design variables
Handling Damper scale factor Spring static gas volume [l] 1.35 to 1.99 0.05 (lower limit) 1.5 to 3 front 0.1 (lower limit) 1.44 to 3 rear front and rear Low speed damping 0.1 (lower limit) must be high
Ride Comfort Damper scale factor Spring static gas volume [l] 0.11 to 0.37 1.44 to 3.0 0.18 to 0.48 front 0.1 to 0.35 rear Low speed damping must be high
1.32 to 2.08 front 1.6 to 2.18 rear 1.07 to 2.18
For the two design variable case, the spring static gas volume and damper scale factor were used as design variables. These factors were kept the same for both the front and
THE RIDE COMFORT VS. HANDLING COMPROMISE
2.32
rear suspensions. In the four design variable case, the scale factors for the front and rear suspension was allowed to differ. For the seven design variable case, the gas volume and damper characteristics were kept the same front and rear, but the damper was now approximated by a piecewise linear spline, altering low and high speed damping separately. For handling, all the cases required the stiffest spring allowed and damping that is between 35% and 300% higher than the baseline damping. Ride comfort required soft springs and damping that is lower than the baseline damping. 2.4
Validated vehicle model
The encouraging results obtained from case study 2 justified the development of an improved vehicle model that could be used to predict absolute values and not only trends as was the case with the first model. The fidelity of this model had to be good enough to accurately predict both ride comfort and handling. This model had to be combined with a model of the controllable suspension system and control system later in the project. 2.4.1
Geometric parameters
The majority of geometric parameters were obtained by physical measurement on a vehicle, although some critical measurements were obtained from available drawings. 2.4.2
Mass properties
Mass properties were obtained from physical measurements on a vehicle. The determination of the centre of gravity position, as well as estimation of the roll, pitch and yaw mass moments of inertia are described by Uys et. al. (2005). 2.4.3
Spring and damper characteristics
Spring, damper and bump-stop characteristics were obtained by removing the components from the test vehicle and determining force-displacement and force-velocity relationships respectively using Schenck Hydropulse test equipment. 2.4.4
Tyre characteristics
Tyre side-force vs. slip angle characteristics were obtained from measurements using a two-wheeled tyre tester towed behind a vehicle. The measured data was converted to the coefficients required for the MSC ADAMS Pacjeka ’89 tyre model. The tyres side-force vs. slip angle characteristics are indicated in Figure 2.16. 2.4.5
ADAMS full vehicle model
i) Front suspension Figure 2.17 indicates the layout of the front suspension system. The rigid axle is located longitudinally by leading arms connected to the vehicle body with rubber bushes. The stiffness of these bushes was measured and included in the ADAMS model. Lateral location of the axle is via a Panhard rod. The baseline vehicle is fitted with coil springs,
THE RIDE COMFORT VS. HANDLING COMPROMISE
2.33
translational dampers concentric with the coil springs and rubber bump stops. A steering angle driver is applied directly to the kingpin with a steering link connecting the left and right wheels. All other steering geometry is ignored in the model. The connections between the different components are indicated in Figure 2.18. To take the torsional stiffness of the ladder chassis into account, the vehicle body is modelled as two bodies connected to each other with a revolute joint along the roll axis and a torsional spring.
Figure 2.16 - Tyre side-force vs. slip angle characteristic
ii) Rear suspension The rear suspension consists of a rigid axle with trailing arms, an A-arm, coil springs, translational dampers mounted at an angle outside coil springs and rubber bump stops. The basic layout is indicated in Figure 2.19. An anti-rollbar is fitted to the rear suspension. The stiffness of the trailing arm rubber bushes is included in the ADAMS model. The schematic layout of the rear suspension is indicated in Figure 2.20. 2.4.6
Baseline vehicle tests
A Land Rover Defender 110 SUV was obtained locally for testing purposes. The aim of the baseline vehicle tests was to validate the ADAMS model of the vehicle. Tests were performed at the Gerotek Vehicle Test Facility West of Pretoria.
THE RIDE COMFORT VS. HANDLING COMPROMISE
Figure 2.17 – Front suspension layout
Figure 2.18 – Front suspension schematic
2.34
THE RIDE COMFORT VS. HANDLING COMPROMISE
2.35
2.4.6.1 Instrumentation
The instrumentation used for the baseline tests, as well as measurement positions, is indicated in Table 2.7. Table 2.7 – Instrumentation used for baseline vehicle tests No 1 2 3 4 5 6
Parameter Vehicle speed Relative displacement Relative displacement Relative displacement Relative displacement Roll velocity
7
Yaw velocity
8
Relative displacement
9 10 11 12 13
Acceleration Acceleration Acceleration Acceleration Pitch velocity
14 15 16
Kingpin steer angle Wheel speed Driveshaft speed
Position Roof Left front suspension Right front suspension Left rear suspension Right rear suspension Vehicle body between front seats Vehicle body between front seats (close to cg) Steering arm between axle and body Left front lateral Right rear vertical Left rear lateral Left rear vertical Vehicle body between front seats Kingpin Left rear wheel Gearbox output rear
Equipment VBOX GPS Penny&Giles rope displacement transducer Penny&Giles rope displacement transducer DWT rope displacement transducer DWT rope displacement transducer Solid state gyro Solid state gyro Penny&Giles rope displacement transducer Solid state accelerometer ±4g range Solid state accelerometer ±4g range Solid state accelerometer ±4g range Solid state accelerometer ±4g range Solid state gyro Potensiometer Turck Banner optical speed sensor Turck Banner optical speed sensor
2.4.6.2 Tests
The vehicle was evaluated for ride comfort over repeatable test tracks of various roughnesses at known, repeatable and representative speeds. Weighted root mean square vertical accelerations were used to quantify ride comfort. Figure 2.21 indicates the vehicle on the Belgian paving track during testing. Tests also included single discrete obstacles (locally known as an “APG” bump) as indicated in Figure 2.22. Vehicle handling was evaluated using a constant radius test (Figure 2.23) as well as a severe double lane change manoeuvre (Figure 2.24). Additional tests over typical off-road terrain were performed on the Gerotek rough track (Figures 2.25 and 2.26) where a combination of ride comfort and handling is required. The rough track consists of natural terrain features embedded in concrete to give repeatability. Test procedures and terrains were chosen to ensure repeatability. Vehicle speed was kept constant by driving the diesel engine against its governor. This is important, as the baseline test results will be used later to quantify the improvements offered by the controllable suspension system.
THE RIDE COMFORT VS. HANDLING COMPROMISE
Figure 2.19 – Rear suspension layout
Figure 2.20 – Rear suspension schematic
2.36
THE RIDE COMFORT VS. HANDLING COMPROMISE
2.37
Figure 2.21 - Belgian paving 2.4.7
Correlation between ADAMS model and test results
To validate the ADAMS model, simulation results were compared to measured results for two different tests namely the APG bump, and the ISO 3888 double lane change test. 2.4.7.1 Transient response (APG track)
The APG track was chosen to validate the vertical and pitch dynamics of the vehicle. The road input profile is easily measured and included in a simulation model. Figure 2.27 indicates the correlation obtained between the measured and simulated results. Correlation is indicated for pitch velocity, spring displacement right front (rf), spring displacement rear left (rl), steering displacement as well as front and rear vertical accelerations. Correlation for vertical accelerations is especially good which is important because vertical acceleration is a direct measure of ride comfort. The model is thus considered validated for ride comfort simulation. 2.4.7.2 Handling (ISO 3888 Double lane change)
Figure 2.28 indicates the correlation achieved for a double lane manoeuvre performed at 65 km/h. The speed for the baseline vehicle tests varied between 61 and 65 km/h. The steering input, as measured during baseline testing, was used to drive the vehicle and not the driver model. The graphs therefore represent the dynamic reaction of the vehicle to the same input conditions as during testing. Correlation is very good for all the measured parameters. The model is thus considered validated for handling simulation.
THE RIDE COMFORT VS. HANDLING COMPROMISE
Figure 2.22 - “APG” Bump
Figure 2.23 - Constant radius test
2.38
THE RIDE COMFORT VS. HANDLING COMPROMISE
Figure 2.24 - Severe double lane change manoeuvre
Figure 2.25 - Rough track
2.39
THE RIDE COMFORT VS. HANDLING COMPROMISE
Figure 2.26 - Rough track
2.40
THE RIDE COMFORT VS. HANDLING COMPROMISE
2.41
Figure 2.27 - Model validation results for passing over 100 mm APG bump at 25 km/h 2.4.8
Simulation results
The validated ADAMS model was modified by replacing the coil springs with hydropneumatic springs. As before the static gas volume was varied between 0.1 and 1 litre while the damper scale factor was varied between 0.5 and 3. The effect of spring and damper characteristics on ride comfort over the Belgian paving is indicated in Figure 2.29. The conclusion is made that for best ride comfort, the damping scale factor must be as low as possible and the static gas volume as large as possible although the improvement is negligible for gas volumes higher than 0.5 litre. For handling, a double lane change manoeuvre was again performed. In this case both the body roll angle and body roll velocity was used as a measure of handling and stability. Figure 2.30 indicates that the maximum body roll angle at the first valley, and maximum roll velocity at the first peak was used. Figure 2.31 indicates the maximum roll angle as a function of static gas volume and damper scale factor. The lowest maximum roll angle (best handling) is obtained with a static gas volume of 0.1 litre and a damper scale factor of 3. The maximum roll velocity (Figure 2.32) is more sensitive to the damper scale factor. This result was expected, as damping force is velocity dependant while spring force is displacement dependant. The results however point to a damper scale factor of 3.
THE RIDE COMFORT VS. HANDLING COMPROMISE
2.42
All these results indicate that the optimum characteristics for ride comfort and handling are at opposite corners of the design space. For good ride comfort, low damping and a soft spring is required. A damper scale factor of less than 0.5 and a static gas volume of 0.5 litre or more will give the best ride comfort. For best handling, a static gas volume of 0.1 litre and damper scale factor of 3 is required.
Figure 2.28 – Model validation results for a double lane change manoeuvre at 65km/h 2.5
Conclusion
The following is concluded based on the evidence presented in this chapter: a) b)
c)
A passive suspension system is a compromise between ride comfort and handling as the respective requirements for ride comfort and handling are at opposite ends of the design space. To eliminate the ride comfort vs. handling compromise, two discrete spring characteristics are required namely: • A stiff spring for best handling (0.1 litre static gas volume for hydropneumatic spring in the case of the test vehicle) • A soft spring for best ride comfort (>0.5 litre static gas volume for hydropneumatic spring in the case of the test vehicle). To eliminate the ride vs. handling compromise, two discrete damper characteristics are required namely: • High damping for best handling (greater than double baseline damping value) • Low damping for best ride comfort (less than ½ the baseline damping value).
THE RIDE COMFORT VS. HANDLING COMPROMISE
d) e)
2.43
The capability to switch between the two spring and the two damper characteristics is required. A control strategy that can switch between “ride comfort” mode and “handling” mode in a safe and predictable way is of critical importance.
Figure 2.29 – Ride comfort vs. gas volume and damping
Figure 2.30 - Definition of handling objective function
THE RIDE COMFORT VS. HANDLING COMPROMISE
Figure 2.31 – Roll angle vs. gas volume and damping
Figure 2.32 – Roll velocity vs. gas volume and damping
2.44