International liquidity provision and currency-specific liquidity shortages1
Richhild Moessner Bank for International Settlements William A. Allen Cass Business School February 2010 Abstract In this paper we discuss the main innovation in central bank cooperation during the financial crisis of 2008-09, namely the emergency provision of international liquidity through the establishment of bilateral central bank swap facilities, which have evolved to form interconnected swap networks. Based on the BIS international locational banking statistics, we present a measure of currency-specific liquidity shortages for the US dollar, the euro, the yen, the pound sterling and the Swiss franc for a large number of advanced and emerging economies. We discuss the reasons for establishing swap facilities, relate our measure of currency-specific liquidity shortages to the probability of a country receiving a swap line in that currency, and find a significant relationship in the case of the US dollar, the euro, the yen and the Swiss franc. We find that countries with larger US dollar shortages on our measure, and economies that are large international financial centres, have a statistically significantly higher probability of receiving a US dollar swap line. We also find that actual US dollar funding obtained by drawing on the Fed’s swap lines at end-2008 was statistically significantly larger for economies with higher US dollar shortages on our measure, as well as for economies which are large international financial centres. JEL classification: E58, G01, F31. Key words: International liquidity, central bank swap lines, FX swaps, lender of last resort
1
The views expressed are those of the authors and should not be taken to reflect those of the BIS. We would like to thank Naohiko Baba, Petra Gerlach, Corinne Ho, Harold James, Robert McCauley, Dubravko Mihaljek, Philip Turner and seminar participants at the BIS, Cass Business School and the London School of Economics for helpful comments. We would also like to thank Bilyana Bogdanova, Homero Goncalves and Swapan Pradhan for excellent research assistance. Any remaining errors are the responsibility of the authors.
1
1. Introduction The advent of the credit crunch in August 2007, and its subsequent intensification, have largely eroded the hitherto apparently sharp distinction between monetary and financial stability, and it led to a revival of central bank co-operation. In this paper we study the main innovation in central bank cooperation during the financial crisis of 2008-09, namely the establishment of bilateral central bank swap facilities, which have evolved to form interconnected swap networks. Obstfeld, Shambaugh and Taylor (2009, p.483) describe these facilities as ‘one of the most notable examples of central bank cooperation in history’. The credit crisis was initiated by a widespread, though not uniform or complete, loss of confidence in the creditworthiness of banks. It began suddenly in August 2007, and varied in intensity throughout the following year. Perceived counterparty credit risks increased sharply, owing to uncertainty about other banks’ credit exposures and the size of potential losses, and banks started hoarding liquidity. Spreads between Libor rates and Overnight Index Swap rates (OIS) widened and became highly volatile. The credit crisis damaged the functioning of all financial markets, including the wholesale deposit and foreign exchange swap markets (see Baba et al. (2008), Baba and Packer (2009), Allen and Moessner (2010)). The crisis became much more acute after the failure of Lehman Brothers in September 2008, which destroyed the widespread belief in financial markets that governments would not allow any systemicallyimportant financial institution to fail, and thereby dramatically heightened perceptions of credit risk among trading counterparties in financial markets. In many countries, banks had made loans in foreign currencies, particularly those currencies in which interest rates had been relatively low, notably the US dollar, the yen and the Swiss franc. They had financed those loans partly by taking deposits in the currency of the loan, typically in the international wholesale deposit market, and partly by taking deposits in their home currencies, and using the foreign exchange swap market to eliminate foreign exchange risk. When the credit crisis struck, it became much more difficult, or in some cases impossible, for many banks to secure foreign currency deposits in the wholesale markets. Even in domestic currency markets, the available range of maturities became much shorter. Many banks were forced to use the lending facilities of their home central banks to finance themselves. Such facilities were in normal times typically confined to their domestic currency and to short maturities. Therefore, in the absence of any new special facilities designed to help them, banks would have had to replace relatively long-maturity foreign currency financing of foreign currency assets with relatively short-maturity domestic currency financing. The financial market consequences would have made the disruption caused by the credit crisis substantially more serious, as described in Allen and Moessner (2010), and the main purpose of the swap networks was to avoid those consequences. Swap facilities can be used as a means of making the provision of central bank liquidity more effective by extending its geographical scope. Typically, central bank lending to domestic 2
commercial banks is denominated in domestic currency; but if the commercial banks need foreign currency liquidity, then something more is required if the central bank wants to address this need. Swap facilities enable a central bank to provide liquidity to domestic banks in foreign currency.2 In this paper we study the emergency provision of international liquidity through the establishment of bilateral central bank swap facilities, which have evolved to form interconnected swap networks. We present a measure of currency-specific liquidity shortages for the US dollar, the euro, the yen, the pound sterling and the Swiss franc for a large number of advanced and emerging economies, based on the BIS international locational banking statistics. We discuss the reasons for establishing swap facilities, relate our measure of currency-specific liquidity shortages to the probability of a country receiving a swap line in that currency, and find a significant relationship in the case of the US dollar, the euro, the yen and the Swiss franc. Moreover, we find that economies which are large international financial centres have a statistically significantly higher probability of receiving a US dollar swap line from the Federal Reserve, as well as from any country. We also find that actual US dollar funding obtained by drawing on the Fed’s swap lines at end-2008 was statistically significantly larger for economies with higher US dollar shortages on our measure, as well as for economies which are large international financial centres. The paper is organised as follows. Section 2 presents a measure of currency-specific liquidity shortages based on the BIS international banking statistics. Section 3 discusses central bank swap networks established during the financial crisis, and Section 4 studies the relationship between currency-specific shortages and central bank swap lines. Finally, Section 5 concludes.
2. Incidence of currency-specific liquidity shortages – evidence from the BIS international banking statistics. In normal market conditions, commercial banks can readily convert liquidity from one currency into another using foreign exchange swap markets. Thus a bank which is in need of foreign currency liquidity but can get only domestic currency liquidity can swap the domestic currency into foreign currency using the commercial swap market, selling the domestic currency spot and buying it forward. However, commercial swap market liquidity was seriously impaired during the credit crisis, partly by concerns about settlement risk, and currency-specific liquidity shortages developed in many countries. Currency-specific liquidity shortages occurred when commercial banks needed to replace foreign currency deposits (including deposits taken in wholesale markets) which had been sowithdrawn, but were not able to do so. A number of advanced and emerging economies 2
Alternatively, the central bank could use some of its own foreign exchange reserves for that purpose, converting them into the required currency if necessary by means of market transactions.
3
experienced currency-specific shortages as the financial crisis intensified.3 In principle, the size of the currency-specific liquidity shortage in any country is equal to the following: i.
Banks’ total liabilities in the currency in question minus
ii.
Banks’ total illiquid liabilities in that currency minus
iii.
The total funds in that currency that banks can raise from depositors, from their affiliates or from other providers, including central banks, or by means of asset sales.
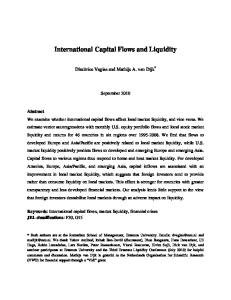
Item (i) minus item (ii) are the banks’ liabilities that need to be refinanced, and item (iii) is the funding that can be raised for this refinancing. The difference between the two, [(i)-(ii)]-(iii), is therefore the currency-specific liquidity shortage. In practice, none of these components is available in published statistics. The sizes of currency-specific liquidity shortages have to be estimated using such proxy data as are available. As a proxy measure of US dollar-specific shortages, Graph 2.1 shows the net outstanding US dollar cross-border claims on BIS reporting banks by the economies shown, defined as crossborder total liabilities minus claims (in both foreign and domestic currency) of all BIS reporting banks vis-à-vis banks located in the countries shown at end-2008. The corresponding proxy measure of euro-specific liquidity shortages is shown in Graph 2.2, and the corresponding measures for the yen, the pound sterling and the Swiss franc are shown in Graphs 2.3 to 2.5. Graph 2.1 Net outstanding US dollar cross-border claims on BIS reporting banks by economies shown1 In billions of US dollars, December 2008 200 100 0 –100 –200 –300
EA GB CA BR RU TR SE NO KR IN CL AU HU IS NZ PE PL RO ID LT BG EE LV MY CZ CO MX DK PH TH ZA AR TW VE CN JP SG HK CH 1
–400
AR=Argentina, AU=Australia, BR=Brazil, BG=Bulgaria, CA=Canada, CL=Chile, CN=China, TW=Chinese Taipei, CO=Colombia, CZ=Czech Republic, EE=Estonia, EA=Euro area, DK=Denmark, HK=Hong Kong SAR, HU=Hungary, IS=Iceland, IN=India, ID=Indonesia, JP=Japan, LV=Latvia, LT=Lithuania, MY=Malaysia, MX=Mexico, PE=Peru, NZ=New Zealand, NO=Norway, PH=Philippines, PL=Poland, RO=Romania, RU=Russia, SG=Singapore, ZA=South Africa, KR=South Korea, SE=Sweden, CH=Switzerland, TH=Thailand, TR=Turkey, GB=United Kingdom, US=United States, VE=Venezuela. Sources: BIS locational international banking statistics, authors’ calculations.
3
US dollar shortages have been analysed in McGuire and von Peter (2009).
4
On this measure, the largest currency-specific liquidity shortage was of US dollars in the euro area (around $400 bn). The next largest were the shortage of yen in the United Kingdom ($90 billion equivalent), that of euros in the United States (about $70 billion equivalent), and that of Swiss francs in the euro area (about $30 billion equivalent). There were only small shortages of pound sterling (with the largest being around $6 billion equivalent for Norway). Graph 2.2 Net outstanding euro cross-border claims on BIS reporting banks by economies shown1 In billions of US dollars, December 2008 250 200 150 100 50 0 –50 US SE NO RO DK HU PL CA AU TR LV LT CZ IS BG EE IN KR ID NZ BR PH ZA PE CO MY AR MX TW CL VE TH RU CN SG HK JP GB CH 1
–100
See Graph 2.1 for a list of abbreviations of economies.
Sources: BIS locational international banking statistics, authors’ calculations.
Graph 2.3 Net outstanding Japanese yen cross-border claims on BIS reporting banks by economies shown1 In billions of US dollars, December 2008 100
50
0
–50
GB US SG AU KR IN CA BR SE PL NO ID PH TH RU DK HU CL NZ TR IS CO MY LV CZ BG RO AR VE LT EE PE ZA MX CN TW EA HK CH 1
See Graph 2.1 for a list of abbreviations of economies.
Sources: BIS locational international banking statistics, authors’ calculations.
5
–100
Graph 2.4 Net outstanding pound sterling cross-border claims on BIS reporting banks by economies shown1 In billions of US dollars, December 2008 40 30 20 10 0
NO CA AU SE HU DK KR RO CO NZ LT ID PE BG CL EE LV PL CZ AR PH MX VE BR IS TH TW TR MY IN CN RU ZA SG JP US HK EA CH 1
–10
See Graph 2.1 for a list of abbreviations of economies.
Sources: BIS locational international banking statistics, authors’ calculations.
Graph 2.5 Net outstanding Swiss franc cross-border claims on BIS reporting banks by economies shown1 In billions of US dollars, December 2008 10
0
–10
–20
EA PL GB HU DK RO CA NO TR SE AU LT EE IS LV KR MX CZ IN RU NZ VE PH ID BG CO PE CL MY AR TH CN BR TW ZA HK SG JP US 1
–30
See Graph 2.1 for a list of abbreviations of economies.
Sources: BIS locational international banking statistics, authors’ calculations.
The measure used in Graphs 2.1 to 2.5 is based on the BIS locational international banking statistics by residence of counterparty. These statistics record the aggregate international claims and liabilities of all banks resident in the BIS reporting countries broken down by instrument, currency, sector, country of residence of counterparty, and nationality of reporting banks. Both domestic and foreign-owned banking offices in the reporting countries report their
6
positions gross (except for derivative contracts for which a master netting agreement is in place) and on an unconsolidated basis, ie including banks’ positions vis-à-vis their own affiliates4. There are several reasons why we base our measure of currency-specific shortages on these statistics. First, in a financial crisis gross positions can matter, including of banks vis-à-vis their subsidiaries, rather than just net positions. Many bank assets are normally illiquid. And head offices may be unable or unwilling to provide their subsidiaries with necessary liquidity during a crisis (indeed they might withdraw it)5. Moreover, because of differences in time zones, subsidiaries may not have timely access to liquidity from their head office. Secondly, our measure of currency-specific shortages is available for a wide range of countries, including many emerging economies which are not BIS reporting countries, and it is available for the US dollar, the euro, the yen, the pound sterling and the Swiss franc. By contrast, currency-specific net foreign positions of banks by nationality of head office based on the BIS locational international statistics by nationality of head office and the BIS consolidated international banking statistics6 (see McGuire and von Peter (2009)) are available only for a subset of BIS reporting countries, and only for the US dollar, the euro and the yen, but not the pound sterling or the Swiss franc.
3. Central bank swap networks The central banks’ response to currency-specific liquidity shortages was to set up swap facilities so that the home central bank of the currencies in short supply could provide those currencies to the commercial banks outside the home country that needed them. They did so indirectly, using as intermediaries the central banks of the commercial banks that were short of liquidity. In effect, they used foreign central banks to extend the geographical scope of their liquidityproviding operations7.
4
This is consistent with the principles of national accounts, money and banking, balance of payments and external debt statistics (see BIS (2008)). 5
Some countries’ supervisors would like the subsidiaries of foreign banks in their country to hold their own liquidity, because it would fall to the host country’s authorities to undertake any bail-out of subsidiaries of foreign banks. Moreover, it has been suggested that the unwinding of global banks in an emergency would be facilitated if their subsidiaries managed their own liquidity and funding needs, modelled on the example of some large global banks (eg HSBC) which are currently set up as holding companies (see Pomerleano (2009)). 6
The BIS consolidated international banking statistics provide information on the country risk exposures of the major banking groups of various countries vis-à-vis the rest of the world. The consolidated banking statistics report banks’ on-balance sheet financial claims vis-à-vis the rest of the world and provide a measure of the risk exposures of lenders’ national banking systems. The data cover contractual and ultimate risk lending by the head office and all its branches and subsidiaries on a worldwide consolidated basis, net of inter-office accounts (see BIS (2009)).
7
By doing so, they avoided the credit risk of lending directly to foreign commercial banks. That risk was taken by the intermediary central banks.
7
The mechanics of an inter-central bank swap are very simple. Central bank A credits the account of central bank B in its own books with A’s currency; in return, central bank B credits the account of central bank A in its books with an equivalent amount of B’s currency. Thus A lends its currency to B and B lends its currency to A; each loan is collateral for the other. There may be a provision for the amounts of the loans to be adjusted as exchange rates change. In principle, both A and B may use the foreign currency which the swap has put at their disposal, but in practice, only one party normally uses the swap proceeds; the other party simply holds them on deposit as collateral for the loan. In total, four overlapping swap networks were established: i.
The Fed network, set up to supply dollars (the Fed also set up swap facilities with certain foreign central banks under which it could obtain foreign currencies from them).
ii.
The euro network, under which the ECB supplied euros. There were also what we regard as extensions to the euro network enabling Danmarks Nationalbank, Norges Bank and Sveriges Riksbank to provide euros to other central banks.
iii.
The Swiss franc network.
iv.
The Asian and Latin American network.
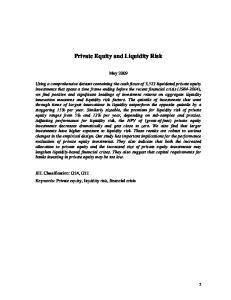
The entire network of swap facilities is illustrated in see Graph 3.1, and the swap lines set up are listed in Table A1 in the appendix.
Graph 3.1 Poland Switzerland
ECB Hungary UK
Norway
Canada
Iceland
Sweden
USA
Estonia
Mexico Denmark
Latvia
India
Brazil Singapore Australia
Belarus
Malaysia
Japan
NZ
Indonesia
Argentina
Hong Kong
Korea China
8
i.
The Fed network
The Federal Reserve was the first in the field. It set up its first swap lines in December 2007, and the number and size of its swap lines increased steadily in the following months. In reporting the initial phase of the extension of swap facilities in December 2007, the Federal Reserve Bank of New York commented as follows: From mid-November to year-end, trading liquidity in the foreign exchange swaps market was severely impaired. The re-emergence of funding pressures in term dollar, euro, and pound sterling money markets caused by balance sheet constraints and typical year-end funding pressures made it difficult to identify the appropriate interest rates at which to price forward transactions. These factors were exacerbated by increased demand for dollar funding by offshore banks that are typically structurally short U.S. dollars and that use the foreign exchange swaps market to obtain such funding. As a result, trading volumes in the foreign exchange swaps market diminished considerably, trade sizes contracted, and bid-ask spreads on transactions became much wider than normal. Additionally, concerns about counterparty credit risk prompted some market makers to temporarily withdraw from the market. Credit tiering also became evident, with counterparties viewed as less creditworthy finding it more difficult and costly to enter into transactions than counterparties perceived to be more creditworthy. Despite the impairment to the swaps market, spot foreign exchange market liquidity for major currencies was generally healthy during the quarter.8 The swap network was part of a broader programme of facilities that the Fed established to provide liquidity to financial markets. Access to other Federal Reserve liquidity facilities is confined to banks and primary securities dealers in the United States9, so that banks outside the United States needing to raise dollars did not have access to them. The swap lines established by the Federal Reserve also had the aim of reducing US dollar funding market pressure in the United States, as the following statements make clear: “However, we did explicitly coordinate to address problems in dollar funding markets. The Federal Reserve entered into foreign exchange swaps with a number of other central banks to make dollar funding available to foreign banks in their own countries. By doing so, we reduced the pressure on dollar funding markets here at home.” (see Kohn 2009).
8
See Federal Reserve Bank of New York (2008).
9
For information about access to the discount window, see Federal Reserve System, Board of Governors (2005), http://www.federalreserve.gov/pf/pdf/pf_complete.pdf . For information about access to the Term Auction Facility and the primary dealer credit facility, see http://www.federalreserve.gov/newsevents/press/monetary/20071212a.htm and http://www.federalreserve.gov/newsevents/press/monetary/20080316a.htm respectively.
9
“During this period, foreign commercial banks were a source of heavy demand for U.S. dollar funding, thereby putting additional strain on global bank funding markets, including U.S. markets, and further squeezing credit availability in the United States. To address this problem, the Federal Reserve expanded the temporary swap lines that had been established earlier with the European Central Bank (ECB) and the Swiss National Bank, and established new temporary swap lines with seven other central banks in September and five more in late October, including four in emerging market economies” (see Bernanke 2009). There is a relatively large Eurodollar market, ie a market for deposits denominated in US dollars outside the United States, and there is some evidence that Eurodollar interest rates could affect domestic US short-term interest rates (see Hartman 1984). This would be one channel through which US dollar funding problems of foreign banks could affect domestic US dollar funding markets. The minutes of the conference call held by the Federal Open Market Committee on 6 December 2007, at which it was decided to establish the first of the swap lines, records that the swap proposal was ‘aimed at improving market functioning’10. The extension of swap lines by the Federal Reserve took place in four main phases, as market liquidity deteriorated. The first swap lines were set up in December 2007, and they were extended, both in size and in geographical spread, in March 2008, May 2008, and September/October 2008. The last phase of extensions was by far the largest. It followed the failure of Lehman Brothers on 15th September. In response to the ensuing deterioration in market conditions, it was announced that foreign central banks (the ECB and the central banks of Japan, Switzerland and the U.K.) would auction term and forward dollar funding, in parallel with the Fed’s domestic Term Auction Facility. To facilitate these auctions, the upper limits on the amounts of the Fed’s swap lines with these central banks were removed entirely. In April 2009, the Fed announced that, as a precautionary measure, it had established swap lines to receive foreign currency from the ECB and the central banks of Switzerland, the U.K. and Japan, so that it would have the means to relieve shortages of foreign currencies in the United States should they arise11. These swap lines were not used in the second or third quarters of 2009. ii.
The Euro network
Euro-specific liquidity shortages developed in several European countries outside the euro area; the market symptoms are noted in Allen and Moessner (2010). The ECB set up facilities with 10
See Federal Open Market Committee (2007).
11
In each case, it already had in place a swap line under which it could supply dollars to the foreign central bank in question. Since the Fed described its dollar-supplying swap lines as ‘reciprocal currency arrangements’, it might be thought that the earlier swap lines, though initially set up so that the Fed could supply dollars, could be used in the reverse direction to enable the Fed to receive foreign currencies. However, that was evidently not the case.
10
the Danish, Hungarian, Polish and Swedish central banks to assist commercial banks in those countries in getting access to euro liquidity and thereby relieving localized shortages. In Hungary and Poland, commercial banks had made extensive domestic mortgage loans in foreign currencies, financing themselves in wholesale markets which became much less liquid as the credit crisis intensified12. Under the ECB’s arrangements with Hungary and Poland, euros were provided against euro collateral, rather than against the national currencies of the counterparty central banks. In addition to the swap lines provided by the ECB, further swap lines were provided indirectly to a certain other European countries in an extended euro swap network (see Graph 3.1), via central banks in countries with which the ECB had established swap lines (Sweden and Denmark), as well as separately by Norway, which has no swap line with the ECB.
iii.
The Swiss franc network
The Swiss National Bank provided Swiss franc swap lines to the United States, the euro area, Poland and Hungary (see Graph 3.1). Under the SNB’s swap lines with Hungary and Poland, Swiss francs were provided against euro collateral, not against the national currency of the counterparty central bank. The SNB’s purpose in providing these swap facilities was to enable foreign central banks to provide their commercial banks with Swiss franc liquidity and thereby satisfy the strong demand for Swiss francs13. The SNB implements its monetary policy by fixing a target range for the three-month Swiss franc Libor rate. The SNB reduced the upper bound of its target range from above 3% to 0.75% in the course of the financial crisis, and sought to bring down the Libor rate within this target range. However, the efforts of foreign banks to obtain the Swiss franc funding that they needed put upward pressure on the Libor rate. Easing the Swiss franc funding problems of foreign banks by providing swap lines was therefore expected to help bring down the SNB’s policy rate within the target range, thereby aiding in achieving the SNB’s monetary policy objectives. Regarding the extension of the EUR/CHF foreign exchange swaps with the ECB, National Bank of Poland and Magyar Nemzeti Bank on 25 June 2009, the SNB’s stated in its Monetary Policy Report that “The aim of this measure is to further ease the situation on the short-term Swiss franc money market.”14 The provision of the swap facilities probably also partly reflected the SNB’s concern about the appreciation of the Swiss franc, as well as its concern about conditions in credit markets. Indeed, on 12th March 2009, the SNB announced that it would act ‘to prevent a further appreciation of the Swiss franc against the euro’, including 12
See for example the 2007 IMF Article 4 reports on Hungary and Poland (http://www.imf.org/external/pubs/ft/scr/2007/cr07250.pdf and http://www.imf.org/external/pubs/ft/scr/2008/cr08130.pdf ). See also the NBP’s Financial Stability Report, October 2008 (http://www.nbp.pl/en/SystemFinansowy/Financial_Stability_October2008.pdf ). 13
See Roth (2009).
14
See SNB (2009), p. 26.
11
by purchasing foreign currency on the foreign exchange markets15. It therefore seems highly likely that the provision of Swiss franc swap facilities to the ECB and to the central banks of Hungary and Poland was partly motivated by the same concern.
iv.
The Asian and Latin American network
Before the credit crisis began, there was already an extensive network of inter-central bank swap lines in East Asia, created since 2000 under the Chiang Mai initiative16. These facilities were set up after the Asian financial crisis of 1997-98 in order to enable East Asian central banks to provide mutual financial support in the event of a future crisis, and they are part of a larger programme of economic integration in East Asia, as Kawai (2007) describes. The provisions of the swap facilities are fairly conservative, in that only the first 20% of the committed amount is available immediately. The remainder is provided under an IMF programme. To the authors’ knowledge, no drawings were made under this network during 2007-09. The Chiang Mai network needed to be supplemented to address the pressures created by the credit crisis17. During the crisis, the Bank of Japan established yen swap lines with the United States and Korea (see Graph 3.1), which were among the six economies with the largest yen shortages according to the measure shown in Graph 2.3. In addition, in June 2008, the Bank of Japan, acting as agent for the Ministry of Finance established a US dollar swap line with India. The People’s Bank of China was active in establishing new swap lines during the crisis. It appears to have had two separate objectives; first, to help in dealing with financial stress, and second, to promote bilateral trade and investment in the partner countries’ own currencies, with a view to establishing these currencies as international trading and investment vehicles in the longer term. It is reasonable to believe that the PBOC’s pursuit of both these objectives was motivated by the financial crisis. The need for liquidity was obvious. And the desire to promote non-dollar currencies as trading and investment vehicles is consistent with the views on international monetary reform expressed by the Governor of the PBOC in a speech on 23rd March 200918.
15
See http://www.snb.ch/en/mmr/reference/pre_20090312/source .
16
See Kawai (2007).
17
In late 2009, the Chiang Mai network was converted from a network of bilateral facilities into a multilateral facility. Each member country was assigned a ‘contribution amount’ and a ‘purchasing multiplier’, and is able to draw US dollars up to the product of its contribution amount and purchasing multiplier. See for example http://www.pbc.gov.cn/english/detail.asp?col=6400&id=1451.
18
See Zhou (2009).
12
These objectives were set out in the English versions of the PBOC’s announcements of the establishment of the various swap lines, as Table 3.1 shows. Table 3.1 Language of PBOC swap announcements Date
Counterparty
Short-term liquidity?
Bilateral trade?
12 Dec 2008 20 January 2009
Bank of Korea Hong Kong Monetary Authority
Yes Yes
Yes Yes1
8 February 2009 11 March 2009
Bank Negara Malaysia National Bank of Belarus
No No
Yes2 Yes2
23 March 2009 2 April 2009
Bank Indonesia Central Bank of Argentina
Yes No
Yes3 No
1
‘This will bolster investor confidence in Hong Kong's financial stability, promote regional financial stability and the development 2 of yuan-denominated trade settlement between Hong Kong and the mainland.’ Announcement refers to ‘bilateral trade and 3 investment’. Announcement refers to ‘bilateral trade and direct investment.’ Sources: English versions on PBOC internet site.
The PBOC’s second objective, of promoting bilateral trade in the trading partner countries’ own currencies, with a view to establishing their own currencies as international trading vehicles, is by its nature a longer-term project, and this is reflected in the fact that the PBOC’s swaps all have three-year terms, much longer than the terms of the swaps set up by other central banks purely to address market liquidity strains. Only few economies had shortages in the pound sterling according to the measure shown in Graph 2.4, while many economies were close to balance in the pound sterling or had surpluses. This is consistent with the absence of any swap lines in the pound sterling.
4. Relationship between currency-specific shortages and central bank swap lines In this section we study the relationship between the level of a country’s currency-specific shortages based on the BIS locational international banking statistics by residence of counterparty as shown in Graphs 2.1 to 2.5, and whether the country received a swap line in that currency. We do so by considering a probit regression model of the dependent variable, yci, which equals 1 if the country received a swap line in the currency, c, under consideration and 0 otherwise, on the level of countries’ currency shortages, sci, as well as on a constant term. The sample of countries consists of those included in Graphs 2.1 to 2.5. We define the vector of explanatory variables as xci = (1, sci). The probit model models the probability that a country i 13
receives a swap line in currency c, yci =1, as a function of the explanatory variables, in our case a constant term and the currency-specific shortage, sci, according to P(yci =1| xci )= (xci‘ )
(1)
where (.) is the standard normal cumulative distribution function, the vector of coefficients is =(1,2), c denotes the currency considered, ie the US dollar, euro, yen or the Swiss franc, and sci is the measure of the shortage in that currency (where a shortage is positive, ie the negative of the surplus), in billions of US dollars or US dollar equivalent.19 The estimated coefficients in the regression in equation (1) are shown in Table 4.1. We find that the probability of a country receiving a swap line in the euro, yen and the Swiss franc depends significantly on the measures of currency-specific shortage in the currency considered. The relationship is significant at the 1% level for the euro and Swiss franc, and at the 5% level for the yen. The coefficient 2 on the currency-specific shortage is largest for the Swiss franc, followed by the euro and the yen. Consistent with this, the goodness-of-fit of the probit model, as measured by the McFadden R2 measure, is largest for the Swiss franc (at 0.44), followed by the euro (at 0.41) and the yen (at 0.19). The marginal effect of the estimated currency shortage on the probability of receiving a swap line in that currency is given by20 ∑(xci‘ )/∑sci =(xci‘ )*2
(2)
where (.) denotes the standard normal density function. This marginal effect depends on the value of the shortage. For the values of the shortages in our sample of countries, it ranges from close to zero to around 0.05 for the Swiss franc, to around 0.02 for the euro, and to around 0.01 for the yen.
19
We do not consider sterling since no swap lines were granted in that currency, with the single exception of the swap line provided by the Bank of England to the Fed in April 2009.
20
See Verbeek (2004).
14
Table 4.1 Results for probit model by currency US dollar
Euro
Yen
Swiss franc
-0.25
-1.87**
-1.73**
-1.85**
(0.21)
(0.50)
(0.38)
(0.40)
0.004
0.043**
0.021*
0.130**
(0.003)
(0.014)
(0.01)
(0.048)
McFadden R2
0.04
0.41
0.19
0.44
Number of observations
39
39
39
39
Constant, 1 Currency-specific shortage, 2
** and * denote significance at the 1% and 5% level, respectively; standard errors are given in brackets.
Next we estimate the probability that a country i receives a swap line in currency c, yci =1, as a function of the explanatory variables, a constant term and the estimated currency-specific shortage, sci , using the logit model, which is an alternative binary choice model to the probit model where the standard normal probability distribution function is replaced by a logistic probability distribution function, P(yci =1| xci )= F(xci‘ )
(3)
Here, F(.) is the standard logistic distribution function, F(w)=exp(w)/(1+exp(w)). Table 4.2 Results for logit model by currency US dollar
Euro
Yen
Swiss franc
-0.41
-3.17**
-3.04**
-3.53**
(0.34)
(0.95)
(0.80)
(0.99)
0.006
0.073**
0.036*
0.252**
(0.005)
(0.025)
(0.018)
(0.097)
McFadden R2
0.04
0.39
0.18
0.46
Number of observations
39
39
39
39
Constant, 1 Currency-specific shortage, 2
** and * denote significance at the 1% and 5% level, respectively; standard errors are given in brackets.
15
In the logit model, the marginal effect of the estimated currency shortage on the probability of receiving a swap line in that currency is given by21 ∑F(xci‘ )/∑sci =exp(xci‘ )/(1+ exp(xci‘ ))2*2
(4)
This marginal effect again depends on the value of the shortage. For the values of the shortages in our sample of countries, it ranges from close to zero to around 0.06 for the Swiss franc, to around 0.02 for the euro, and to around 0.01 for the yen. We find that the probit and logit models give similar results for the significance of the coefficients and the magnitudes of the marginal effects of the currency shortages on the probability of receiving a swap line in that currency for the Swiss franc, euro and yen where the effect is significant. By contrast, in the specifications reported in Tables 4.1 and 4.2 the relationship between the currency-specific shortage and the probability of receiving a swap line is not significant for the US dollar. One possible explanation is related to differences in time zones. In countries with time zones remote from the United States, US financial markets are closed during part or all of the trading day. This is for example the case in the mornings in European countries. During times when US markets are closed, commercial banks with US dollar shortages in such time zones, for example in Europe, are likely to have tried to obtain US dollar funding in the markets of other large international financial centres outside the USA, such as Japan and Singapore. Thus US dollar shortages were likely to have been passed from one time zone to another. An international financial centre which initially had a dollar surplus might experience large interbank outflows which had the effect of turning the surplus into a shortage. Furthermore, commercial banks in such countries may be less likely to have affiliates in the United States from which they could obtain US dollar liquidity, and would therefore be more likely to look for US dollar funding outside the USA. Consequently, given the international role of the US dollar, the Federal Reserve may have supplied US dollar funding via swap lines to large international financial centres, so as to ensure that the latter could distribute US dollar liquidity on to commercial banks in time zones remote from the US while US markets were closed. To test this hypothesis, we add a dummy variable, dilfc, in the probit regression for the probability of the country receiving a US dollar swap line from any country, which equals one if an economy is a large international financial centre (ie Australia, the euro area, Hong Kong, Japan, Singapore, Switzerland, and the United Kingdom), and zero otherwise. The vector of explanatory variables in the probit regression of equation (1) is now defined as x$i =(1, s$i, dilfc), and the vector of coefficients is =(1,2,3). The results are shown in the middle column of Table 4.3. We can see that the coefficient on the dummy variable for an economy being a large international financial centre is statistically significant at the 1% level, consistent with our hypothesis. Moreover, when controlling for whether a country is a large international financial
21
See Verbeek (2004).
16
centre, our measure of the US dollar shortage becomes statistically significant at the 5% level in the probit regression. For the values of the US dollar shortages in our sample of countries, the marginal effect of the estimated US dollar shortage on the probability of receiving a US dollar swap line ranges from close to zero to around 0.01, similar to what we found for the yen above. These results suggest that economies with larger US dollar shortages on our measure, and economies that are large international financial centres, had a statistically significantly higher probability of receiving a US dollar swap line. Next, we repeat this exercise in the probit regression for the probability of the country receiving a US dollar swap line from the Federal Reserve, rather than from any country.22 The dependent variable in the probit regression is now the probability that a country i receives a US dollar swap line from the Federal Reserve, yFedi =1, and the explanatory variables are again x$i =(1, s$i, dilfc), with the vector of coefficients being =(1,2,3), P(yFedi =1| xci )= (xci‘ )
(5)
The results are reported in Table 4.3 (right-hand column). For swap lines provided by the Fed we also find that the coefficients on both the US dollar shortage and the dummy for a country being a large international financial centre are statistically significant. These results suggest that countries with larger US dollar shortages on our measure, and countries that are large international financial centres, had a statistically significantly higher probability of receiving a US dollar swap line from the Federal Reserve. Table 4.3 Probit model for probability of receiving US dollar swap line From any country
From the Federal Reserve (Equation 5)
Constant, 1 US dollar shortage, 2 Dummy for large int. financial centre, 3 2
McFadden R
Number of observations
-0.73**
-0.96**
(0.27)
(0.30)
0.026*
0.026*
(0.010)
(0.011)
4.94**
5.24**
(1.87)
(1.93)
0.31
0.35
39
39
** and * denote significance at the 1% and 5% level, respectively; standard errors are given in
22
India and Indonesia received a swap line from the Bank of Japan, but not from the Fed. All the other countries receiving US dollar swap lines did so from the Fed.
17
brackets.
Finally, we add a variable for the difference in time zones between each country and New York, tzi (in hours), in the probit regressions for the probability of the country receiving a US dollar swap line from any country. The vector of explanatory variables in the probit regression of equation (1) is now defined as x$i =(1, s$i, dilfc, tzi), and the vector of coefficients is =(1,2,3,4). The results are reported in Table 6.4 (middle column). We find that the estimated coefficient on the difference in time zones is not statistically significant in the regression. Next, we run the analogous regression for the probability of a country receiving a US dollar swap line from the Fed. The vector of explanatory variables in the probit regression of equation (5) is now defined as x$i =(1, s$i, dilfc, tzi), and the vector of coefficients is =(1,2,3,4). A similar result holds in this case (see Table 4.4, right-hand column). This regression is also consistent with the Federal Reserve having a statistically significantly higher probability of providing swap lines to large international financial centres. Table 4.4 Probit model for probability of receiving US dollar swap line From any country
From the Federal Reserve
-0.61
-0.40
(0.50)
(0.51)
0.026*
0.027*
(0.011)
(0.011)
Dummy for large int. financial centre, 3
4.99**
5.74**
(1.89)
(2.09)
Time zone difference to New York, 4
-0.02
-0.10
(0.07)
(0.08)
McFadden R
0.31
0.39
Number of observations
39
39
Constant, 1 US dollar shortage, 2
2
** and * denote significance at the 1% and 5% level, respectively; standard errors are given in brackets.
Next, we study whether the actual amounts drawn on swap lines provided by the Federal Reserve at end-2008, draw$i (in US dollar billions), depend significantly on our measure of a country’s US dollar shortage, s$i (in US dollar billions), for the sample of countries which received a swap line from the Federal Reserve. Data on drawings on Fed swap lines at end2008 are shown in Table 4.5. 18
Table 4.5 Drawings of US dollars on Fed swap lines ($ billions, end-2008) Canada
0
ECB
291.352
Switzerland
25.175
Japan
122.716
United Kingdom
33.080
Denmark
15.000
Australia
22.830
Sweden
25.000
Norway
8.225
New Zealand
0
Korea
10.350
Brazil
0
Mexico
0
Singapore
0
Total
553.728
Source: Federal Reserve Bank of New York, ‘Treasury and Federal Reserve Foreign Exchange Operations’, various releases.
We estimate the following regression via OLS (with White heteroskedasticity-consistent standard errors), draw$i = 1 + 2*s$i + 3*dilfc+ ei
(6)
as well as the regression also including a variable for the difference in time zones, tz, draw$i = 1 + 2*s$i + 3*dilfc + 4*tzi + ei
(7)
and a specification including the dummy variable for large international financial centres interacted with the difference in time zones, 19
draw$i = 1 + 2*s$i + 5*dilfc*tzi + ei
(8)
Results of these regressions are shown in Table 4.6. We can see that the coefficient on the US dollar shortage is significant at the 5% level in two of the specifications, and at the 10% level in the remaining one. The dummy variable for large international financial centres is significant at the 5% level in the first specification, and the dummy variable for large international financial centres interacted with the variable for the difference in time zones is significant at the 10% level in the third specification. Goodness of fit of these regressions, as measured by the adjusted R2, are around 0.55. These results suggest that actual US dollar funding obtained by drawing on the Fed’s swap lines at end-2008 was statistically significantly larger for countries with higher US dollar shortages on our measure, as well as for economies which are large international financial centres.
Table 4.6 Drawings on US dollar swap line from the Federal Reserve at end-2008 Equation (6)
Equation (7)
Equation (8)
-2.53
-16.7
-2.20
(6.96)
(15.8)
(8.63)
+
0.36
0.39*
0.42*
(0.17)
(0.17)
(0.18)
69.6*
59.0
-
(31.5)
(34.9)
Time zone difference to New York, 4
-
2.85
Dummy for large int. financial centre * time zone difference, 5
-
Constant, 1 US dollar shortage, 2 Dummy for large int. financial centre, 3
Adjusted R
2
Number of observations
-
(3.12) -
7.73+ (3.55)
0.56
0.53
0.55
14
14
14
+
**, * and denote significance at the 1%, 5% and 10% levels, respectively; standard errors are given in brackets; White heteroskedasticity-consistent standard errors.
20
5. Conclusion In this paper we discussed the main innovation in central bank cooperation during the financial crisis of 2008-09, namely the emergency provision of international liquidity through the establishment of bilateral central bank swap facilities, which have evolved to form interconnected swap networks. Based on the BIS international locational banking statistics, we presented a measure of currency-specific liquidity shortages for the US dollar, the euro, the yen, the pound sterling and the Swiss franc for a large number of advanced and emerging economies. We discussed the reasons for establishing swap facilities, related our measure of currency-specific liquidity shortages to the probability of a country receiving a swap line in that currency, and found a significant relationship in the case of the US dollar, the euro, the yen and the Swiss franc. Moreover, we found that economies which are large international financial centres had a statistically significantly higher probability of receiving a US dollar swap line from the Federal Reserve, as well as from any country. We also found that actual US dollar funding obtained by drawing on the Fed’s swap lines at end-2008 was statistically significantly larger for economies with higher US dollar shortages on our measure, as well as for economies which are large international financial centres.
References Allen, W. and R. Moessner (2010), “Central bank co-operation and international liquidity in the financial crisis of 2008-9”, Bank for International Settlements, mimeo. Baba, N., Packer, F. and Nagano, T., (2008), “The spillover of market turbulence to FX swap and cross-currency swap markets”, BIS Quarterly Review, March. Baba, N. and F. Packer (2009), “From turmoil to crisis: dislocations in the FX swap market before and after the failure of Lehman Brothers”, BIS Working Paper no 285. Bernanke, B. (2009), “Reflections on a year of crisis”, speech at the Brookings Institution’s conference on ‘A year of turmoil’, Washington, D.C, 15 September 2009. BIS (2008), “Guidelines to the international locational banking statistics”, December. BIS (2009), Statistical Annex, BIS Quarterly Review, June. Federal Open Market Committee (2007), Minutes of conference call on December 6, 2007, available at http://www.federalreserve.gov/monetarypolicy/files/fomcminutes20071211.pdf
21
Federal Reserve Bank of New York (2008), ‘Treasury and Federal Reserve Foreign Exchange Operations: October – December 2007’, http://www.newyorkfed.org/newsevents/news/markets/2008/fxq407.pdf . Federal Reserve System, Board of Governors (2005), The Federal Reserve System: Purposes and Functions. Hartman, D. (1984), “The International Financial Market and U.S. Interest Rates”, Journal of International Money and Finance, 3. Kawai, M. (2007), “Evolving Economic Architecture in East Asia”, ADB Institute Discussion Paper no 84, December, http://www.adbi.org/files/dp84.evolving.economic.architecture.east.asia.pdf . Kohn, D. (2009), “International perspective on the crisis and response”, speech at the Federal Reserve Bank of Boston 54th Economic conference, Chatham, Massachusetts, October 23 2009. McGuire, P. and G. von Peter (2009), “The US dollar shortage in global banking”, BIS Quarterly Review, March. Obstfeld, M.,J.C. Shambaugh and A. M. Taylor, “Financial Instability, Reserves and Central Bank Swap Lines in the Panic of 2008”, American Economic Review, Papers and Proceedings, 99:2. Pomerleano, M. (2009), “Ring-fence cross-border financial institutions”, FT economists’ forum, August 10, http://blogs.ft.com/economistsforum/2009/08/ring-fence-cross-border-financialinstitutions/ . Roth, J.-P. (2009), ”Geldpolitik ohne Grenzen. Vom Kampf gegen die Internationalisierung des Frankens zur Internationalisierung der Geldpolitik.”, speech at Schweizerisches Institut für Auslandsforschung, Zürich, 6 May 2009. Swiss National Bank (2009), “Monetary policy report”, Quarterly Bulletin 3/2009, p. 6-43. Verbeek, M. (2004), A guide to modern econometrics, Wiley. Zhou, X. (2009), “Reform the International Monetary System”, speech available at http://www.pbc.gov.cn/english/detail.asp?col=6500&id=178 , 23 March 2009.
22
Appendix Table A1 List of swap lines extended since December 2007 Date
Counterparty central bank
Amount (bn)
Expiry date
1. Swap lines extended by the Fed to provide dollars. 12 December, 2007
European Central Bank
20
Jun 2008
Swiss National Bank
4
Jun 2008
European Central Bank *
30
Sept 2008
Swiss National Bank*
6
Sept 2008
European Central Bank*
50
Jan 2009
Swiss National Bank*
12
Jan 2009
30 July, 2008
European Central Bank*
55
Jan 2009
18 September, 2008
European Central Bank*
110
Jan 2009
Swiss National Bank*
27
Jan 2009
Bank of Japan
60
Jan 2009
Bank of England
40
Jan 2009
Bank of Canada
10
Jan 2009
Reserve Bank of Australia
10
Jan 2009
Sveriges Riksbank
10
Jan 2009
Danmarks Nationalbank
5
Jan 2009
Norges Bank
5
Jan 2009
European Central Bank*
120
Jan 2009
Swiss National Bank*
30
Jan 2009
Bank of Canada*
30
Apr 2009+
Bank of England*
80
Apr 2009
Bank of Japan*
120
Apr 2009
Danmarks Nationalbank
15
Apr 2009
11 March, 2008
2 May, 2008
24 September, 2008
26 September, 2008
29 September, 2008
23
European Central Bank*
240
Apr 2009
Norges Bank*
15
Apr 2009+
Reserve Bank of Australia
30
Apr 2009+
Sveriges Riksbank*
30
Apr 2009+
Swiss National Bank*
60
Apr 2009+
Bank of England*
Unlimited
Apr 2009+
European Central Bank*
Unlimited
Apr 2009+
Swiss National Bank*
Unlimited
Apr 2009+
14 October, 2008
Bank of Japan*
Unlimited
Apr 2009+
28 October, 2008
Reserve Bank of New Zealand 15
Apr 2009+
29 October, 2008
Banco Central do Brasil
30
Apr 2009+
Banco de Mexico
30
Apr 2009+
Bank of Korea
30
Apr 2009+
30
Apr 2009+
13 October, 2008
Monetary Authority of Singapore * Denotes an extension or enlargement of an existing facility. + The expiry date of these swap lines was extended first to October 2009 and later to February 2010.
2. Swap lines under which the Fed can receive foreign currencies 6 April, 2009
Bank of England
GBP 30
Oct 2009**
European Central Bank
EUR 80
Oct 2009**
Bank of Japan
JPY 10,000
Oct 2009**
Swiss National Bank
CHF 40
Oct 2009**
** The expiry date of these swap lines was later extended to February 2010.
3. Swap lines extended by the European Central Bank to provide euros 20 December, 2007
Sveriges Riksbank
10
16 October 2008
Magyar Nemzeti Bank
5
24
Not specified
27 October, 2008
Danmarks Nationalank
12
‘As long as needed.’
21 November, 2008
National Bank of Poland
10
Not specified
0.5
Extended in November
4. Other swap lines in the extended euro network a. Danmarks Nationalbank supplying euros 16 May, 2008
Central Bank of Iceland
2008 until end-2009. 16 December, 2008
Bank of Latvia
0.125
b. Norges Bank supplying euros 16 May, 2008
Central Bank of Iceland
0.5
Extended in November 2008 until end-2009.
c. Sveriges Riksbank 16 May, 2008
Central Bank of Iceland
0.5 (EUR)
Extended in November 2008 until end-2009.
16 December, 2008
Bank of Latvia
0.375 (EUR)
27 February, 2009
Bank of Estonia
10 (SEK)
5. Swap lines extended by the Swiss National Bank to provide Swiss francs 15 October, 2008
European Central Bank
Not specified
Jan 2009*+
7 November, 2008
National Bank of Poland
Not specified
Jan 2009*+
28 January 2009
Magyar Nemzeti Bank
Not specified
Apr 2009+*
*+ The expiry dates of these swap lines were later extended to April then to October 2009 and again until January 2010. +* The expiry date was later extended to October 2009.
6. Asian swap lines a. People’s Bank of China 12 December, 2008
Bank of Korea
180 (CNY)
25
3 years
38,000 (KRW) 20 January, 2009
8 February, 2009
Hong Kong Monetary
200 (CNY)
Authority
227 (HKD)
Bank Negara Malaysia
80 (CNY)
3 years
3 years
40 (MYR) 11 March, 2009
National Bank of Belarus
20 (CNY)
3 years
8,000 (BYR) 23 March, 2009
Bank Indonesia
100 (CNY)
3 years
175,000 (IDR) 2 April, 2009
Central Bank of Argentina
70 (CNY)
3 years
38 (ARS) b. Bank of Japan 30 June, 2008
Reserve Bank of India
3 (USD)
12 December, 2008
Bank of Korea
20 (USD)
6 April, 2009
Bank Indonesia
12 (USD)
*** The expiry date was first extended to October 2009, and later to February 2010. Sources: Central banks.
26
Jan 2009***