International capital flows and financial vulnerabilities in emerging market economies: analysis and data gaps By Nikola Tarashev, Stefan Avdjiev and Ben Cohen Note submitted to the G20 International Financial Architecture Working Group August 2016
This publication is available on the BIS website (www.bis.org).
©
Bank for International Settlements 2016. All rights reserved. Brief excerpts may be reproduced or translated provided the source is stated.
ISBN 978-92-9197-630-0 (online)
International capital flows and financial vulnerabilities in emerging market economies: analysis and data gaps Note submitted to the G20 International Financial Architecture Working Group Nikola Tarashev, Stefan Avdjiev and Ben Cohen1
Contents Introduction ............................................................................................................................................... 1 1. Debt of EME non-financial corporates .................................................................................... 2 2. Dynamics of international capital flows .................................................................................. 5 Gross flows reveal financial vulnerabilities ........................................................................... 5 Balance sheet perspective: borrowers’ nationality is key ............................................... 7 Instrument characteristics matter: type, maturity and currency ................................ 10 Maturity ............................................................................................................................................ 10 Currency of denomination........................................................................................................ 11 Capital flows can be self-reinforcing .................................................................................... 12 3. Empirical methodology and data gaps ................................................................................. 13 a.
Global Liquidity Indicators (GLIs) .................................................................................. 13
b.
Cross-border lending by non-banks ........................................................................... 14
c.
Data gaps ............................................................................................................................... 14
References ................................................................................................................................................ 16 Annex: Data gap initiatives ................................................................................................................ 18 International Banking Statistics (IBS) .................................................................................... 18 Securities Statistics....................................................................................................................... 18 Cross border exposures of non-bank corporations ....................................................... 18 Derivatives ....................................................................................................................................... 18 Securities financing...................................................................................................................... 19
1
Bank for International Settlements. Corresponding author:
[email protected] Bat-el Berger provided much appreciated help with the graphs and tables.
International capital flows and financial vulnerabilities in EMEs: analysis and data gaps
iii
Introduction The world economy has experienced swings in international capital flows that are set to continue. There is broad agreement on the key underlying drivers. One is monetary policy divergence in advanced economies, which has altered the relative cost of funding in different international currencies. Another is the slowdown of growth in emerging market economies (EMEs), with commodity exporters facing a large termsof-trade loss. Finally, there have been sizeable shifts in exchange rates as investors rebalanced their portfolios. The accumulation of debt since the global financial crisis has left EMEs particularly vulnerable to capital outflows. Some of their non-financial companies have borrowed heavily, with much debt denominated in US dollars. In addition, credit to households has become a new important element of EMEs’ financial cycles. This note analyses current EME vulnerabilities to capital flows – rather than historical events – paying particular attention to non-financial corporates (NFCs). The shifting pattern of financial intermediation towards debt securities markets, in which NFCs are playing an increasingly prominent role, has far-reaching implications. This is in sharp contrast to the lead-up to the Great Financial Crisis, when European global banks intermediating US dollar funds in the advanced economies were at the heart of the vulnerabilities. Adopting the balance sheet as the unit of analysis, the note stresses stocks, gross rather than net flows, borrowers’ nationality rather than location and the currency denomination of debts. The main conclusions are:
As private sector borrowing has led to overheating in several large EMEs, the unwinding of imbalances may generate destabilising dynamics.
Having amplified the financial boom in EMEs, international capital flows are likely to play an important role in the next phase of these economies’ financial cycles.
Off-shore borrowing by NFCs – which is missed by residence-based measures – has grown at a fast clip, increasing the financial vulnerability of individual firms and shaping financial conditions in the home country.
International capital flows may accentuate destabilising asset pricing dynamics, especially in the presence of currency mismatches and irrespective of the maturity of the underlying instruments.
Inconsistent data reporting or missing data continue to limit the usefulness of measures for tracking and analysing international capital flows. This puts a premium on the successful implementation of data gap initiatives.
The note is organised as follows. The first section outlines EME corporates’ aggregate indebtedness, which has both domestic and international sources. The second zooms in on international flows – for which BIS statistics are a key data source – and examines attendant risks. This section takes a broad perspective and covers both cross-border flows and currency composition shifts within GDP boundaries. The third section steps back to offer methodological guidance for constructing measures of financial vulnerabilities and to point to data gaps. Finally, an annex identifies relevant recommendations from the G-20 Data Gaps Initiative.
International capital flows and financial vulnerabilities in EMEs: analysis and data gaps
1
1. Debt of EME non-financial corporates EME growth, which was very strong in the first decade of this century, declined over the past few years and has recently slowed down further. Prospects are clouded by uncertainty about the pace of growth in China and about the impact of the sustained drop in commodity prices on commodity-exporting EMEs. Investors have grown more sensitive to news on global growth prospects. This has generated bouts of financial market turbulence. It has also led to large depreciations in many EME currencies, especially relative to the US dollar. How robust are EMEs to unfavourable financial developments? At the most general level, the high indebtedness of EMEs’ corporate sector rings alarm bells. According to the BIS’s debt statistics, NFC debt in the major EMEs increased on aggregate from less than 60% of GDP in 2006 to 110% at end-2015, well above the corresponding ratio in advanced economies (Graph 1, left-hand panel). This increase masks important differences across individual EMEs, in terms of both levels and trends (right-hand panel). The high level of corporate debt has contributed to overheating in some of these economies, thus increasing the risk of financial distress in the coming years (Box A).
High and rising NFC debt in EMEs As a percentage of nominal GDP
Graph 1
By region1
Selected emerging market economies 110
150
100
120
90
90 80
60
70
30
60 50 06
07
08
09
10 2
Advanced economies
11
12
13
14
15 3
Emerging economies
0 06
07
08
09
China Korea
10
Russia Brazil
11
12
13
14
15
Argentina
Nominal GDP-weighted averages. 2 Australia, Canada, the euro area, Japan, Sweden, Switzerland, the United Kingdom and the United States. 3 Argentina, Brazil, China, India, Indonesia, Korea, Mexico, Poland, Russia, Saudi Arabia, South Africa and Turkey.
1
Sources: IMF, World Economic Outlook; BIS data on total credit to non-financial corporations.
2
International capital flows and financial vulnerabilities in EMEs: analysis and data gaps
Box A: Early warning indicators The BIS has analysed and monitors early warning indicators of domestic banking distress. These indicators capture financial overheating and signal a crisis over the medium term. They are calibrated with reference to noise-to-signal ratios, defined roughly as the number of false alarms divided by the number of correctly predicted historical episodes. Table A.1 reports three indicators. One is the gap between the credit-to-GDP ratio and its long-term trend, estimated in real time (first column). Another is the gap between the residential property price index and its long-term trend (second column). The last one is the difference between the debt service ratio (DSR) and its time average. It is derived under two different assumptions about interest rate adjustments (third and fourth columns). All three indicators suggest heightened risk of banking distress in a number of emerging market economies. This is in particular the case for Brazil, China and Turkey where the credit-to-GDP gaps are close to or above 10%. In the past, two-thirds of banking crises were preceded by credit-to-GDP gaps breaching this thresholds during the three years before the event. The DSR-based indicators paint a similar picture, while the property price gap is less worrying for most of the economies listed. The reported DSR impacts are "static" estimates - they assume an immediate passthrough of interest rate changes into DSRs, and do not take account of the ways in which borrowers and lenders would respond to interest rate movements by changing debt maturities, repaying their obligations or other measures.
Early warning indicators for domestic banking crisis signal risks ahead1 Credit-to-GDP gap2
Property price gap3
Debt service ratio4
Table A.1 Debt service ratio if interest rates rise by 250 bp4, 5
Asia6
14.0
6.6
1.8
4.1
Brazil
8.5
–19.6
7.4
9.2
China
29.7
–4.9
5.5
8.8
–10.8
8.3
0.4
1.9
1.8
2.9
Central and Eastern Europe7 India
–3.2
Korea
3.9
6.1
–0.6
3.0
Mexico
7.7
2.1
0.5
1.2
South Africa
–0.3
–7.6
–0.5
0.9
Turkey
11.8
5.7
7.4
DSR>6
DSR>6
4≤DSR≤6
4≤DSR≤6
Legend
Credit/GDP gap>10 2≤Credit/GDP gap≤10
Property gap>10
For the credit-to-GDP gap, data up to Q4 2015 except for Bulgaria, Lithuania and the Philippines, for which data end in Q1 2016; for the property price gap, data up to Q4 2015 except for Hong Kong SAR, Korea, Singapore, South Africa and Thailand for which data end in Q1 2016; for the debt service ratio, data up to Q4 2015. Thresholds for red cells are chosen by minimising false alarms conditional on capturing at least two thirds of the crises over a cumulative three-year horizon. A signal is correct if a crisis occurs in any of the three years ahead. The noise is measured by the wrong predictions outside this horizon. Beige cells for the credit-to-GDP gap are based on guidelines for countercyclical capital buffers under Basel III. Beige cells for the DSR are based on critical thresholds if a two-year forecast horizon is used. For a derivation of critical thresholds for credit-toGDP gaps and property price gaps, see M Drehmann, C Borio and K Tsatsaronis, “Anchoring countercyclical capital buffers: the role of credit aggregates”, International Journal of Central Banking, vol 7(4), 2011. For DSRs, see M Drehmann and M Juselius, “Do debt service costs affect macroeconomic and financial stability?", BIS Quarterly Review, September 2012. Simple average for country aggregates. 2 Difference of the credit-to-GDP ratio from its long-run, real-time trend calculated with a one-sided Hodrick-Prescott (HP) filter using a smoothing factor of 400000, in percentage points. 3 Deviations of real residential property prices from their long-run trend calculated with a one-sided HP filter using a smoothing factor of 400000, in per cent. 4 For the DSR series and methodology, see www.bis.org/statistics/dsr.htm. Difference of DSRs from country-specific long-run averages since 1999 or later depending on data availability and when five-year average inflation fell below 10%, in percentage points. 5 Assuming that interest rates increase 2.5 percentage points and that all the other components of the DSR stay fixed. 6 Hong Kong SAR, Indonesia, Malaysia, the Philippines, Singapore and Thailand; excluding the Philippines and Singapore for the DSR and its forecast. 7 Bulgaria, the Czech Republic, Estonia, Hungary, Latvia, Lithuania, Poland, Romania and Russia; excluding the Czech Republic and Romania for the real property price gap; excluding Bulgaria, Estonia, Latvia, Lithuania and Romania for the DSR and its forecasts. 1
Sources: National data; BIS; BIS calculations.
International capital flows and financial vulnerabilities in EMEs: analysis and data gaps
3
At a micro level, the leverage of EME NFCs has risen, increasing credit risk (Graph 2). In addition to rising debt, this trend has likely reflected limited equity accumulation in the face of falling profitability (Graph 3), especially in the commodities sector. Evident in both the tradable and non-tradable sectors, the trend has been most pronounced among the corporates with the highest leverage (75thpercentile lines, Graph 2). Thus, an increasing number of corporates have become vulnerable to being tipped into default by a further slowdown in economic growth and/or adverse asset price developments. Given the steep repayment schedule that lies ahead, the refinancing capacity of highly leveraged EME companies is likely to be tested soon, especially if the rise of the US dollar continues. As the issuance boom began in 2010 and featured long maturities, scheduled repayments have been modest so far. But they rise quite sharply from 2016. According to the BIS’s latest estimate, these repayments will total $340 billion over the years 2016-18, which is 40% more than during the past three years and, on an annualised basis, amounts roughly to the net issuance of bonds by EME non-banks in 2015. A tightening of financing conditions may feed on itself. It may lead some nonfinancial companies to withdraw wholesale deposits from local banks (BIS (2015b)). In turn, these banks may increase their lending spreads, thus adding to the rising cost of borrowing on bond markets. In May 2016, the spread on a broad EME corporate bond index (CEMBI) was more than 100 basis higher than in mid-2014.
Rising leverage of EME NFCs – total debt to equity1 In per cent
Graph 2
Full sample
Tradable sectors
Non-tradable sectors
140
140
140
120
120
120
100
100
100
80
80
80
60
60
60
40
40
40
20 2010 2011 2012 2013 2014 2015 25th percentile
20 2010 2011 2012 2013 2014 2015 Median
20 2010 2011 2012 2013 2014 2015 75th percentile
A sample of 280 companies which have issued international bonds. Tradables: Diversified (conglomerates), industrial, metals & mining, oil & energy, pulp & paper and transport (airlines); non-tradables: consumer, infrastructure, real estate, telecommunications and utilities. 1
Source: Chui, M, E Kuruc and P Turner (2016): “A new dimension to currency mismatches in the emerging markets: nonfinancial companies”, BIS Working Papers, no 550, March.
EME corporates’ international debt, while smaller than domestic debt, is important in its own right. International capital outflows could affect overall investor sentiment and credit conditions, either by leading directly to defaults or by steering corporates to seek funding from the already stretched domestic markets and banks.
4
International capital flows and financial vulnerabilities in EMEs: analysis and data gaps
Weak and falling profitability of EME NFCs In per cent
Graph 3 17.5 15.0 12.5 10.0 7.5 5.0
2006
2007
2008
Advanced economies
2009
2010
2011
2012
2013
2014
2015
Emerging economies
Note: Profitability is defined as the return-on-equity. The advanced economies index is the 2010 GDP-PPP weighted average of the euro area, Japan, the United Kingdom and the United States. The emerging economies index is provided by Datastream Worldscope. Source: Chui, M, E Kuruc and P Turner (2016): “A new dimension to currency mismatches in the emerging markets: nonfinancial companies”, BIS Working Papers, no 550, March.
2. Dynamics of international capital flows The BIS examines in some detail what international capital flows reveal about the state of global liquidity. For such exercises, BIS (2011) interprets global liquidity as the ease of financing for financial and non-financial firms, sovereigns and households in global financial markets. The term encompasses both funding liquidity (the ease of raising cash by selling new obligations to investors) and market liquidity (the ease of raising cash by selling assets). Global liquidity thus depends on the actions of private investors, financial institutions and monetary authorities. It is an unobservable property of the financial system: while we can gauge it by analysing different prices and capital flows, no single indicator on its own will give a full picture.2
Gross flows reveal financial vulnerabilities The first key lesson of recent history is that gross flows matter at least as much as net flows, such as current account balances. A country’s net position is not a sufficient indicator of its financial condition and its vulnerability to a sudden shift in a key component of capital flows and/or to stress in a key market segment. For example, ahead of the 2007-09 financial crisis, European countries had a largely balanced current account, while Asian countries had a significant net surplus. Nonetheless, European banks’ exposure to the US housing market was much larger than that of their Asian counterparts. This was the result of sizable gross flows from Europe to the United States, much of them channelled through international financial centres and funded with dollars raised in the United
2
“Global liquidity indicators: background and interpretation”, BIS Quarterly Review, March 2015, pp 20–21.
International capital flows and financial vulnerabilities in EMEs: analysis and data gaps
5
States. Thus, unsurprisingly – but contrary to what analyses focused on current account balances would have anticipated – the stress in the US housing market had much stronger repercussions in the European financial system than in Asia.3 In other words, a balanced current account with offsetting flows and positions may provide a false sense of safety. For instance, a country’s official foreign exchange reserves may match or exceed the foreign-currency denominated debt of its corporate sector. But if non-financial corporates face pressure from capital outflows, there may be no easy way for the authorities to deploy their reserves to alleviate this pressure. Distressed companies could reduce investment expenditure or hiring – thus hurting economic activity – even though the central bank has large foreign-exchange reserves.
Global bank credit to the non-banks, by borrower region Banks’ cross-border credit plus local credit in all currencies1 All countries2 USD trn
Graph 4
United States Per cent
USD trn
Euro area Per cent
USD trn
Per cent
100
24
20
24
20
24
75
12
15
12
15
12
50
0
10
0
10
0
25
–12
5
–24
0
0 01 03 05 07 09 11 13 15
5
–24
0
01 03 05 07 09 11 13 15
Emerging Asia USD trn
–12
USD trn
–24 01 03 05 07 09 11 13 15
Latin America Per cent
–12
Emerging Europe Per cent
USD trn
Per cent
24
50
3.2
40
1.2
40
18
25
2.4
20
0.9
20
12
0
1.6
0
0.6
0
–25
0.8
–20
0.3
–20
–50
0.0
–40
0.0
6 0 01 03 05 07 09 11 13 15 3 Amounts outstanding (lhs): Cross-border credit Local credit
01 03 05 07 09 11 13 15 Annual change (rhs): Cross-border credit Local credit
–40 01 03 05 07 09 11 13 15
1 Cross-border claims of LBS-reporting banks plus local claims of all banks. Local claims are from national financial accounts and include credit extended by the central bank to the government. 2 Sample of 52 countries. 3 Amounts outstanding at quarter-end. Amounts denominated in currencies other than the US dollar are converted to US dollars at the exchange rate prevailing at end-December 2015.
Sources: IMF, International Financial Statistics; BIS international banking statistics; BIS calculations.
3
6
See Borio and Disyatat (2011, 2015) and McGuire and von Peter (2012).
International capital flows and financial vulnerabilities in EMEs: analysis and data gaps
Another reason for focusing on gross international capital flows is the evidence that such flows have tended to amplify domestic credit cycles (Graph 4). For example, in the years since the Great Financial Crisis, the Asia-Pacific region has experienced both strong domestic credit growth, and even stronger growth in credit from abroad (lower left-hand panel). The euro area and emerging European economies, by contrast, have experienced weak domestic credit growth and weak growth, or even outflows, on the international side (right-hand panels). Finally, international capital flows are regularly the marginal source of financing in the run-up to crises. Although often small relative to the total stock of credit, swings in such flows are highly correlated with booms and busts in global financial conditions (Borio et al (2011), Avdjiev et al (2012)). As gross international flows have been part of the post-crisis boom in EMEs, it is natural to expect them to also play a role in the subsequent unwinding of imbalances.
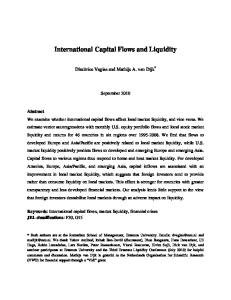
Balance sheet perspective: borrowers’ nationality is key The second key lesson has been that the national economy may not be the appropriate unit of analysis.4 Traditionally, capital flows have been defined with reference to the boundary of the national income area. And this has led much empirical work to rely exclusively on Balance of Payments (BoP) data. Such an approach is based on the residence principle, which assumes the "triple coincidence" of GDP area, decision-making unit and currency area. Albeit elegant and convenient in theory, this assumption is often violated in practice (Avdjiev et al, 2015). The residence principle is problematic for assessing NFCs’ financing activities that straddle national borders (as well as for assessing international bank exposures). Namely, external debt based on the residence principle may understate the true economic exposures of a firm that has borrowed through its affiliates abroad (Graph 5, top panel). By contrast, off-shore borrowing would be automatically included in exposure measures that adopt corporate balance sheets as the unit of analysis. Such measures thus provide a more complete picture of vulnerabilities. EME non-banks’ off-shore debt securities have gained in importance. In the case of three large economies, the issuance of such securities has increased substantially over time, outpacing other types of international borrowing (Graph 6, yellow areas). As of end-September 2015, offshore debt securities accounted for 93% of the international debt securities issued by Chinese nationals. For Brazilian and Russian nationals, those shares stood at 53% and 45%, respectively. More generally, roughly one half of the outstanding international debt securities of NFCs headquartered in major EMEs was issued through subsidiaries abroad, albeit with significant variation across countries. This debt would either not show up in conventional residence-based external debt statistics (when proceeds are not repatriated) or would be classified as FDI (when they are). In either case, residence-based measures would paint an overly benign picture (Gruic et al, 2014a). Besides influencing the financial strength of individual corporates, offshore borrowing is also important in gauging credit conditions. Having obtained funds abroad – eg by issuing bonds offshore – a NFC’s foreign affiliate could repatriate
4
See Borio et al (2014) for an example from the interwar period.
International capital flows and financial vulnerabilities in EMEs: analysis and data gaps
7
funds, acting as a surrogate intermediary (Chung et al (2015), Shin and Zhao (2013)). It could do that via several channels (three of which are shown in Graph 5, bottom panel): it could lend directly to its headquarters; it could extend credit to unrelated NFCs, non-bank financial companies, or the government; and it could make a crossborder deposit in a bank.
NFCs as drivers of international capital flows
Graph 5
A) NFC balance sheet: International component
B) Impact on credit conditions
BoP = Balance of Payments; FDI = Foreign Direct Investment; IBS = International Banking Statistics; IDS = International Debt Securities Statistics; OI = Other Investment; PI = Portfolio Investment. Source: BIS.
8
International capital flows and financial vulnerabilities in EMEs: analysis and data gaps
Growing US dollar credit to selected EME non-banks In billions of US dollars
Graph 6
Brazil
China
Russia
300
900
300
200
600
200
100
300
100
0 01
03
05
07
1
09
11
13
0 01 03 05
15 2
Loans
07 09 11 13 15
0 01
03
3
Debt securities
05
07
09
11
13
15 4
Debt Securities - offshore
Of which: Local loan claims
1 US dollar loans to non-bank residents of the country listed in the panel title. 2 Outstanding US dollar international bonds issued by nonbank residents of the country listed in the panel title. 3 Outstanding US dollar international bonds issued by offshore affiliates of non-banks with a parent entity headquartered in the country listed in the panel title. 4 US dollar loans booked by banks located in the country in the panel title to non-bank borrowers in that country. For China and Russia, figures are estimates based on national data.
Source: McCauley, R, P McGuire and V Sushko (2015): “Dollar credit to emerging market economies”. BIS Quarterly Review, December, pp 27–41.
Estimating major EMEs’ cross-border financing by non-banks1 In billions of US dollars
Graph 7
Group A2
Group B3 1,000
1,000
800
800
600
600
400
400
200
200
0 05
06
07 4
BoP
08
09
10
11
12
13
14
15
05
06
07
08
09
10
11
12
13
14
15
16
5
BIS IBS
1 2 Cumulative flows staring from Q1 2005. Chile, Czech Republic, Hungary, India, Korea , Mexico, Poland, Russia, Turkey and South Africa. 3 China, Brazil, Indonesia, Thailand and the Philippines. 4 BoP = sum of BoP “other liabilities: currency and deposits” and BoP “other liabilities: loans” for each listed country. 5 BIS IBS = Cross-border claims of BIS reporting banks on each listed country.
Sources: IMF Balance of Payments; BIS locational banking statistics by residence (Table A6).
Non-bank financing used to be small in EMEs but has been increasing rapidly in recent years. Up until 2007, cumulative deposit and loan flows in the BoP data tracked closely their counterparts in the BIS International Banking Statistics (IBS) and were thus driven by bank lending. Subsequently, the gap between these series started to grow steadily for a number of countries, an indication that non-banks gained in International capital flows and financial vulnerabilities in EMEs: analysis and data gaps
9
importance as providers of cross-border financing to EMEs (Graph 7, left-hand panel).5
Instrument characteristics matter: type, maturity and currency The third key lesson is that the type, maturity and currency of the underlying instruments matter for understanding the risks from capital flows. Instrument type determines who bears the risks. Equity flows – where potential losses are at least partly absorbed by the provider of funds – are viewed as more benign than debt flows, where losses typically trigger the borrower’s default. Even though FDI is usually thought of as representing benign equity flows, it also includes interoffice transfers of proceeds from off-shore debt issuance.
Maturity The average maturity of EME NFCs’ international debt securities has been increasing (Gruic et al, 2014b). This increase has been particularly pronounced in recent years and has coincided with larger issuance (Graph 8).
Rising volumes and lengthening maturities (weighted averages)1 Gross issuance by emerging market non-bank corporations, in years Nationality basis
Graph 8
Residence basis 12
12
10
10
8
8
6
6
4 00
02
04
06
08
10
12
14
4 00
02
04
06
08
10
12
14
Non-banks from Bulgaria, Brazil, Chile, China, Colombia, Czech Republic, Estonia, Hong Kong SAR, Hungary, Indonesia, India, Iceland, Korea, Lithuania, Latvia, Mexico, Malaysia, Peru, Philippines, Poland, Romania, Russia, Singapore, Slovenia, Thailand, Turkey, Venezuela and South Africa. Nationality basis refers to firms with headquarters in the selected countries. Residence basis refers to firms resident in the selected countries. The size of balloons reflects relative volume of annual gross issuance of long-term securities. Gross issuance for 2013 were 265 billion dollars (nationality basis) and 152 billion dollars (residence basis). The data for 2014 is up to June.
1
Sources: Gruić, B, M Hattori and H Shin (2014): “Recent changes in global credit intermediation and potential risks”, BIS Quarterly Review, September, pp 17–18.
Longer maturities mitigate rollover risk for borrowers, but at the expense of greater duration risk for investors. Although institutional investors do not operate with much leverage, a materialisation of their duration-related risks could generate leverage-like behaviour if they are subject to risk limits, relative performance metrics,
5
10
For certain EMEs, this empirical exercise also reveals potential data inconsistencies, which surface as BoP series below the corresponding IBS series (Graph 7, right-hand panel). Section 3 below explains this point.
International capital flows and financial vulnerabilities in EMEs: analysis and data gaps
or engage in dynamic hedging. This could disrupt market functioning and thus spill back to the borrowers. Even though certain EME borrowers, such as commodity exporters, may be protected against market disruptions through natural hedges for their coupon payments (Chui et al (2014)), their hedging of principal redemptions may be incomplete. Thus, to the extent that the duration risk stemming from lengthening maturities exacerbates market disruptions, it could eventually increase rollover problems.
Currency of denomination The years since the crisis have seen rapid growth in US dollar credit outside the United States as well as, to a lesser extent, euro-denominated credit outside the euro area. Since the crisis, an increasing share of this has taken the form of debt securities rather than banking claims: the debt securities’ share has grown from 38% in 2008 to 46% at end-2015. And a significant portion has gone to emerging-market borrowers. At end-2015, of $9.7 trillion in US dollar debt outside the United States, a third was accounted for by EME residents.6 The currency and residence dimensions need not coincide. Examples of this are the strains in offshore RMB market outside China and the wave of foreign exchange borrowing by the household sector in central and eastern Europe, mainly in Swiss Francs or euros. Even when extended between residents, foreign currency debts do not “cancel out”, as exchange rate changes, for instance, can push the debtors into bankruptcy. The currency dimension within a given jurisdiction takes on additional significance when NFCs are involved, given the opaqueness of their balance sheets and their cross-border activities. Graph 6 plots the total US dollar-denominated credit to non-bank borrowers (including sovereigns) in three large EMEs – Brazil, Russia and China. Since the Great Financial Crisis, US dollar credit has grown substantially in all three countries (McCauley et al, 2015). Relative to GDP, this credit has doubled from its respective post-crisis lows in China (from 5% to 11%) Russia (from 13% to 26%) and increased even more in Brazil (from 8% to 19%). That said, for Brazil and China, these ratios are still slightly below the peaks reached in the early 2000s. As foreign currency liabilities have increased, it is important to quantify balance sheet currency mismatches and to identify the sectors with significant foreign currency exposures. Substantial foreign exchange reserves means that, at end-2015, the main emerging market countries still had a positive net foreign currency asset position in aggregate (Graph 9). That said, the non-government sector had a sizable and widening net foreign currency liability position in many of these countries (lefthand panel), although not in others (right-hand panel). This was largely because of increased foreign currency borrowing by the non-financial corporate sector. To what extent were the currency mismatches hedged? Export revenues typically provide companies with a “natural hedge”, but foreign currency debts have risen much faster than export revenues. Foreign currency assets may also provide a hedge. Alternatively, the mismatches may be hedged through derivatives. In order to study the impact of such hedging on financial stability, it is important to identify the
6
Section 3 below describes the methodology used to estimate credit to non-bank borrowers, broken down by currency and borrower nationality.
International capital flows and financial vulnerabilities in EMEs: analysis and data gaps
11
ultimate bearer of exchange rate risk and study its loss absorbing capacity. This underscores the value of better data on corporate financial assets and on their corporate hedging activities (see also Section 3).
Net foreign currency assets as a percentage of exports1 In percentages
Graph 9
Group A3
Group B4
Government + non-government 0
120
–20
60
–40
0
2
Non-government
–60
–60 96 97 98 99 00 01 02 03 04 05 06 07 08 09 10 11 12 13 14 15
96 97 98 99 00 01 02 03 04 05 06 07 08 09 10 11 12 13 14 15
For net foreign currency assets, outstanding positions of year-end. Calculated with aggregates of the economies listed in footnotes 34. 2 Excluding the central bank and general government assets/liabilities where these can be identified separately. 3 Brazil, Chile, Colombia, the Czech Republic, Hungary, Indonesia, Malaysia, Mexico, Peru, the Philippines, Poland, South Africa, Thailand and Turkey. 4 China, Chinese Taipei, India, Korea and Russia. 1
Source: M Chui, E Kuruc and P Turner (2016): “A new dimension to currency mismatches in the emerging markets - non-financial companies”, BIS Working Paper, no 550, March 2016.
Capital flows can be self-reinforcing A final lesson is that capital flows can generate self-reinforcing asset price dynamics. For one, capital flows can feed on themselves. Inflows can improve the perceived stability and success of the recipient economy, thereby generating more inflows. Symmetrically, outflows, by increasing the perceived riskiness of borrowing economies, can generate further outflows. And this may trigger contagion. For example, internationally active investors may respond to higher perceived risk in one economy by pulling back from others in the same geographic region. Investors may also engage in “proxy hedging” – that is, selling obligations in deeper, more liquid markets in response to risks arising from smaller, less liquid ones. Another set of dynamics relates to the “risk-taking channel” of exchange rates, or the tendency to borrow in an international currency when it depreciates (Shin, 2015 and 2016). The depreciation of a global funding currency – typically, the US dollar – raises the net worth of, say, EME corporates that have borrowed in that currency but have assets denominated in their home currency. And the higher net worth facilitates further borrowing in the global funding currency, thus generating international capital flows into EMEs and a further strengthening of their currencies. The process also works in reverse: a stronger US dollar, by reducing the net worth of foreign borrowers, leads to a reduction in their positions and further depreciation pressure on the local currency (Graph 10, left-hand and centre panels). More recently, similar dynamics seem to have underpinned the link from euro depreciation to greater eurodenominated borrowing (right-hand panel).
12
International capital flows and financial vulnerabilities in EMEs: analysis and data gaps
Risk taking channel of the exchange rate
12 8 4 0 –4 –8
8 4 0 –4 –8 –12
–12 –6
–3 0 3 6 9 12 USD nominal effective exchange rate (q-q change, in %)
EUR-denominated bank credit to borrowers outside euro area (coef= –0.459; p-val= 0.018)2 6
Growth rates in EUR lending (%)
USD-denominated bank credit to EMEs (coef= –0.581; p-val= 0.001)1
Growth rates in USD lending (%)
Growth rates in USD lending (%)
USD-denominated bank credit to borrowers outside the US (coef= –0.503; p-val= 0.000)1
Graph 10
4 2 0 –2 –4
–16 –6
–3 0 3 6 9 12 USD nominal effective exchange rate (q-q change, in %)
–6 –8
–6 –4 –2 0 2 4 EUR nominal effective exchange rate (q-q change, in %)
Note: Positive changes in FX rate mean that the US dollar or the euro has appreciated. 1
The observations cover the period from Q2 2002 to Q3 2015.
2
The observations cover the period from Q1 2010 to Q3 2015.
Sources: National data; BIS Locational Banking Statistics; BIS calculations.
3. Empirical methodology and data gaps BoP data provide useful but insufficient information for the analysis of capital flows in a world in which corporate balance sheets straddle national borders. The BoP accounting framework lists broad categories such as FDI and portfolio flows, but does not separate the flows associated with corporate activity from those of the financial sector. These shortcomings could be overcome to a large extent by combining BoP sub-categories with the BIS International Banking Statistics (IBS) and International Debt Securities Statistics (IDSS). The resulting metrics shed light on the evolution of corporate balance sheets and credit conditions. The rest of this section describes the methodology used to create the above metrics before turning to remaining data gaps.
a. Global Liquidity Indicators (GLIs) The BIS IBS and IDSS are key inputs into the production of the BIS Global Liquidity Indicators (GLIs), which constitute part of the BIS’s support for the G20’s activities. More concretely, the BIS IBS provide information on cross-border bank loans, while the BIS IDSS are used to obtain information about the issuance of international debt securities. The breakdowns available in the two BIS datasets make it possible to decompose the above global credit aggregates by borrowing country, borrowing sector and currency of denomination (Graph 6). The BIS IDSS contain two additional useful dimensions. First, these data reveal both the residence and nationality of debt issuers. In the light of the discussion in Section 2, this is important as it facilitates the tracking of offshore issuance by companies’ foreign affiliates. For example, combined with a currency breakdown, it makes it possible to estimate offshore debt issuance (Graph 6, yellow areas). By
International capital flows and financial vulnerabilities in EMEs: analysis and data gaps
13
contrast, data based on the BoP principle miss affiliates’ offshore activities and provide little information about positions in different currencies. Second, the IDSS provide detailed information on the maturity of international debt securities. This information can be used to analyse the maturity profile of the (onshore and offshore) international debt securities issued by borrowers from a given country and sector.
b. Cross-border lending by non-banks Combining BoP statistics with the BIS IBS can shed light on the importance of nonbank corporates in providing cross-border funding to EMEs (Table 1). The BoP data capture aggregate cross-border liabilities to external creditors (the sum of cells A, B, C and D). By contrast, the IBS focus on cross-border liabilities to offshore banks (cells A and B). Importantly, the difference between the two series is an estimate of nonbank external financing (the sum of cells C and D). A comparison between the BoP statistics and the BIS IBS reveals a puzzle that suggests potentially important data quality issues. Namely, for several large EMEs, the overall level of external loans and deposits in the BoP data falls short of the corresponding bank lending in the IBS (Graph 7, right-hand panel). In principle, this could be explained by declines in the stocks of non-bank credit. In practice, such declines are highly unlikely over the period examined. This points to an alternative explanation: inconsistencies in the reporting of external liabilities.
Coverage of external loans and deposits in the BoP and IBS data
Table 1 Borrowing country
Banks
Non-banks
Banks
A
B
Non-banks
C
D
Lending country
Captured by both BoP and IBS data.
Captured only by BoP data.
Sources: Avdjiev, S, M Chui and H Shin (2014): “Non-financial corporations from emerging market economies and capital flows”, BIS Quarterly Review, December, pp 67–77.
c. Data gaps A number of important data gaps still exist. The first major data gap is related to underlying corporate exposures. As discussed above, the BIS IDSS data provide useful information on the currency composition and maturity structure of corporate liabilities. However, the data are inadequate for hedging activities and other derivatives-related positions. In addition, there are no international data on corporates’ financial assets (currency composition and maturity, banks as counterparts, holdings of shadow banking products, etc). This contributes to the uncertainty about the volume of foreign currency exposures, the links with the banking system and the degree to which hedging reduces systemic risk. There are three different approaches for improving data on corporate hedging in particular. The first would be enhanced disclosures of financial hedges via improved accounting standards (eg providing detailed currency and maturity
14
International capital flows and financial vulnerabilities in EMEs: analysis and data gaps
information on financial hedges and their underlying positions, including those not qualifying for hedge accounting). The second would be to collect information on corporate hedges through existing BoP data surveys, leveraging the statistical infrastructure and legal reporting requirements, possibly based on a common template across countries (Kofanova et al, 2015). The third would be to obtain information on outstanding derivatives positions directly from trade repositories and central counterparties (possibly also on a cross-border basis to capture off-shore derivative activities). The second data gap is related to NFCs’ off-shore foreign-currency borrowing from banks. Concretely, there is no bank-loan counterpart to IDSS data on the nationality of the issuers of off-shore debt securities in a particular currency. In terms of Graph 6, there is no bank-loan counterpart to the yellow areas. Part of this gap could be filled by the BIS Consolidated Banking Statistics (CBS) on an ultimate-risk basis, which do account for parent guarantees. However, unlike the IDSS, the CBS provide no currency breakdown. More importantly, parent guarantees in CBS are reported only as a part of a broader category called “risk transfers”. This category includes a number of additional items, such as credit protection bought (via CDS contracts) by lending banks, thus introducing noise in estimates of the amount of bank loans extended to NFCs’ foreign subsidiaries. The third major data gap is related to financial statements for non-listed companies. Firm-level data indicate that, in some jurisdictions, growth in foreign currency borrowing has been concentrated among riskier non-listed firms, including property developers in countries such as China (CGFS and FSB, 2014). Such “pockets of risk” put a premium on more granular analysis of these firms, but detailed data (eg from income statements) are often unavailable. Existing fixes of this data gap – which are country specific and/or rely on nonlisted companies’ issuing debt on public markets – fall short of matching the coverage of larger, listed companies. This calls for further efforts. For instance, important missing information could be obtained from country-level surveys of consolidated corporate balance sheet positions, focusing specifically on the sectoral, currency and maturity breakdowns of external debt. Alternatively, given that unlisted firms are more likely than their listed peers to depend on bank financing, information obtained through banks (eg through supervisory channels) may be a viable way forward for some jurisdictions.
International capital flows and financial vulnerabilities in EMEs: analysis and data gaps
15
References Avdjiev, S, R McCauley and P McGuire (2012): "Rapid credit growth and international credit: challenges for Asia", BIS Working Papers, no 377, April. Avdjiev S, R McCauley and H S Shin (2015): “Breaking free of the triple coincidence in international finance”, BIS Working Papers, no 524, October. Bank for International Settlements (2015a): “Global liquidity indicators: background and interpretation”, Quarterly Review, March, pp 20–21. ——— (2015b): “What do new forms of finance mean for EM central banks?”, BIS Papers, no 83, November. ——— (2011), “Global liquidity: insights from the BIS statistics”, note for a meeting of the G20 Sub-Working Group on global liquidity management, 25 March. Borio, C, R McCauley and P McGuire (2011): "Global credit and domestic credit booms", BIS Quarterly Review, September, pp 43–57. Borio C, H James and H S Shin (2014): “The international monetary and financial system: a capital account historical perspective”, BIS Working Papers, no 457, August. Borio C and P Disyatat (2011): “Global imbalances and the financial crisis: link or no link?”, BIS Working Papers, no 346, May. ——— (2015): “Capital flows and the current account: Taking financing (more) seriously”, BIS Working Papers, no 525, October. Committee on the Global Financial System and Financial Stability Board (2014): “Summary: Joint CGFS – FSB-SCAV workshop on risks from currency mismatches and leverage on corporate balance sheets”, September. Chung, K, J Lee, E Loukoianova, H Park and H S Shin (2015): "Global liquidity through the lens of monetary aggregates", Economic Policy, 82, 231–290. Chui, M, E Kuruc and P Turner (2016): “A new dimension to currency mismatches in the emerging markets: non-financial corporates,” BIS Working Papers, no 550, March. Chui, M, I Fender and V Sushko (2014): "Risks related to EME corporate balance sheets: the role of leverage and currency mismatch", BIS Quarterly Review, September, pp 35–47. Drehmann M, C Borio and K Tsatsaronis (2011): “Anchoring countercyclical capital buffers: the role of credit aggregates”, International Journal of Central Banking, vol 7(4). Drehmann M and M Juselius, (2012): “Do debt service costs affect macroeconomic and financial stability?", BIS Quarterly Review, September. Financial Stability Board and International Monetary Fund, (2015): “Sixth Progress Report on the Implementation of the G-20 Data Gaps Initiative", September. Gruić, B, M Hattori and H S Shin (2014a): "Recent changes in global credit intermediation and potential risks", BIS Quarterly Review, September, pp 17–18. Gruić, B, C Upper and A Villar (2014b): "What does the sectoral classification of offshore affiliates tell us about risks?", BIS Quarterly Review, December, pp 20–21.
16
International capital flows and financial vulnerabilities in EMEs: analysis and data gaps
Kofanova S, A Walker and E Hatzvi (2015): “US Dollar Debt of Emerging Market Firms”, Reserve Bank of Australia, Bulletin, December. McCauley, R, P McGuire and V Sushko (2015): "Global dollar credit: links to US monetary policy and leverage", Economic Policy, vol 30(82), April, pp 187–229; also BIS Working Papers, no 483, January. McGuire, P and G von Peter (2012): "The US dollar shortage in global banking and the international policy response", International Finance, vol 15(2). Shin, H S (2015): “Exchange rates and the transmission of global liquidity”, speech at Bank of Korea-IMF Conference, 11 December. ——— (2016): “Global liquidity and pro-cyclicality”, World Bank conference, “The state of economics, the state of the world.” 8 June. Shin, H S and L Zhao (2013): "Firms as surrogate intermediaries: evidence from emerging economies", working paper, December.
International capital flows and financial vulnerabilities in EMEs: analysis and data gaps
17
Annex: Data gap initiatives The Sixth Report on the Implementation of the G-20 Data Gaps Initiative (DGI) has set out a proposal for a second phase of the DGI (DGI-2).7 Several of the recommendations seek to improve the monitoring of capital flows and the analysis of their impact on financial stability.
International Banking Statistics (IBS) Recommendation II.11: G-20 economies to provide enhanced BIS international banking statistics. BIS to work with all reporting countries to close gaps in the reporting of IBS, to review options for improving the consistency between the consolidated IBS and supervisory data, and to support efforts to make data more widely available.
Securities Statistics Recommendation II.7: G-20 economies to provide on a quarterly frequency debt securities issuance data to the BIS consistent with the Handbook on Security Statistics (HSS) starting with sector, currency, type of interest rate, original maturity and, if feasible, market of issuance. Reporting of holdings of debt securities and the sectoral from-whom-to-whom data prescribed for SDDS Plus adherent economies would be a longer term objective. BIS, with the assistance of the Working Group on Securities Databases, to monitor regular collection and consistency of debt securities data.
Cross border exposures of non-bank corporations Recommendation II.14: The IAG to improve the consistency and dissemination of data on non-bank corporations’ cross-border exposures, including those through foreign affiliates and intra-group funding, to better analyse the risks and vulnerabilities arising from such exposures including foreign currency mismatches. The work will draw on existing data collections by the BIS and the IMF, and on the development of the OECD framework for foreign direct investment. The G-20 economies to support the work of the IAG.
Derivatives Recommendation II.6: BIS to review the derivatives data collected for the International Banking Statistics (IBS) and the semi-annual over-the-counter (OTC) derivatives statistics survey, and the FSB, in line with its 2014 feasibility study on approaches to aggregate OTC derivatives data, to investigate the legal, regulatory, governance, technological, and cost issues that would support a future FSB decision on the potential development of a mechanism to aggregate and share at global level OTC derivatives data from trade repositories. The G-20 economies to support this work as appropriate.
7
18
FSB-IMF (2015).
International capital flows and financial vulnerabilities in EMEs: analysis and data gaps
Securities financing Given the growing policy interest and the calls for consistent data, there is a need to fill the data gaps for the shadow banking system. To this end, DGI-2 calls on G-20 economies to contribute to the enhancement of data collection through the FSB monitoring process, including the provision of sectoral accounts data and the implementation of the conceptual framework on securities financing data. Recommendation II.5: The G-20 economies to enhance data collection on the shadow banking system by contributing to the FSB monitoring process, including through the provision of sectoral accounts data. FSB to work on further improvements of the conceptual framework and developing standards and processes for collecting and aggregating consistent data at the global level.
International capital flows and financial vulnerabilities in EMEs: analysis and data gaps
19