Research Journal of Business Management and Accounting Vol. 1(3), pp. 030 - 039, October 2012 Available online at http://www.wudpeckerresearchjournals.org 2012 Wudpecker Research Journals ISSN 2277 0712
Full Length Research Paper
Infrastructure and economic growth in Nigeria: A multivariate approach 1
Onakoya Adegbemi Babatunde, 2Salisu A. Afees, 3Oseni Isiaq Olasunkanmi
1
Department of Economics, College of Social and Management Sciences, Tai Solarin University of Education,Ijebu Ode, Nigeria. 2 Department of Economics, University of Ibadan, Nigeria. 3 Department of Economics, Accounting and Finance, Bells University of Technology Otta, Nigeria. Accepted 08 October 2012
This paper attempted to investigate the impact of infrastructure on economic growth in Nigeria. A multivariate model of simultaneous equations was deployed. The paper also utilized three-stage least squares technique to capture the transmission channels through which infrastructure promotes growth. The research covered 40 years (1970 to 2010). The finding shows that infrastructural investment has a significant impact on output of the economy directly through its industrial output and indirectly through the output of other sectors such as manufacturing, oil and other services. The agricultural sector is however not affected by infrastructure. The results also show a bi-directional causal relationship between infrastructure and economic growth. The paper recommended increased investment in infrastructure. Also, the financing options for closing Nigeria’s infrastructure gaps should focus on broadening the sources of finance and a better allocation of public resources In this wise, the government should intensify the utilization of the public-private-partnership (PPP) framework. Key words: Infrastructure, causality, economic growth, macroeconometric model, economy of Nigeria.
INTRODUCTION A number of theoretical expositions that demonstrate the linkages between infrastructure and economic growth have been provided in the endogenous Growth theories. Canning and Petroni (2004) investigate the long run impact of infrastructure provision on per capita income in a panel of countries over the period 1950 to 1992 and provide evidence that in majority of cases infrastructure stimulate long run growth effects. Udjo et al. (2000) also identify infrastructure as having both direct and indirect impact on the growth of an economy. Infrastructure is said to add to economic growth and development by raising efficiency and providing facilities which enhance the quality of life. Infrastructure as defined by Akinyosoye (2010) is the “unpaid factor of production” which tends to raise productivity of other factors while serving as intermediate inputs to production. The services engendered as a result of an adequate infrastructure base will translate to an increase in aggregate output. Canning and Fay (1993) also found that the developing
*Corresponding author E-mail:
[email protected].
countries demonstrated a high rate of return on transport infrastructure which compared favourably with those of developed countries. The current level of infrastructure deficit in Nigeria has been identified by Sanusi (2012) as the major constraint towards achieving the nation’s vision of becoming one of the 20 largest economies in 2020. He further proffered that about 70 percent of the 193,000 kilometres of roads in the country is in poor condition; that enterprise surveys show that the power outages the nation experiences amount to over 320 lost days a year, with over 60 percent of the population lacking access to electricity with over $13 billion spent annually to fuel generators and that that Nigeria, which once had one of the most extensive railway systems in Africa, could now barely boast of a functional route either for passengers or freight . According to National Bureau of Statistics (NBS) over the last decade, Nigeria’s infrastructure spending contributed a 1.9% (approximately $4 billion) per annum to GDP. The recommendation of the Asian Development Bank in the KPMG report is that in order for a developing country to sustain growth and development, not less than 6% of GDP should be invested on infrastructure. Sanusi
31
Res. J. Bus. Manage. Acc.
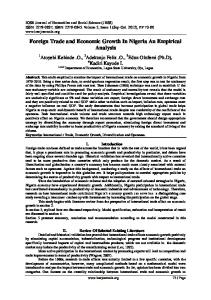
(2010), reports that Nigeria is currently investing about 7% of GDP on infrastructure, which is above the average for Sub-Saharan Africa. He however expressed the need to increase this figure to at least 12% of the GDP. Following from the above, infrastructure can be said to be more than just being a factor of production, but rather a veritable condition for increased rate of economic growth. From the endogenous growth models, infrastructure leads economic growth while the Wagner’s law regards the increase in GDP as a main drive for public infrastructural investment. Some of the literature in fact report negative or non-significant growth impact of public investment. Since there is no consensus in the theoretical literature as to the direction of causality, this paper therefore seeks to investigate the impact of infrastructure on economic growth in Nigeria. The study covers 40 years (1970 to 2010) which accounts for about 77% of the life of the country since its independence. LITERATURE REVIEW Conceptual framework The possibility of a long run impact from innovations in infrastructure to income growth is intimately related to the issue of whether the data are generated by a neoclassical growth model, in which technical progress drives long run growth, or an endogenous growth model in which shocks to capital accumulation can have a long run impact. In the exogenous growth model, shocks to the infrastructural stock can only have transitory effects, but in an endogenous growth model, shocks to infrastructure can lead to permanent changes in per capita income (Canning and Pedroni, 2004). The conceptual framework of the theoretical linkage between infrastructural investment and economic growth is presented in Figure 1. The channel of infrastructural transmission to economic growth is manifested only through the economic growth indicators (GDP, industrial production, employment, price stability, education, technology, openness, knowledge, innovation). The nature of transmission is determined by the role of infrastructure capital in the production function i.e. whether it is a direct or intermediate input. As a direct input, it can either be guided by market forces, in which case it is or provided by the government as a public good. Where infrastructure capital is an intermediate input in the production process, the indirect transmission channel through which infrastructure affects growth is determined by three factors. These are productivity of physical capital which is in turn determined by reduction in adjustment costs and maintenance of existing infrastructure also derived from the facilitation of reallocation of capital. The second variable is higher labour productivity obtained from improved human capacity development. The transmission impact
through human development can be realized through improving health better nutrition, education, better Roads, access to electricity, telecommuting, etc. The third factor is the externalities which transmit key technological innovations to other sectors leading to involve lower costs, and spill-over effects on other firms and therefore, on the economy as a whole. Overview of Nigeria economy Nigeria is classified as a mixed economy emerging market, and has already reached middle income status according to The World Bank, (2011) with its abundant supply of natural resources, well-developed financial, legal, communications, transport sectors and stock exchange which is the second largest in Africa. The country is the 12th largest producer of petroleum in the world and the 8th largest exporter, and has the 10th largest proven oil reserves. Petroleum plays a large role in the Nigerian economy, accounting for 40% of GDP and 80% of Government earnings (United States Energy Information Administration Independent Statistics and Analysis, (2010). Decades of economic stagnation and declining living standards have turned Nigeria poorest region. Economy has neither been able to leverage the country’s vast wealth in natural resources to overcome poverty that affects about 57 percent of its population nor use the derived wealth to boost her economy. The co-existence of vast wealth in natural resources and extreme personal poverty in developing countries like Nigeria is referred to as the “resource curse” or 'Dutch disease' (Auty, 1993). Nigeria’s economy is highly inefficient. The size of the economy marked by the Gross National Income per capita is put at US$1,190 and ranked 162 out of 213 countries in the World Development Index (WDI) in 2009 (The World Bank, 2011). The GDP per capita of Nigeria expanded by 132 percent between independence in 1960 and 1969, and rose to a peak growth of 283 percent between 1970 and 1979. There were also high inflation, high unemployment rate and fiscal imbalance. The problems were so severe that restructuring of the economy was inevitable. Consequently, a comprehensive economic reform package was introduced in 1986. In the period 1988-1997 which constitutes the period of structural adjustment and economic liberalisation, the GDP responded to economic adjustment policies and grew at a positive rate of 4 percent. The real GDP growth rate in 2006 was indeed 7 percent. Available statistics released by the National Bureau of Statistics (NBS, 2010) further shows that on an aggregate basis, the economy when measured by the Real Gross Domestic Product (GDP), grew by 7.87% in 2010. (National Bureau of Statistics (NBS), various years and Central Bank of Nigeria (CBN) various years).
Babatunde et al.
32
Infrastructure Capital
Direct Transmission Direct Production Input
Indirect Transmission Economic Growth Indicators *Real GDP; *Industrial
Public, NonRival, Non Excludable Good
Market Mediated Stock
Production
Intermediate Input
Physical Capital Productivity
Labour Productivity
*Employment *Price Stability *Education *Technology *Openness *Knowledge *Innovation
Reduction in Adjustment Costs *Complimentarity btw Public & Private Infra *Facilitation of reallocation of capital
Externalities & Spill-over Effects thro’ Economic Sectors / Industries
Maintenance of Existing Infra: *Durability of Public Infrastructure *Efficiency of Private Infrastructure
Improved Human Capacity Devt. thro’ *Nutrition, *Health *Education. *Better Roads, * Access to Electricity * TeleCommuting etc
Economic Growth Figure 1. Theoretical flow of the transmission channels through which infrastructural investment affect economic growth. Source: Adapted from Onakoya et al. (2012).
Summary of the literature review and gap to be filled The literature is not conclusive on the effect of infrastructure on economic growth. There are studies that establish little or no significantly positive relationship between infrastructure and economic growth (see GarciaMila et al. 1996; Holtz-Eakin, 1994; Holtz-Eakin and Schwartz, 1995 and Ayogu, 2007). Snieska and Simkunaite (2009) observed that it is the characteristic of each country that determines the set of infrastructure components and the aspect of impact on social and economic development economic growth. The empirical test also proved that the direction of relationship differs in Lithuania and Latvia which are attributed to the same level development and these results contradict the findings in scientific literature. There is also the body of works that have found some limited positive impact of infrastructure on growth (see Aschauer, 1989; Barro, 1990; Canning and Pedroni, 2004; Sanchez-Robles, 1998; The World Bank, 1994). In Nigeria, Akinlabi et al. (2011) examine the impact of
investment in public infrastructures on poverty alleviation and consequently economic development. Using Cointegration and Granger causality test for the period 1981 to 2006, they found public infrastructure Granger cause GDP, but fiscal deficit does not Granger cause GDP. Ijaiya and Akanbi (2009) found long term linkages between infrastructure and economic growth. The link between infrastructure and growth in African countries (South Africa, Nigeria, Uganda and others) has also been shown to be positive by Foster (2009) in the Africa Infrastructure Country Diagnostic report (AICD, 2009). Some early studies on the relationship public infrastructure e.g. Aschauer (1989) have suffered from simultaneity bias and spurious correlation. Fedderke and Bogetic (2006) examine the impact of infrastructure investments in South Africa. They observed that past studies have shown the effect of public infrastructure investment on economic growth to be ambiguous. They contend that this result is due to not controlling the endogeneity of infrastructure investment. When they control the endogeneity of infrastructure investment,
33
Res. J. Bus. Manage. Acc.
their findings is that infrastructure investment has a positive effect on economic growth and development. There is the need to determine the inter- sectoral linkage impact of infrastructure on the economy. This is underscored by the fact that infrastructure, apart from serving as a direct input, can also be an intermediate input in the production process. Thus, activities of the real sector of the economy are influenced by infrastructural investment and consequently their contributions to economic growth e.g. (Murty and Soumya, 2005, 2006). Theoretically, ignoring these sectoral multiplier effects, when in fact they exist, may lead to biased and inefficient results. In the absence of a consensus in the theoretical literature as to the significance and indeed direction of causality, this paper seeks to investigate the impact of infrastructure on economic growth in Nigeria. The next discussion thus focuses on the methodology and model specification. METHODOLGY AND MODEL SPECIFICATIONS Methodology The paper deploys the three stage least squares (3SLS) which by its design takes care of any probable occurrence of non-stationarity and consequential possibility of spurious regressions. This is because 3SLS incorporates lag terms of both the dependent and independent variables in the estimation process and in addition addresses the correction of contemporaneous correlation of error terms, therefore obviates the need for stationarity tests. In the estimated model of this study, the 18 equations are all over-identified which satisfies the prerequisite condition for the use of 3SLS technique. We also performed posterior tests to ascertain the reliability of the results obtained. The normality test is used to examine whether the disturbances are normally distributed or not (Jarque and Bera, 1980). The serial correlation test examines whether the present value of the residuals depends on its past value. The estimation of the model was carried out with the use of E- ViewsTM (version 6.1).
industry commenced only in the last decade. The macro econometric model depicting the inter-linkages between the sectoral blocks of the economy. The supply block which is the aggregate output of the real sector of the economy, consists of the Output of infrastructure and those of the noninfrastructure constituents. The latter is made up of the outputs of manufacturing, agriculture, oil and services.
Supply block YIF = a1 + a2 GCRIF + a3 FDIIF + a4 KIF + a5 PIF +e1 ………….. (1) YMFG = a6 + a7 GCRMFG + a8 YIF + a9 YOIF +a10 FDIMFG +a11 KMFG +a12 PMFG + e2 ...........................................................................................................................(2) YAGRIC = a13+ a14 GCRAGRIC +a15YIF +a16 YOIF + a17 FDIAGRIC + a18 KAGRIC + a19RAIN +a20 PAGRIC +e3….....................................(3) YOIL = a21 + a22GCROIL + a23Y IF +a24FDIOIL+ a25KOIL + a 27POIL + a27 OPEC + e4..........................................................................(4) YSERV=a28 +a29YIF+a30FDISERV+a31KSERV + a32PSERV + e5..........(5) The demand block is made up of three demand blocks made up of the private demand (consumption and investment), government expenditure and the external sector. In the private demand block, the consumption is made up of both food and non-food elements. Investment is represented by the infrastructure which is one of the major variables of interest to this study and non-infrastructure components. The non-infrastructural investment consists of manufacturing, agriculture, oil and services.
Demand block Private demand block CF = a33 + a34 PF +a35YDc+a36 IR + e6.......................................(6) CNF = a37 +a38PNF +a39YDc + a40W +e7...........................(7) INVIF =a41+ a42YIF+a43FDI IF +a44GCR IF +a45PIF + e8................(8) INVMFG = a46 + a47YMFG +a48 INVIF + a49 IR+a50 FDIMFG +a51 GCRMFG + a52 PMFG +e9...............................................................................(9) INVAGRIC = a53 + a54YAGRIC +a55INVIF+a56 IR+ a57YD + a58GCRAGRIC + a59 PAGRIC + e10……………………………………………….…...(10) INVOIL = a60 + a61YOIL+a62 INVIF+a63 FDIOIL +a64GCROIL + a65 POIL +e11.........................................................................................(11) INVSERV = a66 +a67YSERV +a68 INVIF +a69FDISERV + a70GCRSERV +a71 PSERV + e12................................................................................(12)
Model specification The model specification for the paper is of the simultaneous equation regression which has been recommended by many scholars including Roller and Waverman (2001), Belaid (2004), Herrera (2001) and Cadot et al. (2006). This method is considered appropriate especially when a dependent (endogenous) variable in one equation appears as explanatory variable in another equation which leads to a feedback distortion between the variables. The structure of the macro econometric model is tailored after the national accounting identity. The theoretical foundation of the model is predicated upon the IS-LM-BOP model. However, infrastructure capital in the case of Nigeria is a function of the market size which determines the growth of the economy. The government was the major player in the provision of infrastructure prior to year 2001. When the market size expands, there is pressure on the public infrastructure which forces the government to increase investments in this sector. The limits in the capacity of the government to solely provide the economic infrastructure gave birth to the involvement of the private sector. The consequential effect of this is that government spending is exogenous and not market-determined. Private sector involvement is a recent feature. Its involvement in the
Government block The components of the government block are government revenue, its expenditure and the fiscal deficit. The external block consists of the export, import and the reserves. GE=a71 +a73GRV+a74(CG)+a75 EDS+a76DDS+a77Y+a78FD+e13…..(13) GRV=a79+a80YIF+a81FDI +a82 NX +e14.........................................(14) FDF=a83+a84FD+a85NFA+a86 EXR + e15......................................(15) External block X=a87+ a88 Y +a89TOT + a90EXR +e16.....................................(16) M=a91=a92 TAR+a93 Y+a94TOT+a95 EXR+ +e17 ……………..…(17) RES =a96 +a97 Y + a98 NFA +a99EXR + a100 FDI + e18............(18) The conceptual framework of the macroeconometric model depicting the inter-linkages between the sectoral blocks of the economy is presented in Figure 2.
Babatunde et al.
Consumption
Private Demand Block
Consumption of Food
Output of Non Infrastructure
Consumption of Non Food
(manufacturing, agriculture, oil and services)
Investment in Infrastructure
Investment
Output of Infrastructure
Government Expenditure
Government Block
34
Government Revenue Fiscal Deficit Export
External Block
Import Reserves
Externalities, Spill-over effects of Technology, R&D and Innovation create linkages across industries/sectors of the economy
Economic Growth Figure 2. Conceptual framework of the macroeconometric model. Source: Authors
Sources of data Time series data used for the estimation covers 1970 to 2010, wereobtained from the Nigerian Bureau of Statistics (NBS, various issues), Central Bank of Nigeria (CBN, various issues), the Nigerian Communications Commission (NCC, various years), United States Energy Information Administration Independent Statistics and Analysis. International Petroleum Monthly (IPM), (2010) (http://www.eia.doe.gov), Energy Information Administration, International Petroleum Monthly (http://www.eia.doe.gov).
in infrastructure (INVIF). The relationship is statistically significant with a t-value of (2.93) at 5% level. The coefficient value of (1.88) suggests that a percentage increase in capital stock would result in about 19% increase in the output of the infrastructural sector. The results of equation 1 reveal that 2
the regressors account for 95% ( R = 0.95) in explaining the variation in the both the output of infrastructure (YIF). 2
DATA ANALYSIS AND DISCUSSION The results are presented in three parts: Investment in infrastructure and output; Output of infrastructure and economic growth and direction of the causality The result of the output infrastructural investment (YIF) as the dependent variable in Table 1 show that the Capital Stock of infrastructure (KIF) is positively related to the output of the infrastructure (KIF) which is the main variable of the paper, serves as the proxy for Investment
Although the adjusted coefficients of determination ( R ) are rather high, the Durbin-Watson Statistics test (2.03)
results is higher. Therefore, the results can be accepted as valid. Therefore, infrastructure can be said to have direct and positive effect on economic growth in Nigeria through the impact of its own industry’s output. Output of Infrastructure and economic growth The estimation result of equation 2 shows that about 96%
35
Res. J. Bus. Manage. Acc.
Table 1. System estimation report: Investment in infrastructure and economic growth.
Dependent Variable
Explanatory Variables Constant GCRIF FDIIF
YIF
1.2684
0.2402
(2.43)
(6.07)
a
KIF
PIF
Equation No
0.102 6
0.1884
0.1035
1
(2.10)
(2.93)
b
(1.68)
a
2
R = 0.96, R =0.95, SE =0.4658, Durbin Watson (DW) Statistics =2.03 Note: a, b imply 1% and 5% significance level respectively. t-statistic in parenthesis TM Source: Authors' computation using E-Views (version 6.1). 2
Table 2. System estimation report: Output of infrastructure in the supply block.
Dependent Variables YMFG YAGRIC YOI L YSERV
YIF as Explanatory Variable 0.2636 b (2.63) 0.3085 (2.44) 0.37285 a (3.25) 1.2233 c (12.14)
R
Durbin-Watson Statistics
Equation No
0.96
1.09
2
0.98
1.66
3
0.99
1.76
4
0.99
1.34
5
2
2
( R = 0.96) of the output of manufacturing (YMFG) is explained by the regressors. Also in equation 3, the dependent variables account for 98 percent of the variation in the outputs of agriculture (YAGRIC). In the same vein, about 99 percent of the variations of in the outputs of oil and services are accounted for by the explanatory variables in equations 4 and 5. The high
output of infrastructure indirectly affects the economic growth Nigeria. The non significance of the output of infrastructure to the output of agriculture is supported by the findings of Jagun et al. (2008) and Pyramid Research (2010) who report that before the advent of the liberalisation of the sector, Nigerian farmers had little access to facilities.
2
values of adjusted coefficient of determination ( R ) although indicative of a specious result, can be considered valid in view of the fact that the DurbinWatson Statistics (DW) for each of the regression is higher than the respective . The results show that output of infrastructure (YIF) is not statistically significant in explaining the output of agriculture. It is however significantly related to the outputs of the oil at 1 percent. This is due to the prevalence of the use of information, communications technology and the crucial role of logistics both in the up and down streams of the oil and gas industry. The significance of infrastructure in the manufacturing and service sectors at 5 percent and 10 percent respectively bear testimony to the capital intensive nature of modern service sector. Indeed, the delivery of service is through infrastructure Since the outputs of all these sectors are positively related to the output of the infrastructure, with three of the four sectors being significant, we can, surmise that the investment in infrastructure through the
Direction of causality In this section, we check the causal relationship between infrastructure and economic growth in order to know the extent and the predictive power of the relationship. This involves the examination of the causal relationship between the output of infrastructural investment (YIF) equation 1 and the investment in infrastructure (INVIF) equation 8. The results of equations 1 and 8 reveal that the 2
regressors account for 95 percent and 97 percent ( R = 0.95 and
R 2 = 0.97) respectively in explaining the variation
in the both the output of infrastructure (YIF) and capital stock. Although the adjusted coefficients of determination 2
( R ) are rather high, the Durbin-Watson Statistics (DW) test results are higher in both cases. Therefore, the results can be accepted as valid. The results of equations 1 and 8 indicate that an increase in infrastructural
Babatunde et al.
36
Table 3. System estimation report: Causal relationship between the impact of investments in and the output of infrastructure.
Dependent Variables Y IF
INV IF
Explanatory Variables 0.1884 KTIF b (2.93) 0.1827 Y IF b (4.51)
R
Durbin-Watson Statistics
0.95
2.03
0.97
1.34
2
Equation No. 1
8
Note: a and b imply 1% and 5% significance level respectively. t-statistic in parenthesis TM Source: Authors' computation using E-Views (version 6.1).
Table 4. System Normality Tests (Joint Result)
Component Joint
Jarque-Bera 659.2963
df 10395
Prob. 0.9917
Source: Author's computations. Note:df is degrees of freedom for (approximate) chi-square distribution. Null Hypothesis: Residuals are multivariate normal.
Table 5. System Portmanteau Tests for Autocorrelations.
Lags 1 2 3 4
Q-Stat 426.4443 804.9607 1193.362 1542.235
Prob. 0.1740 0.4442 0.5486 0.8466
Adj Q-Stat 437.3787 835.8170 1255.711 1643.347
Prob. 0.0958 0.1843 0.1285 0.2203
df 400 800 1200 1600
Source: Author's computation. Note:df is degrees of freedom for (approximate) chi-square distribution. Null Hypothesis: No residual autocorrelations up to lag h.
investment leads to an increase in infrastructure output and a rise in output of infrastructure also brings about a rise in investment in infrastructure. Consequently, there is a bi-directional causality between infrastructural investment and output of infrastructure. The preceding discussions indicate that investment in infrastructure has both direct and indirect impact on Nigeria’s economic growth. The discussion also shows a bi-directional relationship between the two variables. In addition, the result supports the endogenous growth theory which indicates that the stock of infrastructure is determined endogenously within the model. The results further confirm the inter-sectoral linkage effects of infrastructure in the economy hitherto omitted in the literature. Post estimation tests The results of the post-estimation tests conducted to ascertain the reliability of the estimates show that the disturbances are normally distributed (see Table 4). The probability value (0.99) of the joint estimation of JarqueBera Test obtained shows that the Null hypothesis cannot
be rejected. In addition, the serial correlation tests show that the present value of the residuals do not depend on their past values. For the estimated result of the test, the research found that there is no serial correlation problem up to lag 4 for the system variable models. Specifically, the probability values for lag 1, 2, 3 and 4 in Table 5 are (0.1), (0.18), (0.13) and (0.22) respectively. These are far greater than the conventional level of significance of 5 percent (0.05). As a consequence, the study does not reject the Null hypothesis, implying that there is no serial correlation. In the next section, the conclusion and recommendations are presented. Conclusion and recommendations The paper has reviewed the impact of infrastructure on economic growth. The results of the paper are consistent with similar results of other countries. The study has ascertained that investments in infrastructure both directly and indirectly significantly affect economic growth in Nigeria. The research also shows a bi-directional relationship between the two variables. The output of the industry is also considered an important determinant of
37
Res. J. Bus. Manage. Acc.
output of other sectors with forward and backward linkages in the economy. The results of the study further show that government should increase the funding of the development of infrastructure particularly in line with the lessons learnt from the Korean government which has invested in the postwar period on construction of roads, power stations, electricity and communication which created jobs, roused the economy, reduce the production costs indirectly and raise their productivity. The financing options for closing Nigeria’s infrastructure gaps should focus on broadening the sources of finance and a better allocation of public resources In this wise, the government should intensify the utilisation of the public-private-partnership (PPP) framework as exemplified by the USD 385million Lekki-Epe toll road in Lagos and as obtained in Morocco where nearly twothirds of electricity production is by private producers. This paper has made a case for infrastructure investment in order to engender economic growth and development Future search needs to address in depth the exact dynamics of investment in infrastructure, identify threshold effects and collect information on quality and maintenance. REFERENCES Akinlabi BH, Kehinde JS, Jegede, CA (2011). Public infrastructures: An approach to poverty alleviation and economic development in Nigeria. The European Journal of Humanities and Social Sciences, ISSN 2220-9425 4(1): (Special Issue) Akinyosoye M (2010). Infrastructure development in Nigeria: Road map to sustainable development Working Paper Aschauer DA (1989). Is public expenditure productive? J. Monetary Econ., 23, 177-200. Auty RM (1993). Sustaining Development in Mineral Economies: The Resource Curse Thesis. London: Routledge. Ayogu M (2007). Infrastructure and economic development in Africa. A review. J. African Econ., 16: 75-126. Barro RJ (1990). Government spending in a simple model of endogenous growth. J. Political Econ., 98: 103-125. Belaid H (2004). and economic development, simultaneous approach: Case of developing countries. ERMES, Research Team Report on Market, Employment and Simulation. Paris II University PentheonAssas. Retrieved from www.infraday.tu-berln.de/.../papers/Belaidand Economic Development.pdf March 3 2008 Cadot O, Roller L Stephan (2006). Contribution to productivity or pork barrel? The two faces of infrastructural investment. J. Public Econ., 90: 1133-1153. Canning D, Fay M (1993). The Effects of Infrastructure Networks on Economic Growth. New York: Columbia University, Department of Economics Canning D, Pedroni P (2004). Infrastructure and long run economic growth. Working Paper 99(9), Center for Analytical Economics, Cornell University. Central Bank of Nigeria (2007). Nigeria external debt and foreign reserve. CBN Economic and Financial Review, 45. Central Bank of Nigeria (2008). Economic and Financial Review, 45. Central Bank of Nigeria (2009). Statistical Bulletin (Golden Jubilee Edition). Central Bank of Nigeria (2010). Statistical Bulletin Retrieved from: www.cenbank.org/OUT/2011/PUBLICATIONS /STATISTICS/2010/PartB/PartB.html Fedderke JW, Bogetic Z (2006). Infrastructure and growth in South Africa: Direct and indirect productivity impacts of 19 infrastructure measures. World Bank Working Paper Retrieved from http://www-
wds.worldbank.org/servlet/.../Rendered/PDF/wps3989.pdf Foster V (2009). Overhauling the engine of growth: Infrastructure in Africa. Africa Infrastructure Country Diagnostic, The International Bank for Reconstruction and Development /The World Bank, Washington, Garcia-Mila T, McGuire T, Porter RH (1996). The effect of public sector capital in state level production functions reconsidered. Review of Economics and Statistics 78(1): 177-180. Herrera R (2001). The benefits of privatization: Evidence from Mexico. NBER Working Paper Series. Cambridge. Hotlz-Eakin D (1994). Public sector capital and the productivity puzzle. Review of Economics and Statistics, 76 (1): 12-21. Holtz-Eakin D, Schwartz AE (1995). Infrastructure in a structural model of economic growth. Regional Science and Urban Economics, 25: 131-151. Ijaiya GT, Akanbi SB (2009). An empirical analysis of long run effect of infrastructure on industrialisation in Nigeria. J.Int. Econ. Rev., 2: 135149. Jagun A, Heeks R, Whalley J (2008). The impact of mobile telephony on developing country micro-enterprise: A Nigerian case study. The MIT Press, 4(4): 47-65. Jarque CM, Bera AK (1980.Efficient tests for normality, homoscedasticity and serial independence of regression residuals, Economics Letters, 6: 255-259. KPMG (2007). Trends in Global Real Estate. Retrieved from http://www.kpmg.com/Global/ IssuesAndInsights/ ArticlesAndPublications/Pages/Trends-globalrealestate.aspx Murty KN, Soumya A (2005). Macroeconomic effects of changes in selected monetary and fiscal variables: A simulation analysis for India. Studies in Macroeconomics and Welfare, In B.B. Bhattacharya and Arup Mitra (eds.), New Delhi: Academic Foundation. Murty KN, Soumya A (2006). Macro economic effects of public investment in infrastructure in India: A simulation analysis. Indira Gandhi Institute of Development Research, Working Paper series, Mumbai. National Bureau of Statistics (1986). http//www.nigerianstat.gov.ng/index.php//sectorStatistics. National Bureau of Statistics (2007). Sector Statistics of Price and Price Index Available at: http://www.nigerianstat.gov.ng/index.php//sectorStatistics/ facts and figures about Nigeria 2008/ 33-35 National Bureau of Statistics (2010). Sector Statistics Retrieved from: http://www.nigerianstat.gov.ng/ Pyramid Research (2010). The Impact of mobile services in Nigeria: How mobile technologies are transforming economic and social activities. Retrieved from http//www.pyramidresearch.c1m Roller LH, Waverman L (2001). Infrastructure and economic development: A simultaneous approach. American Economic Review, 91(4): 909-923. Sanchez-Robles B (1998). Infrastructural investment and growth: Some empirical evidence. Contemporary Economic Policy, 16: 98-108. Sanusi LS (2012). The role of development finance institutions in infrastructure development: What Nigeria can learn from the India infrastructure finance company. Presented at the Public Private Partnership (PPP) stakeholders’ forum Lagos. Retrieved from blueprintng.com/cbn-blames-slow-economic-growth-on-poor infrastructure Snieska V, Simkunaite I (2009). Socio-economic impact of infrastructure investment. Economics of Engineering Decisions 3, ISSN 1392 – 2785 The World Bank (2011). World Development Indicators. Washington DC, 11. The World Bank (2004). Adjustment in Africa. Reforms, Result and the Road Ahead. Oxford: Oxford University Press. Udjo EO, Simelane S, Booysen D (2000). Socio-economic indicators of development progress within the OECD framework in South Africa. Paper presented at the Millennium Conference of Commonwealth Statisticians, Botswana,1–5 May 2000 www.statssa.gov.za United States Energy Information Administration Independent Statistics and Analysis (2010) International Petroleum Monthly (IPM), February. Retrieved June 20, 2010 at http//www.eia.doe.gov /emeu/ipsr/source4.html
Babatunde et al.
APPENDIX 1 YMFG YAGRIC YOIL YSERV YIF YNIF Y CF CNF INVIF INVOIF INVMFG INVAGRIC INVOIL INVSERV INVIF INVNIF INV C PDD NX AGD FDF X M EXR GRV GE CREDIT EDS DDS FD FDI NFA TOT TAR GCRIF FDIIF KIF PIF GCROIF FDIOIF POIF KOIF FDIMFG Notation KMFG PMFG GCRAGRIC Notation FDIAGRIC KAGRIC RAIN PAGRIC GCROIL FDI OIL KOIL POIL OPEC
Output of manufacturing Output of Agriculture Output of Oil Output of Service Output of infrastructure Output of non infrastructure Overall Output Food Consumption Non –food Consumption Investment in infrastructure Investment in other infrastructure Investment in manufacturing Investment in Agriculture Investment in Oil Investment in Service Investment in infrastructure Investment in non-infrastructure Total Investment Total Consumption Private Deduction Net Export Aggregate Demand Fiscal deficit financed by the CBN Export Import Exchange rate Government Revenue Total Government Expenditure Credit to the government External Debt Service Domestic Debt Service Fiscal Deficit Foreign Direct Investment Net foreign Assets Terms of Trade Implicit Tariff Government Capital Exponential ratio in infrastructure Foreign Direct Investment in infrastructure Capital Stock in infrastructure Average price of infrastructure Government capital expenditure in other infrastructure Foreign Direct Investment in other infrastructure Price of other infrastructure Capital Stock in infrastructure Foreign Direct Investment in manufacturing Definition Capital Stock in manufacturing Price of manufacturing Government Capital Expenditure ratio in agriculture Definition Foreign Direct Investment in agriculture Capital Stock in Agriculture Annual Rainfall Price of Agriculture Government capital expenditure ratio in oil Foreign Direct Investment in oil Capital Stock in oil Price of oil OPEC output
Endogenous Endogenous Endogenous Endogenous Endogenous Endogenous Endogenous Endogenous Endogenous Endogenous Endogenous Endogenous Endogenous Endogenous Endogenous Endogenous Endogenous Endogenous Endogenous Endogenous Endogenous Endogenous Endogenous Endogenous Endogenous Endogenous Exogenous Exogenous Exogenous Exogenous Exogenous Exogenous Exogenous Exogenous Exogenous Exogenous Exogenous Exogenous Exogenous Exogenous Exogenous Exogenous Exogenous Exogenous Exogenous Type Exogenous Exogenous Exogenous Type Exogenous Exogenous Exogenous Exogenous Exogenous Exogenous Exogenous Exogenous Exogenous
N/million N/million N/million N/million N/million N/million N/million N/million N/million N/million N/million N/million N/million N/million N/million N/million N/million N/million N/million N/million N/million N/million N/million N/million N/million Index N/million N/million N/million N/million N/million N/million N/million N/million Index Rate Ratio N/million N/million N/million Ratio N/million N/million N/million N/million Unit N/million N/million Ratio Unit N/million N/million Millimetre index Ratio N/million N/million N/million M/Barrels
38
Appendix I contd. 39 Res. J. Bus. Manage. Acc.
FDISERV KSERV PSERV PF YD IR PNF W FDIMFG GCRMFG PMFG FDIAGRIC CREDIT PAGRIC FDIOIL GCRSERV
Foreign Direct Investment in service Capital stock in service Average price of services Food price Disposable income Interest rate Price of non- food items Wealth Foreign Direct Investment in manufacturing Government capital expenditure ratio in manufacturing Price of manufacturing Foreign Direct Investment in agriculture Credit to the Government Price of agriculture Foreign Direct Investment in oil Government capital expenditure ratio in agriculture
Exogenous Exogenous Exogenous Exogenous Exogenous Exogenous Exogenous Exogenous Exogenous Exogenous Exogenous Exogenous Exogenous Exogenous Exogenous Exogenous
N/million N/million N/million N/million N/million rate N/million N/million N/million Ratio N/million N/million N/million N/million N/million Ratio