International Journal of Advances in Engineering & Technology, Nov. 2012. ©IJAET ISSN: 2231-1963
INFLUENCE OF SOIL-INDUSTRIAL EFFLUENTS INTERACTION ON SUBGRADE STRENGTH OF AN EXPANSIVE SOIL-A COMPARATIVE STUDY A. V. Narasimha Rao1, M. Chittaranjan2 1
2
Professor, Department of Civil Engineering, S.V.University, Tirupati, India Senior Lecturer, Bapatla Engineering College, Bapatla, Guntur District, India
ABSTRACT The rapid growth in population and industrialization cause generation of large quantities of effluents. The bulk effluents generated from industrial activities are discharged either treated or untreated over the soil leading to changes in soil properties causing improvement or degradation of engineering behaviour of soil. If there is an improvement in engineering behaviour of soil, there is a value addition to the industrial wastes serving the three benefits of safe disposal of effluent, using as a stabilizer and return of income on it. If there is degradation of engineering behaviour of soil then solution for decontamination is to be obtained. Hence an attempt is made in this investigation to study the effect of certain Industrial effluents such as Textile effluent, Tannery effluent and Battery effluent on the California Bearing Ratio Value of an expansive soil.
KEYWORDS: Expansive Soil-Textile Effluent-Tannery Effluent-Battery Effluent-C.B.R Values
I.
INTRODUCTION
The Index and Engineering properties of the ground gets modified in the vicinity of the industrial plants mainly as a result of contamination by the industrial wastes disposed. The major sources of surface and subsurface contamination are the disposal of industrial wastes and accidental spillage of chemicals during the course of industrial operations. The leakage of industrial effluent into subsoil directly affects the use and stability of the supported structure. Results of some studies indicate that the detrimental effect of seepage of acids and bases into sub soil can cause severe foundation failures. Extensive cracking damage to the floors, pavement and foundations of light industrial buildings in a fertilizer plant in Kerala state was reported by Sridharan (1981).Severe damage occurred to interconnecting pipe of a phosphoric acid storage tank in particular and also to the adjacent buildings due to differential movements between pump and acid tank foundations of fertilizer plant in Calgary, Canada was reported by Joshi (1994). A similar case of accidental spillage of highly concentrated caustic soda solution as a result of spillage from cracked drains in an industrial establishment in Tema, Ghana caused considerable structural damage to a light industrial buildings in the factory, in addition to localized subsidence of the affected area has been reported by Kumapley (1985). Therefore, it is a better to start ground monitoring from the beginning of a project instead of waiting for complete failure of the ground to support human activities and then start remedial actions.
326
Vol. 5, Issue 1, pp. 326-335
International Journal of Advances in Engineering & Technology, Nov. 2012. ©IJAET ISSN: 2231-1963 In many situations, soils in natural state do not present adequate geotechnical properties to be used as road service layers, foundation layers and as a construction material. In order to adjust their geotechnical parameters to meet the requirements of technical specifications of construction industry, studying soil stabilization is more emphasized. Hence an attempt has been made by researchers to use industrial wastes as soil stabilizers so that there is a value addition to the industrial wastes and at the same time environmental pollution can also minimised. Shirsavkar (2010) have been made experimental investigations to study the suitability of molasses to improve geotechnical properties of soil. He observed that the value of CBR is found to increase by the addition of molasses. Kamon Masashi (2001) reported that the durability of pavement is improved when stabilized with ferrum lime-aluminium sludge. Ekrem Kalkan (2006) investigated and concluded that cement–red mud waste can be successfully used for the stabilization of clay liners in geotechnical applications. The thickness of Pavement and subgrade strength depends on C.B.R value of soil. Hence an attempt is made in this investigation to study the effect of certain industrial effluents such as Textile effluent, Tannery effluent and Battery effluent on the California Bearing Ratio Value of an expansive soil. Experimental investigations, Results and discussion, Mechanism involved in modification of C.B.R values, summary and conclusions, scope for future work are critically discussed in the following sections.
II.
EXPERIMENTAL INVESTIGATIONS
2.1. Materials used 2.1.1. Soil Expansive soils due to its swelling nature it causes lot of damages to Civil Engineering structures which are constructed over them. These type of soils are very sensitive to changes in environment such as change in applied stress, Pore fluid chemistry and its surrounding environmental conditions. Hence expansive soil is considered for investigation. The soil used for this investigation is obtained from CRS near Renigunta, Tirupati. The dried and pulverized material passing through I.S.4.75 mm sieve is taken for the study. The properties of the soil are given in Table.1. The soil is classified as “SC” as per I.S. Classification (IS 1498:1970) indicating that it is clayey sand. It is highly expansive in nature as the Differential Free Swell Index (DFSI) is about 255%. Sl.No. 1.
2.
3. 4. 5. 6. 7.
8.
9.
Table:1 Properties of Untreated soil Property Grain size distribution (a)Gravel (%) (b)Sand (%) (c)Silt +Clay (%) Atterberg Limits (a)Liquid Limit (%) (b)Plastic Limit (%) (c)Plasticity Index (%) Differential Free Swell Index (%) Swelling Pressure (kN/m2) Specific Gravity pH Value Compaction characteristics (a) Maximum Dry Unit Weight (kN/m3) (b) Optimum Moisture Content(%) California Bearing Ratio Value (%) at (a)2.5mm Penetration (b) 5.0mm Penetration Unconfined compressive Strength(kN/m2)
327
Value 3 65 32 77 29 48 255 210 2.71 9.20 18.3 12.4 9.98 9.39 173.2
Vol. 5, Issue 1, pp. 326-335 2
Strength(kN/m )
International Journal of Advances in Engineering & Technology, Nov. 2012. ©IJAET ISSN: 2231-1963 2.1.2. Industrial Effluents 2.1.2.1 Textile effluent Textile effluent is a coloured liquid and soluble in water. The chemical properties of the effluent are shown in Table 2. 2.1.2.2 Tannery effluent Tannery industry effluent is dark coloured Liquid and soluble in water. The chemical composition of Tannery effluent is given in Table.3 2.1.2.3. Battery effluent Battery effluent is a colourless liquid and soluble in water. The chemical properties of the effluent are shown in Table .4 Table.2: Chemical Composition of Textile effluent Sl.No 1. 2. 3. 4. 5. 6. 7. 8.
Parameter Colour PH Chlorides Alkalinity Suspended solids Total solids BOD COD
Table. 3: Chemical Composition of Tannery effluent Value Yellow 9.83 380mg/l 2400mg/l 1500gm 13.50 150mg/l 6200mg/l
S.No. 1. 2. 3. 4. 5. 6. 7. 8. 9.
PARAMETER Color pH Chromium Chlorides Sulphates Total Hardness BOD COD Suspended Solids
VALUE Black 3.15 250 mg/l 200 mg/l 52.8 mg/l 520 mg/l 120 mg/l 450 mg/l 1200 mg/lit
Table.4: Chemical Composition of Battery Effluent S.No. 1. 2. 3. 4. 5. 6. 7. 8. 9.
III.
PARAMETER Color pH Sulphates Chlorides Lead Sulfate Free Lead Total Lead BOD COD
VALUE White 8.45 250 mg/l 30 mg/l 63.08% 7.44% 75.42% 110 mg/l 320 mg/l
PROCEDURE FOR MIXING
The soil from the site is dried and hand sorted to remove the pebbles and vegetative matter if any. It is further dried and pulverized and sieved through a sieve of 4.75mm to eliminate gravel fraction if any. The dried and sieved soil is stored in air tight containers and ready to use for mixing with effluents. The soil sample so prepared is then mixed with solutions of different concentrations of Textile, Tannery and Battery effluent. The percentage varied from 20 to 100% in increment of 20%.The soil effluent mixtures are mixed thoroughly before testing.
IV.
TESTS CONDUCTED ON TREATED SOIL
4.1. Standard Proctor Test The compaction parameters i.e. optimum moisture content and Maximum dry unit weight play a vital role in changing the strength characteristics of an expansive soil. In practice C.B.R. test is also conducted at Optimum Pore fluid Content and corresponding Maximum Dry Unit Weight. But these two parameters are strongly influenced by pore fluid chemistry. Hence in this investigation Standard Proctor’s compaction tests are carried out on expansive soil treated with Textile effluent, Tannery effluent, Battery effluent at various percentages of 0%, 20%, 40%, 60%, 80% and 100% by dry weight of the soil.
328
Vol. 5, Issue 1, pp. 326-335
International Journal of Advances in Engineering & Technology, Nov. 2012. ©IJAET ISSN: 2231-1963 4.2. California Bearing Ratio Tests The strength of the subgrade is an important factor in the determination of the thickness required for a flexible pavement. It is expressed in terms of its “California Bearing Ratio”, usually abbreviated as CBR. The results obtained by these tests are used in conjunction with empirical curves, based on experience for the design of flexible pavements. The California Bearing Ratio value is determined corresponding to both 2.5 mm and 5.0 mm penetrations, and the greater value is used for the design of flexible pavement. In this investigation California Bearing Ratio tests on Expansive soil treated with Textile effluent, Tannery effluent and Battery effluent varying from 0% to 100% in increment of 20% is carried out. The tests are conducted on remolded soil specimens at their respective Optimum Pore fluid Content and Maximum Dry Unit Weights and compacted according to I.S. Light compaction.
V.
RESULTS AND DISCUSSIONS
5.1. Standard Proctor’s test Standard Proctor’s compaction tests are carried out on expansive soil treated with Textile effluent, Tannery effluent, Battery effluent at various percentages of 0%, 20%, 40%, 60%, 80% and 100% by dry weight of the soil and the results i.e. Optimum Pore fluid Content and Maximum Dry unit Weight are obtained. The variation of the Optimum Pore fluid Content at different percentages of Textile, Tannery and battery effluents are shown in Table.5.The variation of the Maximum dry Unit Weight at different percentages of Textile, Tannery and Battery effluents are shown in Table.6 Table: 5: Optimum Pore fluid (OPC) Content at different Percentages of effluents Effluent (%): Water (%) O.P.C Textile
Tannery
Battery
0:100
12.4
12.4
12.4
20:80
12.6
12.1
13.5
40:60
12.9
11.9
13.6
60:40
13.4
11.6
13.7
80:20
14.4
11.3
13.9
100:0
15.4
11.1
14.1
Table.6. Maximum Dry Unit Weight (M.D.U) at different Percentages of effluents Effluent (%): Water (%) M.D.U (kN/m3) Textile
Tannery
Battery
0:100
18.30
18.3
18.30
20:80
18.27
18.6
17.71
40:60
18.22
18.8
17.51
60:40
18.14
19.1
17.41
80:20
18.09
19.5
17.37
100:0
18.03
19.8
17.2
From the Table.5 it is observed that the optimum pore fluid content increases with increase in percentage of Textile effluent and Battery effluent whereas it decreases with increase in percentage of Tannery effluent. From the Table.6 it is observed that there is reduction in maximum dry density with percentage increase in Textile effluent and Battery effluent whereas it increases with increase in percentage of Tannery effluent.
5.2. California Bearing Ratio Test The load – penetration curves of treated and untreated soil obtained from California Bearing Ratio tests at different percentages of Textile effluent are presented in Fig.1.
329
Vol. 5, Issue 1, pp. 326-335
International Journal of Advances in Engineering & Technology, Nov. 2012. ©IJAET ISSN: 2231-1963
Fig.1: Load – Penetration curves of treated soil at different percentages of Textile Effluent
The load – penetration curves of treated and untreated soil obtained from California Bearing Ratio tests at different percentages of Tannery effluent are presented in Fig.2.The Top most curve corresponds to 100% of effluent followed by 80%, 60%, 40%, 20% and 0% respectively.
Fig.2: Load – Penetration curves of treated soil at different percentages of Tannery Effluent
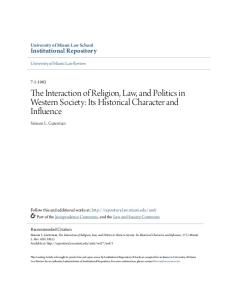
The load – penetration curves of treated and untreated soil obtained from California Bearing Ratio tests at different percentages of Battery effluent are presented in Fig.3.
330
Vol. 5, Issue 1, pp. 326-335
International Journal of Advances in Engineering & Technology, Nov. 2012. ©IJAET ISSN: 2231-1963
Fig.3: Load – Penetration curves of treated soil at different percentages of Battery Effluent
5.2.1. CBR Values for 2.5mm penetration The variation of the CBR values with different percentages of Textile, Tannery and Battery effluents are shown in Table.7.The percent increase/decrease in CBR values at different effluent percentages are also shown in Table.8.From the Table.8 it is observed that the maximum percent increase in CBR value at 2.5mm penetration for 100% Textile effluent is about 45% and for 100%Tannery effluent is about 50%.It is found that the maximum percent decrease in CBR value for 100% Battery effluent is about 21%. Table.7: C.B.R.Values at 2.5mm penetration at different percentages of effluents Effluent %): Water (%) C.B.R.Values (%) Textile
Tannery
Battery
0:100 (%) 20:80
9.98
9.98
9.98
10.59
10.38
9.76
40:60
10.93
11.28
9.31
60:40
14.02
12.18
8.84
80:20
14.12
13.58
8.37
100:0
14.43
14.98
7.9
Table.8: Percent increase/decrease in CBR values at 2.5mm penetration at different Percentages of effluents Effluent %): Water (%)
331
C.B.R.Values (%) Textile
Tannery
Battery
0:100
-
-
-
20:80
6.11
4.00
-3.57
40:60
9.52
13.02
-11.54
60:40
40.48
22.04
-16.90
80:20
41.48
36.07
-18.91
100:0
44.58
50.10
-20.83
Vol. 5, Issue 1, pp. 326-335
International Journal of Advances in Engineering & Technology, Nov. 2012. ©IJAET ISSN: 2231-1963 The Variation of CBR values at 2.5mm penetration and different percentages of the three effluents are shown in Fig.4. From the figure it is observed that the CBR value increases with per cent increase of Textile and Tannery effluent where as it decreases in the case of Battery effluent. The maximum percentage increase or decrease occurs at 100% effluent in all the three cases.
Fig.4: Variation of CBR values at 2.5mm penetration at different percentages of Effluents
5.2.2. CBR Values at 5.0mm penetration The variation of the CBR values with different percentages of Textile effluent, Tannery effluent and Battery effluent are shown in Table.9.The percent increase/decrease in CBR values at different effluent percentages are also shown in Table.10.From the Table.10 it is observed that the maximum percent increase of CBR value at 5.0mm penetration for 100% Textile effluent is about 39.82% and for 100% Tannery effluent is about 45.47%.It is found that the maximum percent decrease in CBR value for 100% Battery effluent is about 16.50%. Table.9: CBR Values at 5.0 mm penetration at different percentages of effluents Effluent %): Water (%) C.B.R. Values (%) Textile
Tannery
Battery
9.39
9.39
9.39
20:80
10.24
9.69
9.08
40:60
10.43
10.61
8.46
60:40
10.94
11.22
8.09
80:20
12.77
11.83
7.96
100:0
13.13
13.66
7.84
ater(%) 0:100
Table.10: Percent increase/decrease in C.B.R values at 5.0mm penetration at different percentages of effluents Effluent (%): Water (%) (%) C.B.R.Values (%) (%) Textile Tannery Battery 0:100 ater(%) 20:80 9.05 3.20 3.30 40:60 11.07 12.9 10.47 60:40 16.50 19.48 13.88 80:20 35.99 25.98 15.22 100:0 39.82 45.47 16.50
332
Vol. 5, Issue 1, pp. 326-335
International Journal of Advances in Engineering & Technology, Nov. 2012. ©IJAET ISSN: 2231-1963 The variation of CBR value at 5.0mm penetration and different percentages of the three effluents are shown in Fig.5. From the figure it is observed that the CBR value increases with per cent increase of Textile and Tannery effluent where as it decreases in the case of Battery effluent. The Maximum per cent increase or decrease in C.B.R. Value occurs at 100% effluent in all the three cases.
Fig.5: Variation of CBR values at 5.0mm penetration at different percentages of Effluents
VI.
MECHANISM INVOLVED TREATED SOIL
IN
MODIFICATION
OF
C.B.R VALUES
OF
In the case of Expansive soils the Engineering behavior of the soil is governed by thickness of diffused double layer. The thickness of double layer in turn affected by pore fluid chemistry such as Dielectric Constant, Electrolyte Concentration, Ion valence, hydrated ion radius etc., when soil interacts with industrial effluents, the interaction changes the pore fluid chemistry and subsequently the thickness of diffused double layer. These changes are likely to be reflected by variation in engineering properties. 6.1. Textile effluent When soil is mixed with Textile effluent the dry density decreases and Optimum pore fluid content increases. This could be attributed to ion exchange at the surface of clay particle. The chlorides in the additives reacted with the lower valence metallic ions in the clay microstructure and causes decrease in double layer thickness. The decrease in double layer thickness causes increase in attractive forces and decrease in repulsive forces leading to flocculated structure. Hence Dry density decreases. Due to retaining of water within the voids of flocculated structure water holding capacity of soil increases hence optimum moisture content increases. The CBR values of soil treated with Textile effluent increases at 2.5mm penetration and 5.0mm penetration. This is due to Textile effluent is capable of forming covalent linkages with cellulose, amino, thiol and hydroxyl groups (Srimurali, 2001).Also Textile effluent do contain Cl- or O-So3 as leaving group enabling the dyes to form covalent bonds with fibre (Srimurali 2001).The Clay minerals do contain hydroxyls groups at the surface and possibly a bonding takes place between hydroxyls in the clay minerals and dyes or O-So3Na of dyes. This Chemical bonding may be responsible for increase in CBR Values of soil treated with Textile effluent. 6.2. Tannery Effluent The CBR values of soil treated with Tannery effluent increases at 2.5mm penetration and 5.0mm penetration. When soil is mixed with Tannery effluent the dry density increases due to adsorption of Chromium CrO4 ions on to the clay particles present in the Tannery effluent. Due to its higher valence adsorption of divalent or trivalent chromium decreases the double layer thickness. The
333
Vol. 5, Issue 1, pp. 326-335
International Journal of Advances in Engineering & Technology, Nov. 2012. ©IJAET ISSN: 2231-1963 reduction of the double layer thickness brings the particles closer and increases the mechanical contact between the particles. Increase in dry density and mechanical contacts between the particles increase the inter particle friction that in turn led to high resistance to penetration of the plunger. Hence high CBR values of soil observed for soil treated with Tannery effluent. 6.3. Battery Effluent The CBR values of soil treated with Battery effluent decreases at 2.5mm penetration and 5.0mm penetration. This is attributed to adsorption of sulphates on to the clay particles present in the Battery effluent. Adsorption of divalent negative sulphate ions causes entire clay particles to be negatively charged. If the entire clay particle becomes negatively charged it increases the activity of clay mineral and holds more quantity of water as double layer water and promotes expansion of double layer. Expansion of diffused double layer increases the distance between individual soil grains which may cause decrease in Electro static and Electromagnetic attractive forces which hold the soil particles together. Hence decrease in Maximum Dry Unit Weight and weak chemical bonding that developed between clay minerals with the reactive chemicals present in Battery effluent led to low resistance to penetration of plunger. Hence low CBR values of soil observed for soil treated with Battery effluent.
VII.
SUMMARY AND CONCLUSIONS
Industrial activity is necessary for socio-economic progress of a country but at the same time it generates large amounts of solid and liquid wastes. Disposal of solid or liquid effluents, waste byproducts over the land and or accidental spillage of chemicals during the course of industrial process and operations causes alterations of the physical and mechanical properties of the ground in the vicinity of industrial plants. If soil waste interaction causes improvement in soil properties then the industrial wastes can be used as soil stabilizers. On other hand if it causes degradation of soil properties then the solution for decontamination of soil is to be obtained. In this investigation, an attempt has been made to study the effect of certain industrial effluents such as Textile, Tannery and Battery effluents on CBR values of an expansive soil. From the results presented in this investigation, the following conclusions are drawn. Expansive clay considered in this investigation is sensitive when it is treated with industrial effluents. When soil mixed with Textile and Tannery effluents separately an increase in CBR values is observed. But when it is mixed with Battery effluent CBR values are decreased. The Maximum improvement in CBR values corresponding to 2.5mm penetration and 5.0 mm penetration are about 45% and 40% respectively when the soil is treated with Textile effluent. The maximum improvement in CBR values occur when the soil is treated with 100% Textile effluent. The Maximum improvement in CBR values corresponding to 2.5mm penetration and 5.0mm penetration are about 50% and 45% respectively when the soil is treated with Tannery effluent. The maximum improvement in CBR values occur when the soil is treated with 100% Tannery effluent. The Maximum reduction in CBR values corresponding to 2.5mm penetration and 5.0mm penetration are about 21% and 17% respectively when the soil is treated with Battery effluent. The maximum reduction in CBR values occurs when the soil is treated with 100% Battery effluent. Textile and Tannery effluents raise the hope of value addition to the industrial wastes where as Battery effluent can be treated as contaminant.
VIII.
SCOPE FOR FUTURE WORK
In the present investigation the effect of Textile, Tannery and Battery effluents CBR values have been studied. Studies can also be made to know the influence of these effluents on Plasticity, Swelling, Compaction and Strength Characteristics, pH and Drainage and Consolidation characteristics so that a comprehensive knowledge of the behaviour of expansive soil treated with Textile, Tannery and Battery effluents can be obtained.The work can be extended to other contaminants / pollutants / effluents / industrial wastes namely work shop waste, sugar mill waste, Pharmaceutical plants waste, Dairy waste, Paper and Pulp mill waste, Fertilizer plant waste, Steel mill waste, Oil refineries waste, Petro chemical complex waste, Soap Industry waste etc.,
334
Vol. 5, Issue 1, pp. 326-335
International Journal of Advances in Engineering & Technology, Nov. 2012. ©IJAET ISSN: 2231-1963
REFERENCES [1]. Ekrem Kalkan “Utilization of red mud as a Stabilization material for the preparation of clay liners” Engineering, Geology, 87, (3- 4), 220-229. (2006) [2]. I.S. 1498-1970 (First Revision), Classification of soils for General Engineering Purposes. [3]. Joshi, R.C., Pan., and Lohita, P. “Volume Change in Calcareous Soils due to Phosphoric acid, Contamination”, Proc. Of the XIII ICSMFE, New Delhi, Vol.4, 1569- 1574. (1994) [4]. Kumapley, N.K., and Ishola, A., “The Effect of Chemical Contamination on Soil Strength” Proc. of the XI ICSMFE, Sanfrancisco, Vol.3, 1199-1201.(1985) [5]. Kamon Masashi GU Huanda, Masahiro “Improvement of mechanical properties of ferrum lime stabilized soil with the addition of aluminium Sludge” Materials science research international ISSN13411683, vol.7, 47-53(2001) [6].Sridharan, A, Nagraj, T.S., and Sivapullaiah, P.V. “Heaving of soil Due to Acid Contamination” Proc. of the X ICSMFE, Stockholm, Vol.2, 383-386. (1981) [7]. S.S.Shirsavkar, Prof.S.S.Koranne “Innovation in Road Construction Using Natural Polymer”, EIJJE, Journal, Vol.15, Bund.O, 1614-1624. (2010) [8]. Srimurali,M (2001)”Removal of Colour from Dye Wastes By Chemical coagulation” Ph.D. Thesis Submitted to Dept.of.Civil.Engg. S.V.University, India
AUTHORS BIOGRAPHIES A. V. Narasimha Rao presently Professor of Civil Engineering,S.V.U.College of Engineering,Tirupati having 33 years of Teaching, Research, and Consultancy experience. He obtained his Master of Engineering Degree and Ph.D from IIT Chennai. He held various administrative posts in S.V.University like Head of Civil Engineering Department; Vice Principal etc.He published more than 100 research papers. He has published two books. He received Eminent Engineer Award conferred by the Institution of Engineers (India), Engineer of the year award- 2007 conferred jointly by the Government of A.P. and the Institution of Engineers (India), and State Teacher award-2012. His interests are Geosynthetics, Ground improvement techniques, Environmental geotechniques, Marine Geotechnology.
M. Chittaranjan is research Scholar working for Ph.D Degree in Civil Engineering. His area of research is Environmental geotechniques.Presently he is working as a Senior Lecturer in the Department of Civil Engineering of Bapatla Engineering College, Bapatla, India. He had 08 years of experience in the field of academics. He obtained his Master of Technology Degree from S.V.University, Tirupati, India. He had successfully published national research papers and international research papers.
335
Vol. 5, Issue 1, pp. 326-335