TELKOMNIKA, Vol.11, No.1, March 2013, pp. 215~222 ISSN: 1693-6930 accredited by DGHE (DIKTI), Decree No: 51/Dikti/Kep/2010
215
Inferring Gene Regulatory Network from Bayesian Network Model Based on Re-Sampling Qian Zhang, Xuedong Zheng, Qiang Zhang, Changjun Zhou Key Laboratory of Advanced Design and Intelligent Computing, (Dalian university) Ministry of Education, Dalian, 116622, China
[email protected]
Abstrak Saat ini, teknologi chip gen dengan cepat telah menghasilkan banyak informasi tentang kegiatan ekspresi gen. Pada ekspresi data time-series terdapat fenomena bahwa jumlah gen yang sebenarnya dalam ribuan tetapi jumlah data pada eksperimen biasanya hanya beberapa saja. Untuk kasus seperti ini, sulit untuk belajar struktur jaringan dari data tersebut dan tentu hasilnya tidak ideal. Jadi diperlukan cara untuk memperbesar kapasitas sampel. Dalam tulisan ini, metode block bootstrap re-sampling digunakan untuk memperbesar data dari ekspresi data yang kecil. Pada saat yang sama, diterapkan algoritma "K2+T" untuk memperbanyak data ekspresi siklus gen. Berdasarkan hasil eksperimen dan dibandingkan dengan algoritma pembelajaran struktur semi-fixed EM, metode yang diusulkan berhasil dalam membangun jaringan gen yang menangkap hubungan yang dikenal maupun tak dikenal dan ini merupakan sesuatu yang baru. Kata kunci: bootstrap blok re-sampling, jaringan pengaturan gen, model BN, pembelajaran struktur
Abstract Nowadays, gene chip technology has rapidly produced a wealth of information about gene expression activities. But the time-series expression data present a phenomenon that the number of genes is in thousands and the number of experimental data is only a few dozen. For such cases, it is difficult to learn network structure from such data. And the result is not ideal. So it needs to take measures to expand the capacity of the sample. In this paper, the Block bootstrap re-sampling method is utilized to enlarge the small expression data. At the same time, we apply “K2+T” algorithm to Yeast cell cycle gene expression data. Seeing from the experimental results and comparing with the semi-fixed structure EM learning algorithm, our proposed method is successful in constructing gene networks that capture much more known relationships as well as several unknown relationships which are likely to be novel. Keywords: BN model, block bootstrap re-sampling, structure learning, gene regulatory network
1. Introduction Reconstructing gene regulatory networks [1], [2] has the important biological significance. Rapid development of sequencing and computer technology has lead to the complete sequencing and annotation of many important model organisms. In order to understand the functioning of an organism, the major step is to identify which genes are expressed, under what conditions and to what extent. But gene expression is a complex process regulated at several stages in the synthesis of proteins, the identification of genes whose products function together in the cell is a major task of post genomic approaches. Genes encode transcription factors, signaling proteins and proteins involve in the phosphorylation of other proteins can all have an effects on gene expression, and hence on the expression levels of other genes. A gene regulatory network is the graphical abstract representation of these interactions. Recent advances in high-throughput DNA microarrays [3],[4] and chromatin immunoprecipitation assays have enabled the learning of the structure and functionality of gene regulatory networks. The main methods of constructing gene regulatory networks include: temporal Boolean network model [5], the mutual information [6] associated with the model, the linear combination model and the weighted matrix model, neural network model, differential equations and Bayesian network model, all of these methods are at different levels of real regulation of network abstraction. Among them, the timing Boolean network model and the Received November 26, 2012; Revised January 3, 2013; Accepted February 8, 2013
216
ISSN: 1693-6930
mutual information associated with the model are coarser, rarely used alone. The linear combination model, the weighted matrix model, the neural network model and differential equations model of processing power to noise is relatively weak. Bayesian network model [7] is a compromise of these methods. Now, Bayesian network model is employed in building the gene regulation network has become bioinformatics research hot spot. Due to the fact that gene expression data is imperfect, how to effectively use a small amount of experimental data to build gene regulatory networks of more biological significance have become the main difficulty in the research of current bioinformatics. This paper makes use of the Block bootstrap re-sampling methods to block the time series data and to re-sampling. The dependence of the original data set time points before and after won't be destroyed and also the overall characteristics of the original data set are retained. It not only achieves the purpose of expansion the sample but also makes up for the defects of the gene expression data less. After small sample data expanded, we combine the maximum weight spanning tree algorithm (MWST) with the K2 algorithm. Concrete operations are that use MWST to identify the optimal node order which serve as the initial nodes of K2 algorithm. After re-sampling the learning efficiency and accuracy of the “K2+T” algorithm is significantly better than before.
2. BN Model Bayesian network learning is to find the truest reflection of the existing data set dependency between data variables of a Bayesian network model. It is usually defined as B (G , ), where G is a directed acyclic graph; is the network parameters which are related to each node conditional probability tables (the Conditional Probability Tables, CPT). Each node in the network represents the variables in the model, each side represents the conditions of the dependent relationship between variables, and conditional probability table indicates the degree of dependence between the variables. X ,..., X n , and then the joint probability Assume that the network has a total of n nodes 1 distribution of the entire network can be expressed as follows: n
P( X 1 ,..., X n ) P( X i | PaG ( X i )) i 1
(1a)
PaG ( X i ) denotes the node X i the collection of the parent node in the graph G, Here P( X i | PaG ( X i )) is the conditional probability of the node X i in the parent node set of PaG( Xi ) , and n is the number of nodes. Thus, the Bayesian network scoring function can be abbreviated as follows: n
S (G : D ) Score( X i , PaG ( X i ) : D ) i 1
(1b)
X where D is the current data set. According to (1.2), it only needs to calculate the node i of the PaG ( X i ) , and elect the best parent node of each scoring S (G: D) in the current parent node X node i to meet S (G: D) with the highest score which allows the network to the highest scoring [8]. There are a lot of structure learning algorithms based on the above principle, such as sparse candidate method, greedy hill climbing method, the K2 algorithm [9] and so on. 3. Block Bootstrap Re-Sampling Theory In 1992, Liu [10] proposed Block bootstrap method which might to have the dependence data set to carry on sampling. Since the timing of gene expression data is not uniformly stable, directly using the original Bootstrap method for sampling may destroy the timing data’s aggregation and autocorrelation, so we can use the Block bootstrap method [1112] to guarantee such characteristics.
TELKOMNIKA Vol. 11, No. 1, March 2013 : 215 – 222
TELKOMNIKA
ISSN: 1693-6930
217
X 1 ,..., X n is an observed sample from a real-valued time series ( X t )tZ . The real-valued T Tn ( X 1 ,..., X n ) are assumed to be invariant under permutations of the observations. statistics n On the Block bootstrap, b subsamples or blocks of length l are formed from the observations. We further assume without loss of generality that the data sample is truncated until n / l N holds. In the framework of block bootstrap, two kinds of building subsamples are predominating, the overlapping blocks and the non-overlapping blocks. The overlapping blocks are defined by
Yi ( X i ,..., X i 1 ) i 1,.., b n l 1
(2a)
And non-overlapping are defined as follows:
Yi ( X ( i 1) l 1 ,..., X il )
i 1,.., b
n l
(2b)
Y Block bootstrap is realized by re-sampling the blocks i and gluing them together to form a kind of surrogate time series of length n. Finally, the statistic is applied on each bootstrapped series to estimate quantities. Algorithmic representation of this procedure is as follows: {Y ,..., Yb } and form a 1) Select an integer block size l . It draws blocks with replacement from 1 bootstrap pseudo-series
Y1* ,..., Yb* by gluing the drawn blocks together.
X * ,..., X B* . 2) Repeat operation 1. B times are to generate B bootstrap samples 1 T * Tn ( X 1,* k ,..., X n*,k ), k 1,..., B . 3) Calculate n , k Take time series data for an example, the Block bootstrap method can be expressed as X follows. Assuming that the n-series data, the data of each time point with the vector i to represent, the best block length l , the n-series data order split into b blocks, then each one can B ( X 1 , X 2 ,..., X l ),..., Bb ( X b ,..., X n ) , where b = n- l +1. After completing be expressed as 1 block task, the data is put back to re-sampling, the sampling frequency for n/ l , and finally these re-sampling data blocks connect together to form a data set of size n. 4. “K2+T” Algorithm In 1992, Cooper and Herskovits [9] established the famous algorithm K2 based on the score function and the greedy search strategy. K2 algorithm is required to determine the order of the nodes in advance, Bayesian score and the greedy search strategy are applied to constant increase the network side which can improve the score function to find the highest score of the belief network structure. Chow and Liu [13] proposed the maximum weight spanning tree algorithm (maximum weight spanning tree, MWST). In the set of Bayesian network with n nodes, each node corresponds to a random variable in the random vector. The procedure of MWST + K2 algorithm is as follows: Step 1. From the data, it is estimated that the joint probability distribution between the X X variables i and j is
P( X i xi , X j x j )
count( X i xi , X j x j ) N
,
i j
(3a)
count ( X i xi , X j x j ) X xi , X j x j where indicates that the number of sample points for i is established at the same time in the data, N is the total number of sample points.
Inferring Gene Regulatory Network from Bayesian Network Model Based…(Qian Zhang)
218
ISSN: 1693-6930
X X Step 2. Calculating the mutual information based on the variables i and j serve as e( xi , x j ) , and these weights will be in order. The mutual information is the weight of the edge formally defined as I (Xi , X j )
P( X xi , x j
i
xi , X j x j ) log
P( X i xi , X j x j ) P ( X i xi ) P ( X j x j )
(3b)
Step 3. Calculate the maximum weight spanning tree: (i) The n variables node starts from empty tree; (ii) We need to find a maximum weight values edge and insert it into the empty tree; (iii) Find the next largest weight edge; before joining this side, we need to verify whether it generates cyclic phenomenon, if it produces cyclic phenomenon, we should give up this side and continue to look for the eligible edges. (iv) Repeat (c), until n-1 edges are included, namely building a spanning tree contains n nodes. Step 4. Select a root node, beginning from it gives each edge direction. Here, we use the MWST to initialize the root node, then the tree topology is to initialize the K2 algorithm, this method is also known as “K2 + T” [14] which apply this order to the root node. The main statements are described as follows: DAG1 = learn_struct_mwst(Data, ones(n,1), ns, node_type, ’mutual_info’, class); order = topological_sort(full(dag)); DAG = learn_struct_K2 (Data, ns, order);
5. Experiments and Results Analysis The simulation consists of two parts. In the first part, the experimental data are collected and processed. In the network construction trials, we use the BNT (Bayesian network toolbox, BNT) Structure Learning Package which is prepared by Leray [15]. The package is the expansion of Murphy who developed the BNT toolbox in static network structure learning. In the second part, real gene regulation network is listed that is used to judge the validity of our algorithm. 5.1. Data Collection and Processing We select the microarray gene expression data from S. Cerevisiae which contains 77 genes expression measurements data in order to verifying the re-sampling BN model [16]. The data contain six experimental data sets (cln3, clb2, alpha-factor, cdc15, cdc28 and elutriation). We choose the cdc28 experimental data set as a data source which contains 17 the timing characteristics of the test conditions. In order to test our algorithm performance on expression profiles we select 13 genes network from the Yeast cell cycle, most of them precisely lie in the G1 and S period. Selected genes are: CDC28, CLN3, MBP1, SWI4, SWI6, MCM1, FKH1, NDD1, SWI5, ACE2, CLB2, SIC1 and CLN2. It has been verified that there exist interactions between these genes, and the genes here are the most important transcription factors in Yeast cell cycle. First, the k-nearest neighbors (KNN) method is used to fill missing data in the gene expression data. Second, it aims to simplify the presentation and implementation, gene expression data levels are usually discretized to owe expression, normal expression and over expression of the three states following the discretization policy of [17]. Re-sampling of the discrete data and next step are to conduct the scalable experimental operation based on the BNT toolbox. Before re-sampling the data size is 13*17, after re-sampling the scale becomes 13*77. Before and after re-sampling, using MWST and “K2+T” construct gene regulatory networks as showed in Figure 1, Figure 2.
TELKOMNIKA Vol. 11, No. 1, March 2013 : 215 – 222
TELKOMNIKA
ISSN: 1693-6930 MWST DAG1
CLN3
K2+T DAG
CDC28
SWI5
CLN2
CDC28
SWI5
FKH1
ACE2
CLB2
CLN3
MCM1
SWI4
219
SWI4
SWI6
SIC1
MCM1
MBP1
FKH1
ACE2
CLB2
SWI6
CLN2
SIC1
NDD1
MBP1
NDD1
Figure 1. Before re-sampling, it respectively builds gene regulatory network by two algorithms MWST and “K2+T”
MWST
K2+T
DAG1
CLN3
CLN3 FKH1
FKH1
MCM1
CLN2
CLN2
ACE2
ACE2
NDD1
NDD1 CDC28
CLB2 SWI5
CDC28 MBP1
CLB2 SWI5 SIC1
SIC1 SWI4
MCM1
SWI6
SWI6
MBP1
DAG
SWI4
Figure 2. After re-sampling,it respectively builds gene regulatory network by two algorithms MWST and “K2+T”. Where black connecting lines represent the verified existing edges. Blue connecting lines represent the reversed direction with known relationships. Gray connecting lines represent the regulatory relationships predicted by our algorithm which is remained to be verified further
We can clearly be seen from the Figure 1 and Figure 2, because the data size is less, before re-sampling “K2+T” algorithm constructing the network structure is far from ideal, and
Inferring Gene Regulatory Network from Bayesian Network Model Based…(Qian Zhang)
220
ISSN: 1693-6930
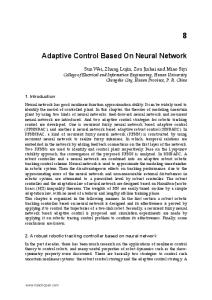
after re-sampling, the “K2+T” algorithm constructing the network is more complex and obtain more true positive edges. 5.2. Analysis of the Results The real-life gene network in our work is a Yeast transcriptional cell cycle subnetwork published in [18], which includes 13 genes and 21 edges. Most of the regulation relationships for the database are verified by Yeast Proteome Database (YPD) [19]. In order to infer the gene network controlling yeast cell cycle regulation, we choose genes whose mRNA levels respond to the induction of CLN3 and CLB2 that are two well-characterized cell cycle regulators [20]. Late in G1 phase, the CLN3-CDC28 protein kinase complex activates two transcription factors, MBF (MBP1 and SWI6) and SBF (SWI4 and SWI6), and these promote the transcription of some genes important for budding and DNA synthesis. CDC28 SWI 6, CDC28 MBP1 and NDD1 SWI 5 can be found in the genome encyclopedia (the KEGG) pathway. The real gene regulatory network architecture is shown in Figure 3.
Figure 3. Real structure of gene regulatory network
N The gene network with known structure is called target network t and the result of our N algorithm is called deduced network d . Sensitivity, specificity and F-factor are used to evaluate our algorithm. Sensitivity is used to test the inference ability. Specificity reflects the degree of accuracy and F-factor [21] is the balance of above two indicators. The bigger F-factor means the higher accuracy.
Sensitivity
Sc St
Specificity ,
Sc Sd
(4a)
Sc means the number of the same and correctly estimated edges in both N t and N d ; S t means the total number of the edges in N t ; S d means the total number of the edges in Nd . Here
TELKOMNIKA Vol. 11, No. 1, March 2013 : 215 – 222
TELKOMNIKA
F-factor
ISSN: 1693-6930
2( sensitivity specificity ) sensitivity specificity
221
(4b)
By the definition we can calculate the Sensitivity, Specificity and F-factor of our proposed method. After re-sampling, we utilize the MWST and “K2+T” algorithms to construct the gene regulatory network structure. An approach based on SSEM [22] is implemented for the comparison purpose.
Table 1. The comparison of MWST, SSEM and K2+T Algorithm Right side number Total learnt edges sensitivity specificity F-factor
MWST 7 12 0.32 0.51 0.39
SSEM 14 29 0.63 0.48 0.54
K2+T 17 35 0.73 0.485 0.57
Table 1 shows the comparison of standard semi-fixed structure EM learning algorithm, called SSEM developed by Liu [22] and our algorithm. We can see from the Table 1, using “K2 + T” algorithm to calculate the sensitivity, specificity and F-factor are respectively 0.73, 0.485, 0.57, while the results of the SSEM algorithm respectively are 0.63、0.48、0.54. It is clearly that the results of our proposed algorithm are higher than the SSEM algorithm. Finally, we try to learn the structure of gene regulatory networks from small sample data, and the result is not ideal as shown in Figure 1. By expanding the capacity of sample, the effectiveness of learning is obviously improved, as shown in Figure 2. But the proposed algorithm still infers the wrong side and unproven regulation relationship. One reason is that the introduction of the re-sampling data exist errors and noises; another reason is that the Bayesian network cannot construct a directed cyclic graph, which may cause that we should not learn all the right sides. Therefore, it is hard to learn the structure that is fully close to the real biological regulation network diagram.
6. Conclusion For inferring gene networks from microarray data, we combine the proposed structure learning method (“K2+T”) with Block bootstrap re-sampling approach. The experiment results show that the gene interaction edges in the re-sampling approximate 50% is proved to be correct and succeed in increasing the value of the three standards (sensitivity, specificity and Ffactor) which are better than the previous method. Block bootstrap re-sampling operation greatly improve the efficiency and accuracy of the Bayesian network structure learning, but its reliability is poor. In the future, we will combine with other multiple sources of biological data or other intelligence algorithms to reconstruct real gene regulatory networks.
Acknowledgement This work is supported by the National Natural Science Foundation of China (No.31170797, 30870573, 61103057), the Program for Changjiang Scholars and Innovative Research Team in University (No.IRT1109), the Program for Liaoning Excellent Talents in University (No.LR201003), and the Program for Liaoning Science and Technology Research in University (No.LS2010179).
References [1] [2] [3]
Friedman N. Inferring Cellular Networks Using Probabilistic Graphical Models. Science. 2004; 303(5659): 799–805. Wilkinson DJ. Stochastic Modeling for Quantitative Description of Heterogeneous Biological Systems. Nature Reviews Genetics. 2009; 10(2): 122–133. DeRisi JL, Iyer VR, Brown PO. Exploring The Etabolic and Genetic Control of Gene expression on A Genomic Scale. Science. 1997; 278(5338): 680-686.
Inferring Gene Regulatory Network from Bayesian Network Model Based…(Qian Zhang)
222 [4]
[5] [6] [7]
[8] [9] [10] [11] [12] [13] [14]
[15] [16]
[17]
[18] [19]
[20] [21]
[22]
ISSN: 1693-6930
Spellman PT, Sherlock G, Zhang MQ, Iyer VR, Anders K, Eisen MB, Brown PO, Botstein D, Futcher B. Comprehensive Identification of Cell Cycle-Regulated Genes of The Yeast Saccharomyces Cerevisiae by Microarray Hybridization. Molecular Biology of The Cell. 1998; 9(12): 3273-3297. Giacomantonio CE, Goodhill GJ. A Boolean Model of The Gene Regulatory Network Underlying Mammalian Cortical Area Development. PLoS Computational Biology. 2010; 6(9): e1000936. Kim DC, Wang XY, Yang CR, Gao J. Learning Biological Network Using Mutual Information and Conditional Independence. BMC Bioinformatics. 2010; 11(3): S9. Watanabe Y, Seno S, Takenaka Y, Matsuda H. An Estimation Method For Inference of Gene Regulatory Network Using Bayesian Network with Uniting of Partial Problems. BMC Genomics. 2012; 13(1): S12. Friedman N, Linial M, Nachman I, Pe'er D. Using Bayesian Networks to Analyze Expression Data. Journal of Computational Biology. 2000; 7(3-4): 601-620. Cooper GF, Herskovits E. A Bayesian Method for The Induction of Probabilistic Networks From Data. Machine Learning. 1992; 9(4): 309-347. Liu RY, Singh K. Moving Blocks Jackknife and Bootstrap Capture Weak Dependence. In Exploring the Limits of Bootstrap. New York: Wiley, 1992: 225-248. Lahiri SN. Re-Sampling Methods for Dependent Data. New York: Springer Verlag. 2003. Paparoditis E, Politis DN. Local block bootstrap. Comptes Rendus Mathematique. 2002; 335(11):959962. Chow CK, Liu CN. Approximating Discrete Probability Distributions with Dependence Trees. IEEE Transactions on Information Theory. 1968; 14(3): 462-467. Chen XW, Gopalakrishna A, Lin XT. Improving Bayesian Network Structure Learning with Mutual Information Based Node Ordering in The K2 Algorithm. IEEE Transactions on Knowledge and Data Engineering. 2008; 20(5): 628-640. Leray P, Francois O. BNT structure learning package: documentation and experiments. Laboratoire PSI-INSA Rouen-Fre CNRS. Report number: 2645. 2004. Zhao WT, Serpedin E, Dougherty ER. Recovering Genetic Regulatory Networks from Chromatin Immunoprecipitation and Steady-State Microarray Data. EURASIP Journal on Bioinformatics and Systems Biology. 2008: 1-12. doi:10.1155/2008/248747. Yu J, Smith VA, Wang PP, Hartemink AJ, Jarvis ED. Advances to Bayesian Network Inference For Generating Causal Networks From Observational Biological Data. Bioinformatics. 2004; 20(18): 3594-3603. Futcher B. Transcriptional Regulatory Networks and Yeast Cell Cycle. Current Opinion in Cell Biology. 2002; 14(6): 676-683. Peter E Hodges, Andrew HZ McKee, Brian P Davis, William E Payne, James I Garrels. The Yeast Proteome Database (YPD): a model for the organization and presentation of genome-wide functional data. Nucleic Acids Research. 1999; 27(1): 69-73. Vohradsky J. Stochastic simulation for the inference of transcriptional control network of yeast cyclins genes. Nucleic Acids Research. 2012, 1–8. Zoppoli P, Morganella S, Ceccarelli M. Time Delay-ARACNE: Reverse Engineering of Gene Networks From Time-course Data by An Information Theoretic Approach. BMC Bioinformatics. 2010; 11(1):154 Liu TF, Sung WK, Mittal A. Model Gene Network By Semi-fixed Bayesian Network. Expert Systems with Applications. 2006; 30(1): 42-49.
TELKOMNIKA Vol. 11, No. 1, March 2013 : 215 – 222