Department of IOMS
Inference and Regression Midterm Examination, 2012 Solutions • Instructions • Please write your name at the top of this page. • Please answer all questions on this question book. Do not turn in a blue book. • Please do not separate the pages of this exam booklet. • There are 13 questions in this exam. Questions 1 (25 points), 2 (20 points) and 3(15 points) are mandatory. Please answer 6 of the remaining 10 questions 4 – 13. All are worth 15 points, so your total points scored for the exam will be 25 + 20 + 15 + 6(15) = 150. • Where a computation is required to answer a question, please show your work. (I cannot give partial credit for an incorrect numerical answer unless the work provided shows a partially correct computation.) • This course and this examination are governed by the Stern Honor Code. • Introduction Several of the questions below are based on the Rayleigh distribution for a continuous, nonnegative random variable. This distribution is used, for example, to model wind speeds. The density of the Rayleigh random variable, which depends on one parameter, σ, is
= f ( x | σ)
− x2 x exp 2 , x ≥ 0, σ > 0. σ 2σ
(Note, σ is not the standard deviation of x.) The CDF and survival functions are
− x2 F ( x | σ) = 1 − exp 2 , x ≥ 0, σ > 0. 2σ − x2 = S ( x | σ) ex p 2 , x ≥ 0, σ > 0 2σ The raw moments of the random variable are determined by E[x ] = µk = σ 2 k
k
k/2
Γ(1 + k/2).
where Γ(t) is the gamma function. The first four raw moments implied by this relationship are: µ1 µ2 µ3 µ4
= = = =
σ 2 Γ(1 + ½) 2 σ 2 Γ(1 + 1) 3 3/2 σ 2 Γ(1 + 3/2) 4 2 σ 2 Γ(1 + 2) 1/2
[Tip: As you work on the problems below, remember the two useful results, Γ(1/2) = √π and Γ(m+1)=mΓ(m).]
1
[25] 1. Demand for tickets for events at the Z-Mobile center is normally distributed with mean µ and σ = 10,000. Previous experience suggests that µ < 35,000. But, recent data suggest that the mean has increased enough to need a new facility. In order to find out, I am going to carry out a test. My strategy is as follows: Sample 25 events. Compute the mean demand, x . The standard deviation, σ, is known to be 10,000. The rejection region is x > 37,000. a. b. c. d. e. f.
What is the null hypothesis for this test? What is the alternative? What is the probability of a type 1 error? What is the probability of a type 2 error if µ = 34,000 What is the probability of a type 2 error if µ = 36,500 What is the power of the test if µ = 37,500 If I repeat my experiment two more times (i.e., draw 25 more events, calculate x each time). What is the probability that I will reject the null hypothesis at least twice?
a. H0: µ < 35,000. The alternative is H1: µ > 35,000 b. Probability of a type 1 error is the probability that the null hypothesis is rejected even though it is true. In this case, we reject the null if x > 37,000.. The standard error of the mean is σ/√N = σ/5 = 10,000/5 = 2000.
Prob[ x > 37,000] = Prob[( x - 35000)/2000 > (37000 – 35000)/2000] = Prob[z > 1]. Since you did not have a table to work with, you can stop at this point. The right answer is 0.1587. c. Type 2 error occurs if you fail to reject the null when it is false. In this case, that occurs if x < 37,000 when the true mean actually is 34,000. The standard error of the mean is still 2000. So, this is the probability that z is less than (37,000 – 34,000)/2000 = Prob[z < 1.5]. This is .9332 d. Same calculation as c, but now the true mean is 36,500. This is prob[z < (37,000 – 36,500)/2000] = prob[z < .25] = .5987. e. Power of the test is the probability it will reject the null hypothesis when it is false. The power is the probabiity that x > 37,000 when the true mean is 37,500. This is Prob[z > (37,000 – 37,500)/2000] = prob[z > -.25] = .5987 (again) f. The probability of rejecting the null in the original test (part b) is .1587. You are going to run the same test 3 times. The rejection probability on each try is .1587. The probability you will reject at least twice is a binomial probability with N=3, π = .1587 and x = 2 or 3. The probability is 2 1 3 0 3C2 .1587 .8413 + 3C3 .1587 .8413 = .0636 + .0040 = .0676.
2
[20] 2. Derive the maximum likelihood estimator of σ for the Rayleigh distribution discussed in the introduction based on a sample of N observations, x1,…,xN. Find the variance of the MLE. The density given is
= f ( x | σ)
− x2 x exp 2 , x ≥ 0, σ > 0. σ 2σ
Logf = logx - logσ - x2/2σ2. Adding up N terms, the log likelihood is LogL = Σi logxi - Nlogσ - (1/2σ2)Σi xi2. The derivative is ∂logL/∂σ = -N/σ + (1/σ3) Σi xi2. Equating this to zero and solving for σ gives = σˆ
(1 / N )Σi xi2 .
To get the variance, differentiate logL again. ∂2logL/∂σ2 = N/σ2 – 3/σ4 Σi xi2. We need the expected value of this derivative. There are a couple ways to get that. In the introduction to the test, you are given E[x2] = σ22Γ(2) = 2σ2 since Γ(2)=1! = 1. So, the expected second derivative is N/σ2 – 3/σ4 (2Nσ2) = -5N/σ2. The variance is the negative of the reciprocal of this, which is σ2/(5N). As several of you noticed during the test, there is a typo in the statement of the density. It should be = f ( x | σ)
− x2 x exp 2 σ2 2σ
, x ≥ 0, σ > 0.
If we repeat the exercise with the correct density,
Logf = logx - 2logσ - x2/2σ2. Adding up N terms, the log likelihood is LogL = Σi logxi - 2Nlogσ - (1/2σ2)Σi xi2. ∂logL/∂σ = -2N/σ + (1/σ3) Σi xi2. Equating this to zero and solving for σ gives (1 / (2 N ))Σi xi2 . = σˆ The second derivative is 2N/σ2 – 3/σ4 Σi xi2. The expected square is still 2σ2, so the expected derivative is 2N/σ2 – 6N/σ2 = -4N/σ2 The variance is σ2/(4N).
3
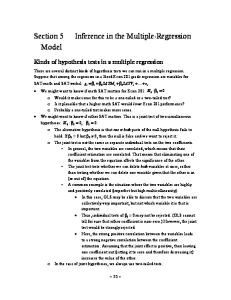
[15] 3. The following show the data and regression results for a case study that we did in class on March 20. The analysis describes the relationship between the variable ‘internet BUZZ’ and movie BOX OFFICE (in $million) for 62 movies.
a. b. c. d.
Which of the two variables is the dependent variable in the model? What is the sample correlation between BUZZ and BOXOFFICE? What is the meaning of the coefficient value 72.72 reported in the table of results? What proportion of the variation in BoxOffice is not explained by the regression?
a. b. c. d.
BoxOffice Square root of .424 = .651. Positive because the regression slope is positive When Buzz is 1 unit higher, we expect BoxOffice to be 72.72M higher. The proportion explained is 42.4%, so the unexplained proportion is 1-.424 = .576.
4
[15] 4. (The numbers in the following problem are completely fictitious, and surely have nothing to do with any actual results that might be obtained in the real world.) State patrol people in the state of Jefferson have developed a new device, the DDTest, that will detect if a teenager driving a car is distracted (by their mobile phone). The device makes a lot of errors, however. The following data have been learned from long experience: 25% of teenage drivers are actually distracted If a driver actually is distracted, the DDTest will reveal that in 75% of cases If a driver actually is not distracted, the DDTest will say they are not in 60% of cases. a. What is the probability that a driver is actually distracted if the DDTest says they are distracted? b. What is the probability that a driver is not distracted when the DDTest says they are not distracted? This uses Bayes theorem. Same problem we worked in class, different numbers. Let D denote distracted. Let + denote test says distracted, let – say not distracted. Let ~D mean not distracted.. Facts given: P(D) = .25. P(+|D) = .75, P(-|~D) = .6. a. Looking for P(D|+) = P(D,+)/P(+) = P(+|D)P(D)/[P(+|D)P(D) + P(+|~D)P(~D)] P(+|~D) equals 1 – P(-|~D) = 1 - .6 = .4. P(~D) = 1-P(D) = 1-.25 = .75. P(D|+) = .75(.25)/[.75(.25)+.4(.75)] = .25/.65 = 5/13. b. Same exercise, rearrange values. P(~D|-) = P(-|~D)P(~D)/[P(-|~D)P(~D) + P(-|D)P(D)] = .6(.75)/[.6(.75) + .25(.25)] = .878.
[15] 5. Demand for concert tickets at the ESP arena is normally distributed with mean 50,000 and standard deviation 15,000. The arena has 55,000 seats, and the operators do not allow floor standing – they will not allow more than 55,000 concertgoers to enter the arena. a. What is the probability of a sellout for a randomly chosen event? (I.e., what is the probability that demand exceeds capacity.) b. What is the probability of a sellout for an event if it is known in advance that demand for the event is at least 45,000 seats?
a. Sellout means demand > 55,000. Prob[Demand > 55,000] = prob[z > (55,000 – 50,000)/15,000] = Prob[z > 1/3]. Again, without a table, you stop here. The value is .3694. b. Prob[Demand > 55,000 | Demand > 45,000] = Prob[Demand > 55,000 and Demand > 45,000] / Prob[Demand > 45,000] Prob[Demand > 45,000] = Prob[z > (45,000 – 50,000)/15000) = Prob[z > -1/3]. We got this value in a. Prob[z > -1/3] = 1 - .3694 = .6306. So, the probability is .3694/.6306 = .5858.
5
[15] 6. How would you generate a random sample of 1,000 observations from the Rayleigh population discussed in the introduction, with σ = 2?
− x2 F ( x | σ) = 1 − exp 2 , x ≥ 0, σ > 0. 2σ We start by generating 1,000 random values that are Uniform (0,1), U1,…U1000. We can equate each of these to F then solving for x, we have 2
2
U = 1 – exp(-x /2σ ) so 2 2 1 – U = exp(-x /2σ ). 2 2 log(1-U) = -x /2σ 2 2 2σ log(1-U) = -x 2 2 -2σ log(1-U) = x 2 x = √[-2σ log(1-U)] so that is the strategy. Generate U using the usual random number generator. Then compute x using this formula. [15] 7. This question is based on the Rayleigh distribution discussed in the introduction. a. Find E[x] and Var[x]. b. The skewness coefficient for this variable is approximately .631. Is this variable symmetrically distributed, skewed to the right, or the left? c. The kurtosis for this variable is 3.245. Does this variable have thicker or thinner tail than the normal distribution. d. The median of the distribution is σlog(4). Is the distribution skewed leftward or rightward. Explain. a. E[x] = µ1 = σ 2 Γ(1 + ½) = σ 2 ½ Γ(1/2) = σ 2 √π = σ√(π/2). 2 2 2 2 E[x ] = σ 2 Γ(2) = 2σ 1Γ(1) = 2σ . The variance is the expected square minus the square of 2 2 2 the mean, = 2σ - σ (π/2) = σ [2 - π/2] b. Symmetry requires the skewness to be zero. This is skewed to the right, since the skewness is positive. c. Kurtosis for the normal is 3, so this distribution has greater kurtosis = thicker tails. Actually only one tail. d. “The median is σ log(4)” = 1.386σ. The mean is σ√(π/2) 1.2544. It looks like a contradiction to part b., since the symmetry is to the right, meaning that the mean is greater than the median. The problem is a typo, the median is σ times the square root of log4 = σ 1.1774. (Apologies for the error.) 1/2
1/2
-1/2
6
[15] 8. This question is based on the Rayleigh distribution discussed in the introduction. For the Rayleigh distribution, the maximum of the density function occurs at fmax = (1/σ)exp(-.5) = 0.606/σ. Suppose you have computed your maximum likelihood estimator of σ and it is 4.5. You have also estimated the asymptotic variance of your estimator and your estimated asymptotic variance is 2.25. Estimate fmax and obtain an estimator of the variance of your estimator of fmax. The function is .606/σ. We will estimate the function with .606/4.5 = .1347 2 We will use the delta method to compute the variance. The derivative is -.606/σ . The square of 2 4 the derivative is .606 /σ . Using our estimate, this is .000896. So, the estimated variance is .000896 times the 2.25 = .00202.
[15] 9. Suppose x1 and x2 are normally distributed normally distributed with means zero and zero, variances 1 and 2 and covariance zero. (They are independent). Variables z1 and z2 are formed as z1 = 3x1 + 2x2 and z2 = x1 – x2. What are the variances of z1 and z2? What is the correlation between z1 and z2? 2
2
Var(z1) = 3 Var(x1) + 2 var(x2). There is no covariance as x1 and x2 are independent. So, Var(z1) = 9(1) + 4(2) = 17 Var(z2) = Var(x1) + var(x2) = 3. The covariance of z1 and z2 is 3(1)var(x1) + 2(-1)var(x2) = 3(1) -2(2) = -1. The correlation is -1/sqr[17(3)] = -1/sqr(51).
[15] 10. The following are two moment equations for the Rayleigh random variable discussed in the introduction: µ1 = σ 2 2 µ2 = σ 2
1/2
Γ(1 + ½) Γ(1 + 1)
Find a method of moments estimator of σ based on a sample of observations, x1,…,xN. The mean is σ sqr(π/2) so just equate this to x-bar. The estimator of sigma is x-bar/sqr(π/2). The second equation is not needed, but it could be used instead, using as the moment the average 2 square of the observations to estimate 2σ . [15] 11. For the Rayleigh random variable discussed in the introduction, demonstrate whether or not the distribution is an exponential family. If it is an exponential family, what is (are) the sufficient statistics? Explain The log likelihood in question 2 (with or without the typo) is in 3 parts, one part that involves only 2 2 σ, one part that involves only the data, and the third part which is -(1/2σ )Σi xi . This implies it is 2 an exponential family, and the sufficient statistic is Σi xi .
7
[15] 12. Least squares without a constant. My regression model is y = βx + ε. (No constant term) a. Derive the least squares estimator of β given a sample of N observations, (x1,y1),…,(xN,yN) b. Suppose I ignore the known fact that the constant term in my model equals 0, and fit the model with a constant term anyway. Does this cause my estimator of β to be biased? a. The sum of squares is Σi (yi - βxi) . The least squares estimator of β minimizes this sum of squares. The derivative is 2
Σi 2(yi - βxi)(-xi) = -2Σi xi yi + 2Σi βxi . Equate this to zero and solve for β to get b = Σi xiyi / Σi xi . 2
2
b. The least squares estimators in the model yi = α + βx + ε are always unbiased. So, if you ignore the knowledge that α = 0, and compute a and b as if α were not zero, then your estimator a is an unbiased estimator of α = 0 and the estimator b is an unbiased estimator of β. 2
[15] 13. Referring to the Rayleigh random variable discussed in the introduction, suppose z = x . What is the distribution of z? Assumng
= f ( x | σ)
− x2 x exp 2 , x ≥ 0, σ > 0. σ 2σ
z = x so x = √z and dx = ½ 1/√z. Substituting for x and multiplying by the jacobian, 2
f(z) = √z / σ exp(-z/2σ ) ½ 1/√z. = (1/2σ) exp(-z/2σ ). 2
2
Fixing the typo, we would just divide this by σ giving f(z) = (1/2σ ) exp(-z/2σ ). If you let λ = 1/2σ , we have f(z) = λexp(-λz), which is the exponential density. The implication is that the Rayleigh distribution is the density of the square root of an exponential variable. 2
2
2
8