Inequality and the Labour Market: What can we learn from comparing India and Brazil? By Gerry Rodgers Project Paper H (f) October 12, 2015 V.B. Singh Memorial Lecture, 57th Annual Conference of the Indian Society of Labour Economics, Srinagar IDRC Project number 106919-002 (Institute for Human Development, New Delhi, India) IDRC Project number 106919-001 (Cebrap, Sao Paulo, Brazil) IDRC Project title: Labour Market Inequality in Brazil and India Institute for Human Development, NIDM Building, IIPA Campus, IP Estate, New Delhi 110002 Centro Brasileiro Análise Planejamento Cebrap, R. Morgado de Mateus, 615, São Paulo - SP, 04015-051, Brazil Contact:
[email protected];
[email protected] This report is presented as received from project recipent(s). It has not been subjected to peer review or other review processes. This work is used with the permission of Institute for Human Development/Cebrap, New Delhi/Sao Paulo. Copyright 2015, Institute for Human Development/Cebrap. Abstract This lecture presents some of the results from the project. The lecture first focuses on the broad pattern of inequality in the two countries, and shows its relation to social, political and economic forces. It then looks at the dynamics of inequality within the labour market; after which it focuses on structural inequalities, in terms of gender, race, caste and other factor and finally it assesses how the state tries to modify the outcomes in the two countries Keywords: growth regime, income inequalities, labour markets, state and social policies
1
V.B.Singh Memorial Lecture 57th Conference of the Indian Society of Labour Economics Srinagar, 12 October 2015 Inequality and the Labour Market: What can we learn from comparing India and Brazil? Gerry Rodgers Visiting Professor, Institute for Human Development, New Delhi
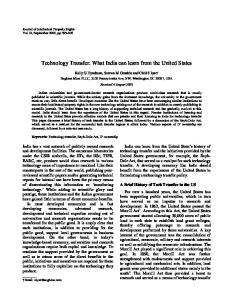
It’s a privilege to give the V. B. Singh lecture today. Vir Bahadur Singh made large academic and intellectual contributions, not least to the Indian Society of Labour Economics and to the Indian Journal of Labour Economics. An institution-builder, he played an important role in the development of research institutes and universities in his home state of Uttar Pradesh, as well as being a significant political actor. His writings covered a great deal of ground in international and national development, and especially on different aspects of labour. They provide a solid foundation for the topic of labour market inequality that I will address today. For instance, he wrote that “wages constitute one of the most neglected categories for economic research”, and in particular wage differentials. And he was also concerned how “unchanging occupational mobility persists like the caste system”. In this lecture I am going to present some of the results from an unusual research project, which brought together a team from the Institute for Human Development with a team from the Brazilian Centre for Analysis and Planning in São Paulo, with funding from IDRC. The goal of this project was to shed light on the factors determining trends in inequality in the two countries, and in particular trends in labour market inequality, and to do it as a collaboration which connected the academic traditions of both countries. So my lecture reflects a team effort. 1 I will first discuss the broad pattern of inequality in the two countries, and how it connects with social, political and economic forces and institutions during different periods of time. I will then look more specifically at the dynamics of inequality within the labour market. After that I will say something about some structural inequalities, in terms of gender, race, caste and other dividing lines. Finally I will say something about the different ways in which state intervention tries to modify the outcomes in the two countries. Our starting point for this exercise can be summed up in Figure 1, which shows the long term trends in inequality in India and Brazil, as measured by the Gini coefficient. What we see is almost a mirror image. Inequality rose in Brazil from the 1960s to the 1980s, peaked, and then started to fall, especially after 2000. In India, inequality showed little change until the 1990s. Actually the available evidence for earlier The members of the two teams, whose work provides the basis for lecture, have included Taniya Chakrabarty, Nandita Gupta, Ashok Pankaj, Janine Rodgers, Vidhya Soundararajan and myself, all at IHD, New Delhi; and Alexandre de Freitas Barbosa, Maria-Cristina Cacciamali, Fabio Tatei and Ian Prates at Cebrap, São Paulo. References to some of the papers produced by the team, on which this lecture draws, are given at the end of the paper.
1
2
periods suggests that there was a slight fall from 1950 to the 1970s. Then inequality started to rise, especially from the end of the 1990s. This figure shows the Gini coefficient, which is only one measure of inequality, but other evidence points in the same direction – for instance Piketty and Banerji’s work on the income share of the top 1 per cent in India shows a fall in this share up to 1980, and a rise thereafter. Figure 1: Gini coefficients of household income (Brazil) and expenditure per capita (India), 1960-2011 0.700
Brazil
0.600 0.500 0.400
India
0.300 0.200 1960
1970
1980
1985
1990
1995
1999
2004
2009
2011
Sources: India – National Sample Survey, various years; UN-Wider World Income Inequality database WIID V3.0B for earlier years (http://www.wider.unu.edu/research/Database/en_GB/database/); India Development Report, 2011 (IGIDR, Mumbai); and calculations from unit level data. Brazil - prepared by authors based on PNAD/F.IBGE data. Notes: Indian data refer to household expenditure per capita. Brazilian data refer to individual income. For 1980 to 1995 the Indian data relate to one or two years earlier than the date indicated in the figure.
There is clearly a connection with the pace of economic growth here. The steepest rise in inequality in Brazil was during the high growth “Brazilian Miracle” period of the late 1960s and 1970s. And inequality in India started to rise when the growth rate accelerated in the 1990s. But the story is more complicated than that. Inequality in Brazil stayed high during a period of slow growth in the 1980s and early 1990s, and was declining steadily during a period of moderate growth after 2000. In India, inequality rose more slowly after 2004, when growth rates reached the peak of 9 to 10 per cent, than between 1999 and 2004. It is not just the pace, but also the nature of growth. The other point in this figure is that it looks as though India has always been more equal than Brazil. But long term data for Brazil concern income, and long term data for India concern expenditure. Some data sources do permit you to compare inequality of income and of expenditure, such as the NCAER Human Development Survey. In 2004-05 the Gini coefficient for income inequality in India was almost 14 points higher than for expenditure (Figure 2). This would virtually close the gap between the two countries in 2011 in Figure 1.
3
Figure 2: Gini index of inequality compared across different variables and between different surveys, India, 2004-05 0.6 0.5 0.4 0.3 0.2 0.1 0 Wages
NSS expenditure
NCAER expenditure
NCAER income
Sources: NSS 61st round, unit level data (left hand two bars) and NCAER Human Development Survey 2004-05 (right hand two bars).
Notice, on the left hand side of the figure, that the Gini coefficient for wages alone is much higher than for household expenditure per capita in the NSS. In fact, for wages alone we can make a more direct comparison of inequality between Brazil and India over the last thirty years, because we have similar data for both. Figure 3 shows the Gini coefficients of wages for the two countries in rural and urban areas separately from 1983 to 2012. Figure 3: Gini index of wage inequality, India and Brazil, 1983 to 2011-12
Rural wages
Urban wages
0.6
0.6 Brazil
0.5
0.5 Brazil
0.4
0.4
India
0.3
India
0.3 1983 1994-95 2005 2011-12 Brazil
1983 1994-95 2005 2011-12
India
Brazil
India
Source: Brazil, prepared by the Cebrap research team on the basis of unit level data from the National household sample survey (PNAD); NSS, prepared by the IHD research team on the basis of unit level data from the National Sample Survey, various rounds. Note: “1994-95” refers to the 1993-94 National Sample Survey and 1995 PNAD data. 2005 refers to the 2004-05 National Sample Survey and 2005 PNAD data. 2011-12 refers to the 12011-12 National Sample Survey and 2011 PNAD data.
4
The results are quite clear. Wage inequality was lower in India than in Brazil in both urban and rural areas in the 1980s. But sometime between 1994 and 2005 the curves crossed, so that in 2011-12 inequality was higher in India than in Brazil. The pattern is sharper in urban than in rural areas, but present in both. There are a number of possible explanations for this urban-rural difference, which I will come back to, but it should be noted from the outset that it is easier and perhaps more legitimate to compare urban areas in Brazil and India than rural. Only 15 per cent of Brazil’s population is now rural, and much rural economic activity consists of large scale commercial farming – nothing like the small peasant farms that continue to dominate in India. On the other hand, urban habitats and economic structures have more in common between the two countries. Wage inequality is only one component of inequality. Even if we also measure inequality in income and expenditure, this is still not the whole picture. There is inequality in access to employment, capital or public resources; inequality in wealth; inequality of rights and recognition. We cannot cover all of these issues, in part because the data sources do not permit it. The lack of good information on wealth is particularly unfortunate, as Piketty’s recent work has amply demonstrated, because ultimately the inequality of wealth drives inequality of income. But even the analysis of a more limited range of indicators can tell an interesting story. . Growth Regimes and Inequality Inequality is embedded in social and economic structures and institutions. Drawing on the work of the French Regulation School (e.g. Boyer, 1994), which developed the notion of accumulation regimes, and also inspired by work in a “varieties of capitalism” tradition (Hall and Soskice, 2001), we made an attempt to characterize the pattern of growth in India and Brazil in terms of “growth regimes”. The underlying idea is that combinations of institutional forms give rise to different modes of social and economic regulation and a particular pattern of economic growth. Growth regimes are not predetermined, but reflect the intertwining of economics, politics and history. The key components of growth regimes, following (and expanding upon) Boyer, are • Type of integration in the international economy • The competition regime (monopoly, oligopoly and markets) • Wage labour relations and labour institutions • The agrarian system • The monetary and fiscal regime • The role of the state A growth regime may be stable for some period, but change eventually occurs because of its internal dynamics or contradictions, or because of external factors. This approach calls for a long term perspective. In both Brazil and India, we identified historical periods in which the pace and pattern of capital accumulation and growth were built around a particular set of political, economic and social institutions, and associated with a particular pattern of distribution.
5
The framework that we have used is summarized in the following charts. In the case of India we have drawn on the work of De and Valulabharanam (2013), among others. Many of the institutions that we see in Brazil and India today have their roots in earlier periods. The institutions that were put in place in the period from the 1930s to the 1950s were particularly important in both countries, so we take that as a point of departure. Of course, many aspects of inequality, with respect to gender, race or caste, for instance, are more deep-rooted still. In both Brazil and India, and indeed in much of the world, the 1980s were a point of inflexion, so we need also to separate the pre-and post-1980 periods. Figure 4 shows how we characterize the growth regimes prior to 1980. ______________________________________________________________ Figure 4: Growth regimes in Brazil and India, 1940-1980 Brazil Constrained (stateHeavy Heavy industrialization II managed) industrialization I (military regime) industrialization (public-private) (1967-1980) (up to 1955) (1956-63) 1940……..…1950………............1960……………..….…1970………......…1980 India Colonial -1947
State-driven post-colonial State-driven populist industrialization (1967-1980) (1947-1965) 1940……..…1950………............1960……………..….…1970………......…1980
Both countries embarked on a state-led development process in the mid twentieth century built around industrialization. Brazil had an extended successful period of import-substitution based industrialization, first – until 1955 – driven by state investment; then from 1956 built on partnership between the state and private capital, both domestic and foreign; and then, after the military coup in 1964, under an authoritarian regime which combined capital accumulation with repressive labour policies. This we present as three growth regimes, though it could also be seen as a single growth regime with three phases. The overall outcome was high growth, averaging almost 7 per cent per year from 1950 to 1980. By 1980 the secondary sector (including mining) accounted for over 40 per cent of GDP and 25 per cent of employment. In India, the initial phase of heavy industrialization after Independence was heavily dependent on public investment, which accounted for more than half of all investment by the mid 1960s. But industrialization faltered in the 1960s in the face of drought, war and the slow reduction of poverty. Populist policies after 1967 neither lifted the economy above the Hindu rate of growth of 3 to 4 per cent, nor significantly reduced poverty, and of course the second half of the 1970s was a period of political turmoil. In 1980 the secondary sector had reached only 23 per cent of GDP and 13 per cent of 6
employment, and within this the share of manufacturing had hardly risen since the mid 1960s. In 1980 India was still a largely agrarian country, while in Brazil agriculture accounted for only 10 per cent of GDP. These different growth paths generated very different patterns of inequality. In Brazil, there developed a large urban proletariat, with a degree of social protection, but with weak bargaining power, especially under the military regime after 1964. Wage differentials widened and a substantial middle class also emerged. At the same time, in a segmented labour market low productivity self-employment also grew. Wealth became increasingly concentrated. The result was the sharp rise in inequality that we note above. In India, in contrast, the urban/industrial proletariat remained small. The gap between this group and informal and rural workers widened, but there was no concentration of wealth at the top as in Brazil, indeed some transfer from the top towards the middle. As a result inequality did not worsen overall, but real wages for casual workers changed little, and poverty rates hardly fell. In 1980 Brazil looked at though it had put in place the foundation for continued rapid growth, while an improvement in India’s economic situation looked unlikely after the political and economic crises in the latter half of the 1970s. However, what actually happened was the reverse. The global recession at the beginning of the 1980s affected Brazil much more than India, for the former had grown dependent on volatile international capital flows and large export shares, while India was still quite autarchic. In Brazil the foreign debt burden grew, even as foreign direct investment dried up. Economic and political crisis fed on each other, with the implosion of the military regime, a collapse of industrial output and weak governments which were unable to control inflation. Growing unemployment, increasing informality and rising food prices hit the poor hardest, and inequality peaked at the end of the 1980s. The situation was brought back under control in the 1990s, but the combination of stabilization programmes with renewed liberalization in an open economy led to erratic and low growth. Nevertheless, a start was made on new social policies, minimum wages started to rise and inequality began to decline. Figure 5: Growth regimes in Brazil and India, 1980-2010 Brazil Economic crisis and Stabilization and Economic recovery with democratization liberalization redistribution (1981-89) (1990-1999) (2000-2012) 1980………….……..…1990………................2000……………..….…2010…… India Transitional with internal Liberalizing internally and externally liberalization (1991-2012) (1980-1991) 1980………….……..…1990………................2000……………..….…2010……
7
Meanwhile, India’s liberalization started in the 1980s, but initially consisted of a degree of domestic deregulation. In this transitional regime growth accelerated without a significant increase in inequality and poverty declined. But the more systematic deregulation after 1991 saw both increased growth and widening gaps in the labour market. Wages grew much more slowly than GDP and the wage share in modern industry declined. Trade unions played little role, unlike in Brazil where the redemocratization process in the 1980s had also built a strong trade union movement. Nor were there any major innovations in social policy during this period. At the end of the 1990s and the early 2000s the differences between Brazil and India became even more apparent. The period up to 2004 saw a substantial increase in inequality in India, as the benefits of higher growth were concentrated. There was little progress in human development indicators in this period (Drèze and Sen, 2013), and only slow growth in household expenditure. Meanwhile, policies aimed at reducing inequality were strengthened in Brazil, especially after the election of a new government from 2002, which put in place a successful combination of rising minimum wages, more systematic social transfers, and the creation of formal jobs. In contrast, India’s growth created little formal employment. The share of manufacturing hardly changed, and instead growth was built on construction – largely employing casual labour – and above all a rapidly growing service sector, in which high tech services in particular generated much value added but few jobs. Nevertheless, after 2004 there was a clear shift in the inequality trend in India. Looking back at Figure 3, there was a notable fall in wage inequality in rural areas after 2004, while it continued to rise in urban areas. This may in part be due to a tightening of the labour market for casual labour as a result of high growth, and it is true that casual wages did start to rise in both urban and rural areas. But there is also evidence that NREGA also played a role by helping to set a floor to at least some rural wages. But although the rise in inequality was stemmed after 2004 it was not stopped, which contrasts sharply with the Brazilian experience, where there was a steady decline in inequality up to at least 2012. The Labour Market Turning to the labour market, the pattern of growth prior to 1980 delivered rather different outcomes in the two countries. In Brazil most employment was urban by 1980, and in urban areas a majority of wage earners were registered, meaning that they had some social security entitlements and other legal protections. This had its roots in the Getulio Vargas governments between 1930 and 1954, which built an institutional framework for the labour market, with an extensive labour code, labour courts, supervised labour contracts and a rather state-dependent trade union system. While labour rights were weakened during the military period after 1964, the institutional structure persisted. Informal and unregistered work was quite substantial, especially in rural areas and in small enterprises, but it did not dominate the labour market. In India, in contrast, while many urban workers were in regular work of some sort, only a minority was effectively protected by law or trade union organization, and there was a growing body of casual workers, especially in rural but also in urban areas. The substantial labour code that was put in place in the post-Independence period in practice only reached a small minority of workers. So although the growth regimes were quite different, in both countries labour markets were segmented, wage 8
labour relations were increasingly heterogeneous and there was a large informal economy. But the disadvantaged segment of the labour market accounted for a much greater share of all workers in India. We have more detailed information on the structure of segmentation since the 1980s. Figure 6 shows the evolution of three labour status categories in the three countries – registered or regular work, unregistered or casual work, and self-employment. This is a good point to make a comment on the difficulties of comparative analysis. Indian labour market data are generally broken down into regular and casual work status. Broadly speaking, these correspond to monthly and daily paid work, but these categories are in fact not always well defined. In Brazil the usual breakdown separates workers with or without a signed labour card, which lays out workers rights and obligations. The concept of casual work is not in use in Brazil, and it is in fact quite difficult to translate it accurately into Portuguese. The nearest equivalent in Brazil is work without a signed labour card, or unregistered work, but this is by no means exactly the same thing as casual labour, since there is very little daily wage employment in Brazil. The category of regular work in India does not exactly correspond to registered work in Brazil either. Only about one third of regular work in India is formal, in the sense that there is a written contract and social security entitlements. In Brazil, registered work implies that there is a signed labour card, whereas in India much regular work is based on an oral agreement. The concept of self-employment is more similar in the two countries, but here too there are questions of how to treat unpaid family labour and subsistence activities. Despite these difficulties, it is useful to compare the trends in casual or regular work in India with those in registered or unregistered work in Brazil, because these are the basic segmentations of the labour market. As we can see in the following figures, there are some interesting differences in the experience of the two countries. Up to the end of the 1990s, there was little change in the share of registered or regular work in either country, with just some shift from self-employment to casual work in India which was not found in Brazil. But after 1999 the trends diverged. The share of registered/regular work rose in both countries, but much more steeply in Brazil. The share of unregistered/casual work fluctuated in India, but started to decline in Brazil after 2004-05. There was also a much sharper fall in self-employment in Brazil. Here we clearly see the consequence of the difference in growth regimes between the two countries.
9
Figure 6: Percentage of the occupied population in casual, regular and selfemployment (India) and unregistered, registered and self-employment (Brazil), 1976-2012 Casual/unregistered 35 30 25
India
20
India urban
15 10 1976
1983
1993-94
1999-00
2004-05
2009-10
2011-12
Regular/registered 55 45 India
35
India urban
25
Brazil
15 5 1976
1983
1993-94
1999-00
2004-05
2009-10
2011-12
Self-employed 65 55 India
45
India urban Brazil
35 25 1976
1983
1993-94
1999-00
2004-05
2009-10
2011-12
Sources: Unit level data from NSS and PNAD surveys
The pattern in India reflects the persistence of a large rural sector, which cannot be directly compared with Brazil, which is mainly urban. If we take only urban areas in India, the pattern of employment is closer to that in Brazil, for regular work and selfemployment at least, but the difference in the trend after the turn of the century is just as large. The proportion of regular work in urban India is similar to that of registered work in Brazil but the share of the latter has been rising much faster. We should
10
however recall that much regular work in India does not have the protections of registered work in Brazil. How important are these segmentations for understanding the overall pattern of inequality? One obvious indicator is the wage ratios between these different types of work. As Table 1 shows, here there is a difference between Brazil and India in both level and trend in these ratios. Casual wages in India average a little over one third of regular wages, and in urban areas the gap has hardly changed over the last thirty years; in rural areas there was little change until 2004-05, but then some increase in the ratio in 2011-12, perhaps reflecting the influence of the National Rural Employment Guarantee Act (MGNREGA), in which the national minimum wage was normally to be paid. In Brazil, on the other hand, unregistered wages were half of registered wages in 1993, and the ratio has since risen steadily, reaching 68 per cent in urban areas. Table 1: Ratio of casual to regular wages (India) and unregistered to registered wages (Brazil), 1993-2012 1993-95 2004-05 2011-12 India Rural 0.38 0.37 0.46 Urban 0.36 0.36 0.37 Brazil Rural 0.49 0.51 0.58 Urban 0.50 0.60 0.68 Sources: India – NSS; Brazil – PNAD.
The wage differences are large, so this form of labour market segmentation is clearly an important contributor to overall inequality. One way of estimating the size of this impact is by decomposing wage inequality into the proportion within and between these different labour status categories groups. The Theil index of inequality is a convenient measure for that purpose. Figure 7 shows the percentage contribution to the Theil index of wage inequality of wage differences between casual and regular workers in India, and registered and unregistered workers in Brazil. What we see is first of all, that this segmentation is much more important in India than in Brazil, in both rural and urban areas. In 2011-12 it accounted for 12 per cent of the Theil index in urban areas and 24 per cent in rural areas in India, against 3 per cent and 16 per cent in Brazil respectively. However, in both countries it has been coming down. This is not so much because of the reduction in the gaps in average wages between casual and regular workers (as we saw, this is negligible in India) but rather because of increasing variation of wages within these categories, especially within regular and registered work, as occupations have diversified. Other evidence suggests, for instance, that the gap between technical and white collar workers and other regular workers has doubled in modern industry in India. This has not been nearly so visible in Brazil, because the rising minimum wage has pushed up the floor. These estimates only concern wage workers. We have much less information about the incomes of self-employed workers, in India at least. However, if we look at data on household expenditure per capita we find that self-employed workers are roughly midway between casual and regular workers in India, whereas in Brazil they are 11
relatively better off, and with expenditure levels comparable to those of registered wage workers, on average. Figure 7: Percentage contribution of labour market segmentation to Theil index of overall wage inequality, Brazil and India, urban and rural, 1993-2012
Urban wages 40 30 20
Brazil
10
India
0 1993-95
2004-05
2011-12
Rural wages 40 30 20
Brazil
10
India
0 1993-95
2004-05
2011-12
Sources: Calculated from unit level household surveys; India – NSS; Brazil – PNAD.
These patterns reflect the impact of labour market institutions and trends in the growth path – in short, the overall growth regime. If the situation of casual workers is not improving in India, while that of unregistered workers in Brazil is, then this surely reflects the greater effectiveness of trade unions in Brazil, a wider scope for collective bargaining, more effective minimum wage policies, and efforts in other fields such as regional policy and education. So labour market segmentations play an important role in inequality in both countries. And of course the simple two-category breakdown used here only captures some of the factors involved. Formal production systems use informal workers through outsourcing and other means, and there are large variations in wages, employment security, protection and vulnerability in both formal and informal work. Above all, there are many other deeply embedded sources of inequality in the labour market in each country, including sex, caste, race and unequal access to education and skills, which structure the process of segmentation, giving rise to complex patterns of inequality and exclusion. I cannot possibly do justice to all of these factors in a short lecture, but let me comment on a few interesting patterns.
12
Divides and Cleavages Gender Let me start with gender. One of the most striking differences between Indian and Brazilian labour markets is the degree of gender inequality. Figure 8 shows the labour force participation rates of adult men and women in the two countries since 1980. Over that period, female labour force participation has been rising steadily in Brazil, while in India it has been constant or falling. As a result it is now twice as high in Brazil as in India. Figure 8: Labour force participation rates (%) of men and women, aged 15+, India and Brazil, 1980-2010 100 90 80 70 60
Brazil F
50
Brazil M
40
India F
30
India M
20 10 0 1980-81*
1990
1995
2000
2005
2010
Source: ILO, Key Indicators of the Labour Markets, 8th edition (Geneva, ILO), tables 1a and 1b,
The second difference is in the structure of employment. In India, women are concentrated in agriculture; in Brazil, they are concentrated in services. This is also true of men, but to a much lesser extent. In rural India both men and women are much more concentrated in casual work than in Brazil, but there is more similarity in urban areas. There are more women in wage work in urban Brazil, but the share of regular or registered work has been rising for women in both countries, and it is almost as high for women as for men, and almost as high in India as in Brazil. Of course the absolute numbers of regular women workers are lower because female labour force participation is so low. The increase in regular work also leads to a rising wage ratio between woman and men. Detailed wage distributions suggest that more women are gaining access to better paid regular work in India, and this increases average wages. But wage differences in casual work persist. Figure 9 shows the share of wage inequality in urban areas (percentage of the Theil index) explained by gender differences for different labour status categories. It can be seen that in India wage differences between men and women continue to be an important factor in inequality in casual work (although declining), while they have a negligible impact in unregistered work in Brazil. In contrast, while gender differences are less important in regular work in both countries their effect is larger in Brazil. In both countries there is a “sticky floor” 13
effect, reflecting the tendency for women to receive low wages in casual or unregistered work, and a glass ceiling; but the former is more important in India, and the latter is more important in Brazil. Figure 9: Decomposition of the Theil index of wage inequality by sex and across work status, urban areas, Brazil and India, 1994 to 2012
Urban registered/regular workers 16 12 Brazil
8
India 4 0 1994-95
2005
2011-12
Urban non-registered/casual workers 16 12 Brazil
8
India 4 0 1994-95
2005
2011-12
Source: calculated from unit level data, NSS and PNAD.
This is just one aspect of a complex issue. But these results do suggest that there is an important difference between the two countries in the way gender inequality works in the labour market, especially in better jobs. In India the issue is opportunity and access. Only a minority of women gain access to the labour market, but once access to a decent job is obtained, there is relatively less discrimination. In Brazil, opportunity and access is much more open; but discrimination and differentiation seem to be more important within the labour market. We observe this for gender inequality; but we also observe it for race and caste, which I will look at, briefly, next. Race and caste The idea that you can compare race or skin colour in Brazil with caste and community in India is often contested, and it is quite obvious that these are social constructs with totally different historical origins and symbolic interpretations. Nevertheless, when studying labour market inequality there are some significant common elements. Both provide mechanisms for labour market differentiation based on observable personal identity, and both are associated with hierarchies of income and social position. Both are extremely persistent, because of their social embeddedness. And both forms of hierarchy are officially rejected, and efforts are made to overcome them. Without going into this issue in any detail, some simple indicators give an idea of the dimension of this type of inequality. The most obvious comparison is between non-
14
whites and whites in Brazil, and Scheduled Castes and Tribes against all others in India. Table 2 shows the wage ratios. Two interesting points emerge. The first is that the wage ratio in 2011-12 is of the same order of magnitude in the two countries. The second is that while in Brazil the situation of the non-whites has been improving steadily over time, in India the situation of Scheduled Castes and Tribes has shown only marginal improvement. Table 2: Wage ratios between non-whites and whites (Brazil) and between Scheduled Castes and Tribes and all others (India) 1993-95 2004-05 2011-12 Brazil Rural 0.62 0.76 0.80 Urban 0.54 0.61 0.66 India Rural 0.76 0.72 0.79 Urban 0.68 0.67 0.70 Sources: NSS, PNAD
What is the contribution of these differences to overall inequality? To answer that question we need to also capture wider differentiation in India. The estimates in Figure 10 are based on the following groups in India: Scheduled Castes, Scheduled Tribes, Hindu OBC, Muslim OBC, other Muslim, other Hindu and other religion. To illustrate the patterns we look at urban registered or regular work. Figure 10: Contribution of race (Brazil) and caste/community (India) to the Theil index of wage inequality, urban registered/regular workers (%) 14 12 10 8 6
Brazil
4
India
2 0 2005
2012
2005
Male
2012 Female
There are several interesting points to make here. The first is that these factors account for a significant share of wage inequality, from 5 to 12 per cent. Second, for men there is not much difference between Brazil and India, but for women the impact is much greater in India. Third, in both countries there is a tendency for the impact to decline, more so in India than in Brazil. This would seem to contradict the evidence on wage ratios, but these include all workers, casual and regular, and it turns out that the pattern is different for casual or unregistered work. I don’t have time to go into these issues in more detail here, but the clear conclusion is that these stratifications remain important factors in labour market inequality.
15
A multivariate analysis There are many other dimensions of inequality, and each needs to be considered separately. However, to give a general picture it is useful to look at the results of a multivariate analysis of wage inequality, bearing in mind that such an analysis is built on a considerable simplification of the impacts of each factor. For this purpose, we use the decomposition method developed by Fields (2002). A simple Ordinary Least Squares regression of the determinants of log wages is conducted on various worker characteristics such as age, education, social group, industry of work, etc. The coefficients obtained from this regression are used to calculate the contribution of each of these characteristics to the overall observed inequality of wages. The base of this approach is therefore the standard earnings functions which are common in the labour economics literature. For this decomposition we used the following characteristics of the individuals concerned in the two countries: • Age • Sex • Type of wage work (regular or casual in India; registered or unregistered in Brazil ) • Education (six categories for India and five categories for Brazil) • Region (five regions identified in each country) • Socio-religious group (the in India was as follows: Scheduled Caste, Scheduled Tribe, Muslim, other. In Brazil white and non-white were distinguished). • Industry (standard 1-digit) • Occupation (standard 1-digit) • Rural-urban residence We report the results for 2011 (Brazil) and 2011-12 (India) in Figure 11. This figure presents the distribution of the explained portion of the decomposition across the different variables. The proportion explained is very similar in the two countries: 50.1% in Brazil and 51.1% in India. This is a very respectable level of explanation for an analysis using large household surveys, since there are always important interpersonal variations between individuals which cannot be captured by these standardized models, as well as unknown but probably significant errors of measurement, which will introduce random variation into the data.
16
Figure 11: Fields multivariate decomposition, India 2011-12, Brazil 2011. Per cent distribution of explained share (dependent variable: log wages). Whole country. 100 90 80
3.5
10
9.5
3.1
9.8
15.6 Age
70
Gender 60
35.8
30.3
50 40 30 20
Education Region Social group
6.8 1.3 1.6
10.1
Industry
2.5 2.6
Occupation
23.9
Rural-urban
24.3
10 0
Work type
7.8
1.4 Brazil
India
Source: prepared from unit level NSS data for India by Vidhya Soundararajan and from unit level PNAD data for Brazil by Fabio Tatei.
The first comment to make is how similar these patterns are in the two countries. In both countries the largest explanation comes from education, followed by occupation, followed by work type. In both countries industry and social group have only small effects. The main differences concern gender – much more important in India, age – much more important in Brazil – and rural-urban differences, much more important in India. Taking the results variable by variable, starting from the top, age is quite important in Brazil, reflecting the larger size of the modern sector where there can be significant career progression. The much greater importance of gender in India was already noted earlier on. It is significant that this does not disappear in the multivariate analysis – in other words, the gender effect is not just an education or occupation effect, but seems to reflect real discrimination or differentiation. Work type – casual/regular or registered/unregistered – somewhat surprisingly is more important in Brazil, but is large in both. Education then makes the largest contribution. In both countries it accounts for over 30 per cent of the explanation of wage inequality, slightly more in India. Regional differences are more important in Brazil, but note that to adequately
17
reflect regional diversity in India we would need more that the 5 regions identified here, so its real impact is probably greater. The surprising result is the small effect of social group, actually larger in Brazil. This suggests that, unlike for gender, there is not much direct wage discrimination. In this analysis the breakdown of social group in India is quite limited (SC, ST, Muslims and others) but the small contribution to inequality is still contrary to expectations. It is nevertheless consistent with the earlier suggestion that discrimination in India operates more at the point of entry to employment than in wage differences of those in work. It is notable that industry is much less important than occupation. Similar analyses for previous periods suggest that the importance of occupation has in fact been rising over time, as the economy diversifies, and this trend is stronger in India. In fact occupation should be considered in conjunction with work type, since many occupations typically fall within one or other of the labour status categories (white collar workers are mostly regular; unskilled labour is casual). Occupation and work type together account for about 34 per cent of the explanation in India, and almost 40 per cent in Brazil. Finally, rural-urban differences, as expected, are more important in India. Separate rural and urban analyses, not reported here, suggest that there is more difference between rural and urban areas in the pattern of explanation in each country than there is between the two countries overall. In both countries, the largest contribution comes from education. This is in line with the common conclusion that investment in education is an effective way to reduce inequality. However, this model does not take into account that access to education is also unequally distributed, and so is not truly independent of some of the other variables. In particular, the low direct effect of social group may be substantially increased by an indirect effect coming through the unequal access to education of non-whites in Brazil and lower castes and Muslims in India. The State and Inequality What role has intervention by the state played in these outcomes? Obviously many dimensions of inequality are embedded in labour market structures or social relations. But the state acts, directly or indirectly, to support particular interests, promote opportunity or redistribute resources. This is something that can be best understood within the broader framework of the growth regime. In Brazil, the economic structures and institutions put in place by the state in the 1940s and 1950s provided protection and security for a growing industrial working class, but generally failed to reach rural areas until the 1970s. The goals were mainly those of conventional social security, along with the expansion of health and education systems, but many groups were excluded from “social citizenship”, and redistribution, in the form of social assistance, was not an important goal. This is one reason why inequality grew sharply under the repressive military regime in the 1960s and 1970s, which was allied with both domestic and foreign capital, and built its support on a growing national middle class. During this period the state in India was explicitly socialist in orientation, but without the means to reach the population as a whole. Because of the preponderant role of the state in production there was less scope for benefits to be concentrated in private hands, and limited land reforms along with populist programmes in the 1970s, and some measures to protect industrial 18
workers (including minimum wages and protection against dismissal), directed some resources away from the rich, though not necessarily towards the poor. However, in some sense poverty was shared. It is these broader forces, rather than specific policies, which explain the divergent trends in inequality in the two countries. This was also true after 1980, when there was a clear shift in the ideological frame in both. In India the coordination between the state and private capital strengthened in the 1980s, ultimately leading in the 1990s and 2000s to a much reduced intervention of the state, both in terms of public investment and in terms of effective regulation. This was an important factor in the shift from wages to profits in organized industry, and the strengthening of market forces also increased differentiation within the labour market. In Brazil democratic forces reasserted themselves in the 1980s, and the 1988 Constitution, which coincided with the peak of inequality, laid out a wide range of rights and entitlements. Nevertheless, the 1990s saw a strengthening of liberalization, as in India – in both cases, of course, responding to the international political economy as much as to domestic forces. The centrist government in power in Brazil from 1994, hamstrung by an overhang of debt, put in place some new mechanisms for redistribution but in a context of economic recession and austerity. After 2002 in Brazil and 2004 in India a political reaction led to the election of governments with greater social commitment, more so in Brazil where the Worker’s Party, brought to power with trade union support, put in place a series of policies to redistribute resources to the poor, while maintaining relatively conventional macroeconomic policies. In India a less coherent political coalition led by the Congress party introduced a number of social policies, including a 20 per cent increase in the real national floor minimum wage (which however stagnated in real terms thereafter) and above all the national rural employment guarantee scheme, but without directly threatening the private interests that had developed under liberalization. The result in India was to moderate the rise in inequality, while in Brazil the decline in inequality initiated under the previous government accelerated. Any assessment of policies to reduce inequality has to be placed within these wider political settings, because success or failure depends less on the technical characteristics of the policy than on the political environment in which it is implemented. But beyond the political economy at any point in time, there are also rather fundamental differences in approach to social policy between Brazil and India, differences which in part derive from the power and orientation of the state, but which are also embedded in the ways public policy is conceived. These too condition the success and failure of policies in particular domains and directly affect the capacity of the state to influence inequality. Perhaps the most fundamental is the size of the state and the resources which it devotes to social policies. In India, between 1990 and 2007, social sector expenditure accounted for around 6 per cent of GDP, rising thereafter to about 8 per cent in 2013. In contrast, in Brazil, total public social spending accounted for between 15 and 20 per cent of GDP in the first half of the 1990s, rising to 22 per cent in 2002 and 27 per cent in 2009. So in relative terms, Brazil devoted three times as much to social policy 19
as India. This is of course to some degree a question of overall resource availability, since Brazil’s GDP per capita was higher, but the increase in India since 1990 was small if compared with the large increase in GDP. This is a primary constraint on state redistribution. Second, Brazil has laid a foundation of conventional social security (pensions, health insurance, accident insurance, unemployment insurance, social assistance) which delivers important transfers to lower income groups. Social security of this type exists in India, but only for a small fraction of the working population. Instead, India has developed a series of programmes aimed at particular needs – the Public Distribution System for food security, Indira Avaas Yojana for housing needs, pension programmes for widows or the disabled, etc. More recently, large scale redistribution has been based on conditional cash transfers in Brazil – Bolsa Familia, Bolsa Escola – and these have played an important role in reducing inequality (30% of the recent decline in the Gini coefficient could be attributed to cash transfers according to recent estimates). While there is some move towards cash transfers in India, they are mainly seen as ways to improve the efficiency of specific programmes, rather than a universal means of redistribution. Third, in Brazil social policy has since the 1988 constitution tended to be universal, at least in principle, while in India it tends to be targeted. Social security is a case in point. Much social policy in India, and in particular the programmes listed above, is in principle aimed at a “Below Poverty Line” population, and a regular exercise attempts to identify the population concerned on the basis of various and changing criteria. In Brazil there are income cut-offs for access to some benefits, but the underlying principle is usually one of universal access. This is changing in both countries today as “rights-based” policies (food, education) gain traction, but this is not yet the dominant practice in India. The underlying logic is of course that targeted transfers should help avoid leakage and reduce costs. An important example of particularism concerns reservation policies. The reservations for particular castes of a percentage of public sector jobs, and more recently of admission to public sector educational establishments, is one of the main instruments in India aimed at reducing inequality. Policies of this type are much less in evidence in Brazil, where preference is given to broader based programmes to raise qualifications, for instance. The political visibility of these policies in India has made them central elements of any strategy for redistribution, though they seem to be rather ineffective ways of redistributing resources, since large gaps between Scheduled Castes and Tribes and others remain more than 60 years after these policies were first put in place. Fourth, in India the primary goal of redistributive policy is generally expressed as poverty reduction, rather than the reduction of inequality. Indeed, it is widely argued that provided poverty declines it is unimportant if inequality increases. There is little traction in India for the idea that poverty is relative in nature, and that poverty and inequality are closely interconnected. In Brazil, in contrast, while poverty reduction is an important target, and has given rise to major policy approaches such as the “Zero Hunger” initiative, the reduction of inequality is also seen as a valid goal in its own right. This may of course be a reaction to the extremes of inequality reached in the 1980s. 20
Fifth, there is in India a much greater focus on employment creation as a means of reducing poverty (and implicitly inequality). This is most apparent in the reliance on public works programmes of various sorts, most recently MGNREGA, as the vehicles to transfer resources to the poor. This tradition is almost absent in Brazil. Employment creation is of course on the agenda in Brazil, but mainly through attempts to promote private sector employment creation, notably in small enterprises. Sixth, in both countries labour market intervention is seen as one ingredient of redistributive policy, but much more explicitly in Brazil, where the minimum wage has in recent years been playing an important role in reducing labour market inequality. Although it could play the same role in India, this is undermined by weak implementation. Seventh, the role of social movements is different in the two countries. The organized trade union movement is much stronger and more influential in Brazil; but NGOs have played an important part in designing and influence policy in India, notably promoting rights-based policies and MGNREGA, These differences in framework and philosophy make it rather risky to make direct comparisons between the effectiveness of particular policies in the two countries, for a policy instrument that works in one setting may well fail in another. But there is another factor – that clusters of policies need to be seen together. There is, for instance, a tendency for Bolsa Familia in Brazil to be compared with MGNREGA in India as means for transferring resources to the poor and reducing inequality. But Bolsa Familia works in a context where there is a wider social security system, with particular family structures and educational opportunities, trade union organization and legal protections in the labour market. MGNREGA operates in a rural context with seasonal unemployment where other social security instruments are lacking and legal protections are weak, but there is a Public Distribution System providing food subsidies, housing programmes, reservation policies and other local policies. Clearly it is the set of policies as a whole that needs to be compared, even if they are not designed as a coherent whole. The reality is that efforts to reduce inequality are only likely to be successful where a package of complementary policies is put in place. In Brazil, the foundation of declining inequality in the last fifteen years or so was rising minimum wages, the large scale creation of formal employment, transfers through Bolsa Familia and a variety of local policies concerned with education, training and other areas. In both countries it can also be seen that different policy instruments affect different parts of the income distribution. Cash transfers, wage policies, education policies, employment policies and effective labour market regulation do not reach the same populations, so multiple measures of inequality are needed to capture and compare their impacts. We must not use the word inequality as if its content were obvious. It takes different forms. We have focused on economic inequality – in terms of wages, incomes and consumption levels – but this is only part of the story, for there is inequality in wealth, in security, in capability, in prestige, in power… in happiness… Nor is it simple to characterize inequality. We reduce it to summary measures such as the Gini coefficient, but in fact we may be interested only in how well people do at the bottom or the top, compared with the rest. For instance, it often is argued that the primary 21
concern will be to ensure that everyone reaches a certain standard of economic welfare (so we are concerned with the bottom of the distribution), without regard to what happens at the top. In this debate the contrasts between Brazil and India help to show what is specific and what is general. The divergences help to identify proximate causes and correlates. The similarities may point to more systematic, wider influences which are felt beyond these two countries. And finally, what about the future? Brazil is presently in economic and political crisis, its economic model is questioned, and it is by no means sure that the present, equalizing growth regime will continue. But the shape of any new growth regime is very unclear. India too may be at a turning point, for its economy is increasingly dependent on an uncertain world economy, and growing inequality is likely to raise social and economic tensions and become a threat to continued growth. But whether this situation can be overcome is another story. Sources and references
Project papers Barbosa, Alexandre de Freitas;Maria Cristina Cacciamali; Taniya Chakrabarty; Nandita Gupta; Gerry Rodgers; Janine Rodgers and Fabio Tatei. Growth, Labour and Inequality in Brazil and India: A comparative study. Manuscript to be published in 2016. Barbosa, Alexandre de Freitas;Maria Cristina Cacciamali; Gerry Rodgers; Fabio Tatei, “Minimum wage in Brazil: A useful policy tool to reduce wage inequality?” in Gregory Randolph and Knut Panknin, Global Wage Debates: Politics or Economics, JustJobs Network, September 2015. Cacciamali, Maria Cristina, Taniya Chakrabarty, Gerry Rodgers, Fabio Tatei, Minimum Wage Policy in Brazil and India and its Impact in Labour Market Inequality. Institute for Human Development Working Paper, 2015. Rodgers Gerry and Vidhya Soundararajan, Patterns of Inequality in India, 19832011/12, Institute for Human Development Working Paper, 2015 Further papers are in preparation from the IHD-Cebrap project on Labour market inequality in Brazil and India. For up-to-date details consult www.ihdindia.org/lmi Other references Boyer, Robert (1994), “Do labour institutions matter for economic development? A “Régulation” Approach for the OECD and Latin America with an extension to Asia”, in Workers, Institutions and Economic Growth in Asia, G. Rodgers, ed., Geneva, International Institute for Labour Studies.
22
De, Rahul and Vamsi Vakulabharanam (2013), Growth and distribution regimes in India after Independence, paper presented to the World Economics Association Conference on Inequalities in Asia, 12 May-8 June. Drèze, Jean and Amartya Sen (2013), An Uncertain Glory, India and Its Contradictions, London, Allen Lane. Fields, Gary S. (2002): “Accounting for Income Inequality and its Change: A New Method, With Application to the Distribution of Earnings in the United States”, Cornell University ILR School, digitalcommons.ilr.cornell.edu Hall, Peter and David Soskice (2001): Varieties of capitalism:: The institutional foundation of comparative advantage, Oxford, Oxford University Press.
23