08 April 2015 Asia Pacific/Indonesia Equity Research Department Stores / Distributors / General Merchandise Stores (Retailing ID (Asia))
Indonesia Retail Sector Priscilla Tjitra 62 21 2553 7906
[email protected] Ella Nusantoro 62 21 255 37917
[email protected]
SECTOR REVIEW
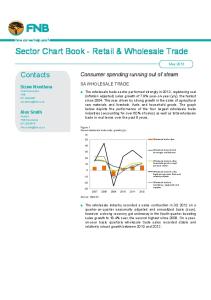
Let's go shopping! Figure 1: Improving inventory days across retailer categories 100 200
Inventory days
90 80
160
70
120
60
80
50
40
40
30
0 4Q14
3Q14
Electronics
2Q14
1Q14
4Q13
3Q13
FMCG
2Q13
1Q13
4Q12
3Q12
Fashion
2Q12
1Q12
4Q11
3Q11
2Q11
1Q11
Aggregate
Inventory days (home improvement only)
Research Analysts
Home improvement
Source: Company data, Credit Suisse estimates
■ Margins are still being hit, but inventory improving. Our analysis of 18 listed Indonesian retailers' FY14 financials reveals that margins are still being hit by higher product costs and opex. Since 4Q14, however, inventory days have started improving YoY—for the first time since the fuel price hike, and the rupiah collapse in June 2013. We believe this could be a positive sign for the industry. ■ We prefer fashion and FMCG retailers... Based on our analysis across retailer categories, our preference leans towards: (1) fashion retailers, where inventory days have started normalising since 4Q—with the old stocks out, we believe the stores' discounts should ease, which means likely better margins; and (2) FMCG retailers, which have the highest top-line growth compared with other categories—this in our view is because of the staple nature of their products and expansion into new regions. ■ …to others. For electronics retailers, top-line sales are mainly driven by rupiah adjustments rather than volumes; as most of the products are imported, they are most negatively affected by the rupiah weakness. Homeimprovement retailers: ACES, the biggest player in this category, saw negative SSSG in 4Q and 2M15. Inventory has started declining but it is still high at 170 days. 80% products in the category are imported . ■ Stock picks. We like LPPF for its flexible business model (product-mix innovation) that allows it to maximise margins. We are excited about the developments at MAPI with the upcoming CVC deal. We also like MPPA due to its exposure to growing FMCG retailers. DISCLOSURE APPENDIX AT THE BACK OF THIS REPORT CONTAINS IMPORTANT DISCLOSURES, ANALYST CERTIFICATIONS, AND THE STATUS OF NON-US ANALYSTS. US Disclosure: Credit Suisse does and seeks to do
business with companies covered in its research reports. As a result, investors should be aware that the Firm may have a conflict of interest that could affect the objectivity of this report. Investors should consider this report as only a single factor in making their investment decision.
CREDIT SUISSE SECURITIES RESEARCH & ANALYTICS
BEYOND INFORMATION® Client-Driven Solutions, Insights, and Access
08 April 2015
Focus charts and tables Figure 2: Revenue in 4Q slowed due to Nov-14 fuel hike 35%
23.0% 22.7%
30%
fuel hike Nov-14
22.5% 22.0%
fuel hike Jun-13
20% 15%
21.5% 21.3%
21.3% 21.2%
21.3%
21.1%
21.0%
21.0%
10%
9%
5%
20.5%
0%
20.0%
8.5%
8% 7%
22.2%
25%
Figure 3: Margins are still being hit
7.5%
7.4%
7.4%
6.9%
6.6%
6.3%
6.3%
6%
5.6% 5.5%
5.4%
5.2% 4.7%
5% 3.8%
4%
3.8%
3.3%
3%
4.3%
3.8%
3.8%
2.9%
2.5%
5.2%
3.0%
2.3%
2% 1%
1Q13
2Q13
3Q13
4Q13
1Q14
Revenue YoY
2Q14
3Q14
4Q14
0% 1Q13
2Q13
3Q13
4Q13
EBITDA margin
Gross margin (RHS)
1Q14
2Q14
Op. margin
3Q14
4Q14
Net margin
Source: Company data, Credit Suisse estimates
Source: Company data, Credit Suisse estimates
Figure 4: … but inventory days in 4Q have improved since
Figure 5: …across different retailer categories
the post June 2013 fuel hike levels… 100.0 90.0
Inventory days
80.0
77
Average 59 days
62 57
60.0
54
53
75 72
70
68
70.0
79
59
61
64
Inventory days
Average 78 days
77
200
90 80
160
70
120
60 80 50
56
40
40
50.0
30
0
4Q14
Home improvement
3Q14
Fashion
Electronics
2Q14
Aggregate
1Q14
4Q13
3Q13
2Q13
1Q13
4Q12
3Q12
2Q12
1Q12
4Q11
3Q11
4Q14
3Q14
2Q14
1Q14
4Q13
3Q13
2Q13
1Q13
4Q12
3Q12
2Q12
1Q12
4Q11
3Q11
2Q11
1Q11
Source: Company data, Credit Suisse estimates
2Q11
1Q11
40.0
Inventory days (home improvement only)
100
92
FMCG
Source: Company data, Credit Suisse estimates
Figure 6: Valuation comparison Ticker
LPPF.JK MPPA.JK ACES.JK MAPI.JK RALS.JK ERAA.JK ECII.JK
Company name
Matahari Dept. Store Matahari Putra Prima Ace Hardware Indonesia Mitra Adiperkasa Ramayana Lestari Erajaya Swasembada Electronic City Weighted average
Rating Mcap
O O U O N N O
Price Target price US$ (LC) (LC) mn 4,361 19,400 19,400 1,719 4,150 4,700 945 715 630 767 6,000 6,500 421 770 830 202 905 1,100 141 1,375 1,600
P/E (x) 15E
EPS growth (%) 16E 15E 16E
29.5 38.1 21.1 48.6 14.9 8.4 12.2 30.5
22.9 30.9 18.2 25.7 13.8 7.7 7.9 23.2
35.1 5.7 4.9 176.4 3.4 10.8 15.7 36.1
29.0 23.5 15.9 89.3 7.8 8.1 54.2 30.7
PEG (x)
Net margin (%)
15E
16E
15E
16E
0.9 2.7 2.1 0.4 2.7 0.9 0.4 1.4
0.7 2.2 1.8 0.2 2.5 0.8 0.2 1.2
20.8 3.7 11.2 1.5 6.0 2.1 6.0 13.2
22.4 3.9 11.2 2.5 6.1 2.2 6.9 14.2
3M ADTV US$ mn 5.2 10.5 1.3 0.6 0.7 1.0 0.2 5.0
Prices as of 7 April 2015. Source: Company data, Credit Suisse estimates
Indonesia Retail Sector
2
08 April 2015
Let's go shopping! Our analysis of 18 listed Indonesian retailers'1 FY14 financials reveals that margins are still being hit by higher product costs and opex pressure. Retailers have seen higher inventory days as a result of slower sales from a softer purchasing power post fuel price hike and the rupiah collapse in June 2013. Since 4Q14, however, inventory days have started improving. We believe this is a positive sign for the industry. Based on our analysis across retailer categories, our preference leans towards fashion and FMCG retailers. Our conclusions: (1) Fashion retailers: Inventory days of the fashion retailers have started improving since 4Q (on average 62 days). With the old stocks out, we believe the stores' discounts should ease, which means likely better margins. (2) FMCG retailers: FMCG retailers have the highest top-line growth of 18% YoY compared with other retail categories. We believe this is owing to the staple nature of their products (SSSG: 5-6%) and the fact that they are expanding into new markets. We don’t see higher inventory days in 4Q as a threat, as we believe this is due to stores expansion, especially beyond the Java region. (3) Electronics retailers: We believe that top-line sales growth for electronics retailers is coming mostly from rupiah adjustments rather than volumes. Since 4Q, inventory has improved as retailers/distributors removed old stocks before newer model launches at the beginning of the year. As most products are imported, electronic retailers are most negatively affected by the rupiah depreciation. (4) Home improvement retailers: ACES, the biggest player in this category, saw negative SSSG in 4Q, and into 2015. Inventory days have started improving but they are still high in our view, i.e., over 170 days.
We like fashion and FMCG retailers Among the fashion and FMCG retailers, we prefer Matahari Department Store (LPPF), Mitra Adiperkasa (MAPI), and Matahari Putra Prima (MPPA): ■
Matahari Department Store (LPPF): We like Matahari for its more resilient middle class focus, and flexible business model that allows it to maximise margins. Some initiatives on the product mix such as increasing the proportion of direct purchases (versus consignment) and introducing new private label brands to cater to a broader customer base have improved its gross margins and offset the higher opex pressure. We believe LPPF has a strong balance sheet to sustain the lean times due to its net cash position.
■
Mitra Adiperkasa (MAPI): We are excited about the developments at MAPI, with the spin-off of its sports division (MAA) into CVC. We believe that the deal will expedite the company's margins turnaround, given the immediate interest cost saving upon the Rp1.5 tn cash inflow receipt. We also expect CVC to potentially turn around the business in the coming years, given that the deal's valuation at 30x P/E is not inexpensive.
■
Matahari Putra Prima (MPPA): Due to its exposure to growing FMCG retailers, we like MPPA, which shows improving margins from bigger economies of scale and continued operating efficiency. In 2015, management will carry on its strategy of focusing on bottom-line rather than just top-line growth. It aims to increase gross margin by about 10-20 bp YoY this year, coming from a more concerted promotions strategy (focus on 200 common household basket items).
1
The18 listed Indonesian retailers are: LPPF, RALS, BATA, MAPI, MPPA, HERO, AMRT, MIDI, RANC, ACES, CSAP, KOIN, ECII, TELE, ERAA, GLOB, TRIO, and MTDL.
Indonesia Retail Sector
3
08 April 2015
Margins are still being hit… The aggregate revenue across retailers grew 16% YoY, versus the reported headline inflation of 8% in FY14. We believe the volume component of this top-line growth is fairly weak, considering there was also price adjustment due to the 14% YoY depreciation of the rupiah. Gross margin dropped some 25 bp YoY as the retailers could not fully pass on the costs increase to customers. Operating margins dropped further 61 bp YoY, on the back of rising salaries, utilities as well as distribution costs. Net margin was down 63 bp YoY; additional pressure may come from interest costs. Looking at the quarterly numbers, 3Q usually is the strongest for retailers (due to Lebaran spending); this explains the QoQ decline. If we compare YoY, 4Q revenue was up 12% YoY and gross margins were quite stable. Deterioration in net margins appears to have come from higher opex pressure and financing costs. Figure 7: Retailers' margins hurt by higher product costs and opex pressure* (Rp bn) Revenue COGS Gross profit Opex Operating profit Net profit Margins: Gross profit Operating profit Net profit
12M13 12M14
YoY
4Q13
1Q14
2Q14
146,501 170,463 114,766 133,967 31,735 36,496 23,811 28,324 7,923 8,172 5,338 5,145
16.4% 40,659 38,253 41,379 16.7% 32,004 30,227 32,640 15.0% 8,654 8,026 8,739 19.0% 6,476 6,571 6,965 3.1% 2,178 1,456 1,774 -3.6% 1,539 876 1,187 bps chg 21.7% 21.4% (25) 21.3% 21.0% 21.1% 5.4% 4.8% (61) 5.4% 3.8% 4.3% 3.6% 3.0% (63) 3.8% 2.3% 2.9%
% to FY: Revenue Gross profit Operating profit
3Q14
4Q14
QoQ
YoY
45,212 45,619 0.9% 35,178 35,922 2.1% 10,033 9,698 -3.3% 7,482 7,306 -2.4% 2,551 2,391 -6.3% 1,735 1,348 -22.3% bp chg 22.2% 21.3% (93) 5.6% 5.2% (40) 3.8% 3.0% (88)
12.2% 12.2% 12.1% 12.8% 9.8% -12.4% bp chg (3) (11) (83)
27.8% 22.4% 24.3% 26.5% 26.8% 27.3% 22.6% 24.4% 26.3% 26.8% 27.5% 22.0% 23.9% 27.5% 26.6%
*data based on LPPF, RALS, BATA, MAPI, MPPA, HERO, AMRT, MIDI, RANC, ACES, CSAP, KOIN, ECII, TELE, ERAA, GLOB, TRIO, and MTDL. Source: Company data
Fashion retailers: 4Q margins still relatively weak Consumer spending growth in fashion in 2014 grew 14%, slower than in previous years (versus average of past three years ~20%). 3Q was the peak season for fashion retailers due to Lebaran spending. In 4Q, revenue rose 9% YoY, while margins were still weaker YoY. We suspect the lower gross margins were due to stores discounting to flush out old inventories. Figure 8: Fashion retailers—FY14 and quarterly results* (Rp bn)
12M13 12M14
Revenue COGS Gross profit Opex Operating profit Net profit
23,392 11,677 11,715 8,716 2,999 1,913
Margins: Gross profit Operating profit Net profit
50.1% 48.9% 12.8% 11.4% 8.2% 7.5%
26,618 13,602 13,016 9,983 3,033 2,007
YoY 13.8% 16.5% 11.1% 14.5% 1.1% 4.9%
4Q13 5,990 2,991 2,999 2,394 605 377
1Q14 5,546 2,874 2,672 2,234 439 251
2Q14 6,393 3,243 3,150 2,469 681 433
3Q14 8,161 4,187 3,974 2,687 1,287 980
4Q14 6,517 3,298 3,219 2,594 625 344
QoQ
YoY
-20.1% 8.8% -21.2% 10.3% -19.0% 7.4% -3.4% 8.4% -51.4% 3.3% -64.9% -8.8%
bps chg bps chg bps chg (118) 50.1% 48.2% 49.3% 48.7% 49.4% 70 (67) (143) 10.1% 7.9% 10.7% 15.8% 9.6% (618) (51) (64) 6.3% 4.5% 6.8% 12.0% 5.3% (672) (102)
*Data based on LPPF, RALS, BATA, and MAPI. Source: Company data
Indonesia Retail Sector
4
08 April 2015
Figure 9: Matahari Dept. Store leads on same-store-sales growth SSG*
3M14
6M14
9M14
FY14
4Q14
LPPF RALS MAPI
9.3% 7.5% 12.0%
12.6% 7.0% 9.0%
11.3% 1.3% 10.0%
10.7% 0.6% 9.0%
8.7% -0.2% 8.0%
*Fashion retailers that reported SSSG data. Source: Company data
FMCG retailers: Better top-line growth supported by stores expansion Among the fast-moving consumer goods (FMCG) retailers, minimarket operators saw topline growth of around 20% YoY in FY14, while the bigger-box retailers—the hypermarkets—saw slightly lower growth of around 15% YoY. Overall, their top line grew faster than that of the fashion retailers, which, in our view, was due to the staple nature of their products and the faster expansion (stores roll-out) as these modern retailers entered new markets. While gross and operating margins relatively held up, we believe financing cost pressure (to support expansion) led to a slight decline in net profit growth YoY. Figure 10: FMCG retailers—FY14 and quarterly results* (Rp bn)
12M13 12M14
Revenue COGS Gross profit Opex Operating profit Net profit
64,976 52,503 12,474 10,698 1,776 1,251
Margins: Gross profit Operating profit Net profit
19.2% 19.6% 2.7% 2.5% 1.9% 1.6%
76,602 61,612 14,990 13,055 1,935 1,220
YoY
4Q13
1Q14
2Q14
3Q14
4Q14
QoQ
YoY
17.9% 17,656 17,067 18,659 20,524 20,352 -0.8% 17.3% 14,097 13,751 15,138 16,566 16,157 -2.5% 20.2% 3,559 3,316 3,522 3,958 4,195 6.0% 22.0% 2,926 3,146 3,250 3,433 3,226 -6.0% 9.0% 633 170 272 526 969 84.3% -2.5% 454 139 238 367 476 29.6%
15.3% 14.6% 17.9% 10.3% 53.0% 4.9%
bps chg bps chg bps chg 37 20.2% 19.4% 18.9% 19.3% 20.6% 133 45 (21) 3.6% 1.0% 1.5% 2.6% 4.8% 220 117 (33) 2.6% 0.8% 1.3% 1.8% 2.3% 55 (23)
*data based on MPPA, HERO, AMRT, MIDI, MDRN, and RANC Source: Company data
Figure 11: Lower same-store sales in 4Q could be temporary impact of Nov-14 fuel hike SSSG*
3M14
6M14
9M14
FY14
4Q14
MPPA AMRT
10.2% 9.6%
9.2% 7.4%
6.7% 6.5%
5.4% 6.2%
1.0% 5.0%
*FMCG retailers that reported SSSG data. Source: Company data, Credit Suisse estimates
Electronics (gadget) retailers/distributors: Top-line growth from ASP adjustments We suspect that top-line growth for electronics came from weak rupiah adjustment to ASP, rather than volumes. Handset distributors' top line grew ~15% YoY, in line with the rupiah depreciation. They saw higher opex from retail store expansions and working capital financing hurt bottom line.
Indonesia Retail Sector
5
08 April 2015
Figure 12: Electronic retailers and distributors—FY14 and quarterly results* (Rp bn)
12M13 12M14
Revenue COGS Gross profit Opex Operating profit Net profit
46,804 54,528 16.5% 13,831 12,639 13,141 13,423 15,326 14.2% 10.8% 42,230 49,396 17.0% 12,592 11,422 11,903 12,156 13,915 14.5% 10.5% 4,574 5,132 12.2% 1,239 1,216 1,238 1,267 1,411 11.3% 13.8% 2,201 2,740 24.5% 577 588 605 701 846 20.7% 46.6% 2,373 2,391 0.8% 662 628 633 566 564 -0.3% -14.8% 1,558 1,232 -20.9% 472 321 355 244 312 28.2% -33.8%
Margins: Gross profit Operating profit Net profit
9.8% 5.1% 3.3%
9.4% 4.4% 2.3%
YoY
bps chg (36) (68) (107)
4Q13
9.0% 4.8% 3.4%
1Q14
9.6% 5.0% 2.5%
2Q14
9.4% 4.8% 2.7%
3Q14
9.4% 4.2% 1.8%
4Q14
QoQ
YoY
9.2% 3.7% 2.0%
bps chg bps chg (23) 24 (53) (110) 22 (137)
*Data based on ECII, ERAA, GLOB, TRIO, TELE and MTDL Source: Company data
Figure 13: ECII saw slower electronic demand in 4Q SSG
3M14
6M14
9M14
FY14
4Q14
ECII
7.6%
7.2%
5.2%
5.1%
4.8%
Source: Company data, Credit Suisse estimates
Home-improvement retailers: Top line supported by expansion ACES saw 17% YoY FY14 top-line growth, supported by its new stores expansion (SSSG was just 3%), while other home-improvement distributors' top line grew ~10% YoY. Gross margin was lower in 4Q on both QoQ and YoY basis, indicating possible higher discounts to boost top line. Figure 14: Home-improvement retailers—FY14 and quarterly results* (Rp bn)
12M13 12M14
YoY
4Q13
1Q14
2Q14
3Q14
4Q14
Revenue COGS Gross profit Opex Operating profit Net profit
11,329 12,715 12.2% 8,356 9,358 12.0% 2,972 3,358 13.0% 2,197 2,545 15.8% 775 813 4.9% 616 686 11.4%
3,181 2,324 857 579 278 236
3,002 2,180 822 603 219 164
3,186 2,356 829 641 189 162
3,104 2,270 834 662 172 144
3,425 2,552 873 639 233 216
Margins: Gross profit Operating profit Net profit
26.2% 26.4% 6.8% 6.4% 5.4% 5.4%
QoQ
YoY
10.3% 7.6% 12.4% 9.8% 4.6% 1.8% -3.4% 10.4% 35.6% -16.1% 49.9% -8.6%
bp chg bp chg bp chg 17 26.9% 27.4% 26.0% 26.9% 25.5% (139) (146) (45) 8.7% 7.3% 5.9% 5.5% 6.8% 127 (193) (4) 7.4% 5.5% 5.1% 4.6% 6.3% 166 (112)
*data based on ACES, CSAP and KOIN Source: Company data
Figure 15: ACES saw negative same-store-sales growth in 4Q on the back of lower customer store traffic SSG
3M14
6M14
9M14
FY14
4Q14
ACES
6.0%
6.2%
4.7%
3.1%
-2.0%
Source: Company data, Credit Suisse estimates
Indonesia Retail Sector
6
08 April 2015
…but inventory is improving Indonesian retailers have notably seen a higher inventories level as a result of slower sales on the back of a slowdown in private consumption post the subsidised fuel price hike, and the rupiah collapse in June 2013. Our analysis of the 18 listed Indonesian retailers suggests that inventory turnover has showed some improvement in 4Q. This could mean a positive sign for the industry. Figure 16: Inventory turnover starts to improve YoY…
Figure 17: …across different categories…
100.0 90.0
77
Inventory days
77
Average 59 days
62 57
60.0
54
53
75 72
70
68
70.0
79
59
61
64
Inventory days
Average 78 days
80.0
200
90 80
160
70
120
60 80 50
56
40
40
50.0
30
0 4Q14
Home improvement
3Q14
Fashion
Electronics
2Q14
4Q14
3Q14
2Q14
1Q14
4Q13
3Q13
2Q13
1Q13
4Q12
3Q12
2Q12
1Q12
4Q11
3Q11
2Q11
1Q11
Aggregate
1Q14
4Q13
3Q13
2Q13
1Q13
4Q12
3Q12
2Q12
1Q12
4Q11
3Q11
2Q11
1Q11
40.0
Source: Company data, Credit Suisse estimates
Inventory days (home improvement only)
100
92
FMCG
Source: Company data, Credit Suisse estimates
Fashion retailers: Inventory days have started to come down; potentially lower store discounts ahead Inventory days of the fashion retailers have started normalising since 4Q (on average 62 days). With the old stocks out, we believe the store discounts should ease, which means likely better gross margins. Figure 18: Inventory days slightly down from last year
Figure 19: WC days slightly up because of shorter payable days 25.0
100.0
90
90.0
82 77
71
70
70.0 60.0
Average 60 days 59 55
53
55
54
64
62
61
59
62
55
Working capital days
Inventory days
80.0
20.0
Average 70 days
21
20
19 15
15.0
13
12
11
12
11
10.0
7
5.0
6 4
4
2
-
50.0
0
-2
(5.0)
40.0
4Q14
3Q14
2Q14
1Q14
4Q13
3Q13
2Q13
1Q13
4Q12
3Q12
2Q12
1Q12
4Q11
3Q11
2Q11
1Q11
4Q14
3Q14
2Q14
1Q14
Indonesia Retail Sector
4Q13
3Q13
2Q13
1Q13
4Q12
3Q12
2Q12
1Q12
4Q11
3Q11
2Q11
1Q11
Source: Company data, Credit Suisse estimates
Source: Company data, Credit Suisse estimates
7
08 April 2015
FMCG retailers: Inventory days higher due to expansion that supports top-line growth FMCG retailers saw a higher inventory days trend. We believe this is due to new stores expansion, especially to new markets outside the Java region. The expansion generally helps top-line growth; thus we don’t see it as a threat. Figure 20: Inventory days up because of expansion
Figure 21: Working capital days up because of inventory 30.0
85.0 80.0
20.0
52
52
54
56
11
10.0 5.0
5
4
4
10
5
0 (5.0)
40.0
(10.0)
4Q14
3Q14
2Q14
1Q14
4Q13
3Q13
4Q12
3Q12
2Q12
1Q12
4Q11
3Q11
2Q11
Source: Company data, Credit Suisse estimates
-4
1Q11
4Q14
3Q14
2Q14
1Q14
4Q13
3Q13
2Q13
1Q13
4Q12
3Q12
2Q12
1Q12
4Q11
3Q11
2Q11
8
0
45.0
1Q11
9
18
16 17
-
48
48
47
52
15.0
2Q13
60.0
17
1Q13
60
60
55.0
66
64 64
Average 52 days
65.0
67
Working capital days
71
70.0
Inventory days
25.0
Average 67 days
75.0
50.0
25
79
Source: Company data, Credit Suisse estimates
Electronics (including gadgets) retailers/distributors: Improved inventory days at the handset players We believe electronic retailers such as ECII and handset distributors (ERAA, TRIO, and TELE) are removing old stocks and preparing for new product launches, which generally come in 1Q-2Q15. These retailers are negatively affected by the rupiah depreciation. Figure 22: Inventory days are significantly down in 4Q…
Figure 23: …and lower working capital days too 120.0
90.0 Average 64 days 75 76
80.0
Inventory days
42
Average 44 days 46 45 46 47
46 35
40.0
30
30.0
80.0
74
90
84
78
69
74
70 72 72
4Q12
52
50.0
56
97 100
92
3Q12
54
Working capital days
70.0 60.0
100.0
66 66 68
64
94 86
85
60.0 40.0
20.0
20.0 10.0
-
-
4Q14
3Q14
2Q14
1Q14
4Q13
3Q13
2Q13
1Q13
2Q12
1Q12
4Q11
3Q11
2Q11
1Q11
4Q14
3Q14
2Q14
1Q14
4Q13
3Q13
2Q13
1Q13
4Q12
3Q12
2Q12
1Q12
4Q11
3Q11
2Q11
1Q11
Source: Company data, Credit Suisse estimates
Source: Company data, Credit Suisse estimates
Home-improvement retailers: Improvement seen in inventory days ACES, the biggest home improvement retailer proxy, saw negative SSSG in 4Q into January and February 2015. Inventory days have shown improvement but they are still high at 170 days. Given 80% of the products are imported, we see continued risk to gross margins.
Indonesia Retail Sector
8
08 April 2015
Figure 24: Inventory days start to show improvement
Figure 25: WC days flat as payable days are shorter 200
250.0 Average 170 days
Inventory days
200.0
150.0 107 100.0 62 50.0
73
82
137
126
Average 85 days
102
90
153
160 173
Working capital days
199 194 186 192
185
180
112
73
46
155
140 115
120 100
20
20
99
68 54
54
60
113 93
87 71
80
40
-
177
162
31
0
4Q14
3Q14
2Q14
1Q14
4Q13
3Q13
2Q13
1Q13
4Q12
3Q12
2Q12
1Q12
4Q11
3Q11
2Q11
1Q11
4Q14
3Q14
2Q14
1Q14
Indonesia Retail Sector
4Q13
3Q13
2Q13
1Q13
4Q12
3Q12
2Q12
1Q12
4Q11
3Q11
2Q11
1Q11
Source: Company data, Credit Suisse estimates
Source: Company data, Credit Suisse estimates
9
08 April 2015
Appendix I: Monthly productivity analysis Figure 26: ACES—inventory days have started trending down; efficiency came from better employee productivity in 4Q (Rp mn/sqm)
1Q13
2Q13
3Q13
4Q13
1Q14
2Q14
3Q14
4Q14 QoQ% YoY%
Revenue Gross profit Operating profit Opex Area/employee Working capital: A/R days A/P days Inventory days WC days
1.265 0.608 0.157 0.452 23
1.231 0.594 0.147 0.448 24
1.303 0.658 0.189 0.469 25
1.339 0.685 0.244 0.441 25
1.248 0.616 0.188 0.428 25
1.216 0.584 0.147 0.438 25
1.301 0.620 0.166 0.454 26
1.254 0.605 0.218 0.387 27
6 13 110 103
4 15 123 111
2 26 150 126
2 36 207 173
4 35 214 183
1 14 223 210
1 17 216 201
2 17 201 186
-4% -2% 31% -15% 5%
-6% -12% -11% -12% 6%
Source: Company data, Credit Suisse estimates
Figure 27: MAPI—inventory days started trending down, following significant stores discounts; margins improvement to follow (Rp mn/sqm)
1Q13
2Q13
3Q13
4Q13
1Q14
2Q14
3Q14
4Q14 QoQ% YoY%
Revenue Gross profit Operating profit Opex Area/employee Working capital: A/R days A/P days Inventory days WC days
1.219 0.595 0.071 0.524 31
1.237 0.630 0.104 0.526 32
1.358 0.659 0.108 0.551 32
1.443 0.733 0.120 0.613 31
1.369 0.637 0.063 0.574 28
1.402 0.676 0.085 0.591 28
1.588 0.682 0.032 0.650 29
1.573 0.749 0.083 0.665 29
13 67 176 123
13 72 192 134
11 93 212 130
11 90 220 141
14 77 211 147
12 80 213 145
11 64 188 135
11 66 184 129
-1% 10% 158% 2% 0%
9% 2% -31% 9% -9%
Source: Company data, Credit Suisse estimates
Figure 28: LPPF continues to see better stores productivity (Rp mn/sqm)
1Q13
2Q13
3Q13
4Q13
1Q14
2Q14
3Q14
4Q14 QoQ% YoY%
Revenue Gross profit Operating profit Opex Area/employee Working capital: A/R days A/P days Inventory days WC days
0.559 0.354 0.094 0.260 59
0.643 0.420 0.155 0.265 59
1.026 0.659 0.354 0.306 58
0.679 0.445 0.164 0.281 59
0.611 0.382 0.109 0.273 66
0.740 0.474 0.178 0.296 67
1.094 0.693 0.371 0.322 67
0.736 0.477 0.189 0.288 68
3 45 31 (11)
3 74 51 (20)
1 31 28 (2)
1 55 31 (23)
3 45 37 (6)
1 76 58 (16)
1 31 32 1
1 55 37 (16)
-33% -31% -49% -11% 1%
8% 7% 15% 2% 15%
Source: Company data, Credit Suisse estimates
Indonesia Retail Sector
10
08 April 2015
Figure 29: MPPA—operating efficiency led to improved margins (Rp mn/sqm)
1Q13
2Q13
3Q13
4Q13
1Q14
2Q14
3Q14
4Q14 QoQ% YoY%
Revenue Gross profit Operating profit Opex Area/employee Working capital: A/R days A/P days Inventory days WC days
1.615 0.256 0.025 0.232 47
1.641 0.253 0.033 0.220 48
1.754 0.276 0.076 0.200 52
1.647 0.269 0.078 0.192 52
1.608 0.272 0.042 0.230 48
1.668 0.280 0.056 0.225 47
1.827 0.321 0.098 0.223 49
1.683 0.301 0.124 0.177 51
2 66 73 10
2 69 88 21
1 54 78 26
1 72 83 11
3 69 87 21
1 80 101 21
1 51 85 34
1 62 86 26
-8% -6% 26% -20% 3%
2% 12% 59% -7% -1%
Source: Company data, Credit Suisse estimates
Figure 30: RALS—stable 4Q situation from last year (Rp mn/sqm)
1Q13
2Q13
3Q13
4Q13
1Q14
2Q14
3Q14
Revenue Gross profit Operating profit Opex Area/employee Working capital: A/R days A/P days Inventory days WC days
0.370 0.135 0.011 0.124 56
0.471 0.158 0.021 0.138 45
0.732 0.431 0.277 0.144 0.102 (0.001) 0.176 0.144 59 70
0.395 0.136 0.011 0.126 67
0.491 0.166 0.014 0.152 67
0.659 0.416 0.252 0.131 0.086 (0.013) 0.166 0.144 70 78
1 102 126 25
1 120 149 30
2 92 123 33
2 114 148 36
2 66 73 9
1 85 82 (1)
2 64 67 5
4Q14 QoQ% YoY% -37% -48% n.m. -13% 12%
-3% -9% n.m. -1% 11%
1 85 77 (6)
Source: Company data, Credit Suisse estimates
Figure 31: ECII—inventory days improving; newer stores still yet to improve stores productivity (Rp mn/sqm)
1Q13
2Q13
3Q13
4Q13
1Q14
2Q14
3Q14
4Q14 QoQ% YoY%
Revenue Gross profit Operating profit Opex Working capital: A/R days A/P days Inventory days WC days
4.289 0.802 0.406 0.397
5.480 1.101 0.566 0.535
3.670 0.689 0.144 0.544
4.292 0.948 0.511 0.437
2.518 0.480 0.115 0.365
2.839 0.567 0.105 0.462
2.537 0.478 0.096 0.382
3.378 0.646 0.183 0.463
3 39 52 16
4 46 66 24
3 58 83 28
1 51 101 52
4 26 96 73
3 20 90 73
2 11 84 75
1 20 74 55
33% 35% 90% 21%
-21% -32% -64% 6%
Source: Company data, Credit Suisse estimates
Indonesia Retail Sector
11
08 April 2015
Companies Mentioned (Price as of 07-Apr-2015) Ace Hardware Indonesia (ACES.JK, Rp715) Catur Sentosa (CSAP.JK, Rp585) Electronic City (ECII.JK, Rp1,375) Erajaya Swasembada (ERAA.JK, Rp905) Global Teleshop (GLOB.JK, Rp1,195) Hero Supermarket (HERO.JK, Rp2,000) Kokoh Inti (KOIN.JK, Rp350) Matahari Department Store (LPPF.JK, Rp19,400, OUTPERFORM, TP Rp19,400) Matahari Putra Prima (MPPA.JK, Rp4,150, OUTPERFORM[V], TP Rp4,700) Metrodata Elec (MTDL.JK, Rp700) Midi Utama ID (MIDI.JK, Rp770) Mitra Adiperkasa (MAPI.JK, Rp6,000, OUTPERFORM[V], TP Rp6,500) Ramayana Lestari Sentosa (RALS.JK, Rp770) Sepatu Bata (BATA.JK, Rp1,080) Sumber Alfaria (AMRT.JK, Rp565) Supra Boga (RANC.JK, Rp414) Tiphone Mobile (TELE.JK, Rp950) Trikomsel Oke (TRIO.JK, Rp1,905)
Disclosure Appendix Important Global Disclosures I, Priscilla Tjitra, certify that (1) the views expressed in this report accurately reflect my personal views about all of the subject companies and securities and (2) no part of my compensation was, is or will be directly or indirectly related to the specific recommendations or views expressed in this report. 3-Year Price and Rating History for Matahari Department Store (LPPF.JK) LPPF.JK Date 11-Dec-13 17-Feb-14 04-Aug-14 18-Sep-14 29-Oct-14
Closing Price (Rp) 10,850 13,575 14,750 16,700 15,150
Target Price (Rp) 10,000 16,800 17,700 19,900 19,400
Rating N* O
* Asterisk signifies initiation or assumption of coverage.
N EU T RA L O U T PERFO RM
3-Year Price and Rating History for Matahari Putra Prima (MPPA.JK) MPPA.JK Date 27-May-14 05-Mar-15
Closing Price (Rp) 2,840 4,065
Target Price (Rp) 3,600 4,700
Rating O*
* Asterisk signifies initiation or assumption of coverage.
O U T PERFO RM
Indonesia Retail Sector
12
08 April 2015
3-Year Price and Rating History for Mitra Adiperkasa (MAPI.JK) MAPI.JK Date 01-May-12 01-Nov-12 27-Mar-13 24-Sep-13 12-Dec-13 19-May-14 04-Aug-14 03-Nov-14 01-Apr-15
Closing Price (Rp) 6,900 6,400 8,350 6,350 5,550 5,350 5,125 5,175 5,900
Target Price (Rp) 8,400 8,100 8,100 7,300 4,900 4,500 4,100 3,400 6,500
* Asterisk signifies initiation or assumption of coverage.
Rating O N * U
O O U T PERFO RM N EU T RA L U N D ERPERFO RM
The analyst(s) responsible for preparing this research report received Compensation that is based upon various factors including Credit Suisse's total revenues, a portion of which are generated by Credit Suisse's investment banking activities
As of December 10, 2012 Analysts’ stock rating are defined as follows: Outperform (O) : The stock’s total return is expected to outperform the relevant benchmark*over the next 12 months. Neutral (N) : The stock’s total return is expected to be in line with the relevant benchmark* over the next 12 months. Underperform (U) : The stock’s total return is expected to underperform the relevant benchmark* over the next 12 months. *Relevant benchmark by region: As of 10th December 2012, Japanese ratings are based on a stock’s total return relative to the analyst's coverage universe which consists of all companies covered by the analyst within the relevant sector, with Outperforms representing the most attractive, Neutrals the less attractive, and Underperforms the least attractive investment opportunities. As of 2nd October 2012, U.S. and Canadian as well as European ra tings are based on a stock’s total return relative to the analyst's coverage universe which consists of all companies covered by the analyst within the relevant sector, with Outperforms representing the most attractive, Neutrals the less attractive, and Underperforms the least attractive investment opportunities. For Latin American and non-Japan Asia stocks, ratings are based on a stock’s total return relative to the average total return of the relevant country or regional benchmark; prior to 2nd October 2012 U.S. and Canadian ratings were based on (1) a stock’s absolute total return potential to its current share price and (2) the relative attractiv eness of a stock’s total return potential within an analyst’s coverage universe. For Australian and New Zealand stocks, 12-month rolling yield is incorporated in the absolute total return calculation and a 15% and a 7.5% threshold replace the 10-15% level in the Outperform and Underperform stock rating definitions, respectively. The 15% and 7.5% thresholds replace the +1015% and -10-15% levels in the Neutral stock rating definition, respectively. Prior to 10th December 2012, Japanese ratings were based on a stock’s total return relative to the average total return of the relevant country or regional benchmark.
Restricted (R) : In certain circumstances, Credit Suisse policy and/or applicable law and regulations preclude certain types of communications, including an investment recommendation, during the course of Credit Suisse's engagement in an investment banking transaction and in certain other circumstances. Volatility Indicator [V] : A stock is defined as volatile if the stock price has moved up or down by 20% or more in a month in at least 8 of the past 24 months or the analyst expects significant volatility going forward. Analysts’ sector weightings are distinct from analysts’ stock ratings and are based on the analyst’s expectations for the fundamentals and/or valuation of the sector* relative to the group’s historic fundamentals and/or valuation: Overweight : The analyst’s expectation for the sector’s fundamentals and/or valuation is favorable over the next 12 months. Market Weight : The analyst’s expectation for the sector’s fundamentals and/or valuation is neutral over the next 12 months. Underweight : The analyst’s expectation for the sector’s fundamentals and/or valuation is cautious over the next 12 months. *An analyst’s coverage sector consists of all companies covered by the analyst within the relevant sector. An analyst may cov er multiple sectors.
Credit Suisse's distribution of stock ratings (and banking clients) is: Global Ratings Distribution
Rating
Versus universe (%)
Of which banking clients (%)
Outperform/Buy* 44% (53% banking clients) Neutral/Hold* 38% (50% banking clients) Underperform/Sell* 16% (43% banking clients) Restricted 3% *For purposes of the NYSE and NASD ratings distribution disclosure requirements, our stock ratings of Outperform, Neutral, an d Underperform most closely correspond to Buy, Hold, and Sell, respectively; however, the meanings are not the same, as our stock ratings are determined on a relative basis. (Please refer to definitions above.) An investor's decision to buy or sell a security should be based on investment objectives, current holdin gs, and other individual factors.
Indonesia Retail Sector
13
08 April 2015
Credit Suisse’s policy is to update research reports as it deems appropriate, based on developments with the subject company, the sector or the market that may have a material impact on the research views or opinions stated herein. Credit Suisse's policy is only to publish investment research that is impartial, independent, clear, fair and not misleading. For more detail please refer to Credit Suisse's Policies for Managing Conflicts of Interest in connection with Investment Research: http://www.csfb.com/research-andanalytics/disclaimer/managing_conflicts_disclaimer.html Credit Suisse does not provide any tax advice. Any statement herein regarding any US federal tax is not intended or written to be used, and cannot be used, by any taxpayer for the purposes of avoiding any penalties. Price Target: (12 months) for Matahari Department Store (LPPF.JK) Method: Our target price of Rp19,400 for Matahari Department Store is based on a DCF (discounted cash flow) valuation. We assume 13.0% WACC (weighted average cost of capital; 8% risk-free rate, 1.0x beta, and 5% risk premium). The implied multiples are 29x FY15E price to earnings ratio (P/E). Risk:
Key risks to our Rp19,400 target price for Matahari Department Store include competition from both existing and incoming players, risk of meeting expansion target, regulatory risks and macro risks of Indonesia.
Price Target: (12 months) for Mitra Adiperkasa (MAPI.JK) Method: Our target price of Rp6,500 for Mitra Adiperkasa is based on DCF valuations. We assume 10.1% WACC (8% risk-free rate, 0.9x beta, and 5% risk premium). The implied multiples are 28.0x FY16E price to earnings ratio (P/E). Risk:
Key risks to our Rp6,500 target price for Mitra Adiperkasa include principal risks, forced into cannibalisation by the property boom, competition from both existing and new players, regulatory risks, and macro risks.
Price Target: (12 months) for Matahari Putra Prima (MPPA.JK) Method: Our end 2015 target price of Rp4,700 for MPPA is based on a DCF (discounted cash flow) valuation. We assume a 12% WACC (weighted average cost of capital; 8% risk-free rate, 0.8 beta, and 5% risk premium). This implies a 2.2x PEG, a premium to regional average as it generates higher earnings CAGR compared to regional peers. Risk:
Key risks to our Rp4,700 target price include: (1) execution of planned store expansion, (2) entrance to a new region, (3) rising salary and wages, (4) rising rental prices, (4) competition with the industry and from other modern retail formats, (5) regulatory risk, and (6) Indonesia macroeconomic stability risk.
Please refer to the firm's disclosure website at https://rave.credit-suisse.com/disclosures for the definitions of abbreviations typically used in the target price method and risk sections. See the Companies Mentioned section for full company names
The subject company (MAPI.JK, ERAA.JK) currently is, or was during the 12-month period preceding the date of distribution of this report, a client of Credit Suisse. Credit Suisse expects to receive or intends to seek investment banking related compensation from the subject company (MAPI.JK, ERAA.JK) within the next 3 months. Credit Suisse may have interest in (LPPF.JK, MAPI.JK, MPPA.JK, ACES.JK, ECII.JK, ERAA.JK, RALS.JK) As of the end of the preceding month, Credit Suisse beneficially own 1% or more of a class of common equity securities of (ECII.JK). For other important disclosures concerning companies featured in this report, including price charts, please visit the website at https://rave.creditsuisse.com/disclosures or call +1 (877) 291-2683.
Important Regional Disclosures Singapore recipients should contact Credit Suisse AG, Singapore Branch for any matters arising from this research report. The analyst(s) involved in the preparation of this report have not visited the material operations of the subject company (LPPF.JK, MAPI.JK, MPPA.JK, ACES.JK, ECII.JK, ERAA.JK, RALS.JK) within the past 12 months Restrictions on certain Canadian securities are indicated by the following abbreviations: NVS--Non-Voting shares; RVS--Restricted Voting Shares; SVS--Subordinate Voting Shares. Individuals receiving this report from a Canadian investment dealer that is not affiliated with Credit Suisse should be advised that this report may not contain regulatory disclosures the non-affiliated Canadian investment dealer would be required to make if this were its own report. For Credit Suisse Securities (Canada), Inc.'s policies and procedures regarding the dissemination of equity research, please visit http://www.csfb.com/legal_terms/canada_research_policy.shtml.
Indonesia Retail Sector
14
08 April 2015
Credit Suisse has acted as lead manager or syndicate member in a public offering of securities for the subject company (ECII.JK) within the past 3 years. As of the date of this report, Credit Suisse acts as a market maker or liquidity provider in the equities securities that are the subject of this report. Principal is not guaranteed in the case of equities because equity prices are variable. Commission is the commission rate or the amount agreed with a customer when setting up an account or at any time after that. To the extent this is a report authored in whole or in part by a non-U.S. analyst and is made available in the U.S., the following are important disclosures regarding any non-U.S. analyst contributors: The non-U.S. research analysts listed below (if any) are not registered/qualified as research analysts with FINRA. The non-U.S. research analysts listed below may not be associated persons of CSSU and therefore may not be subject to the NASD Rule 2711 and NYSE Rule 472 restrictions on communications with a subject company, public appearances and trading securities held by a research analyst account. PT Credit Suisse Securities Indonesia .................................................................................................................................................Priscilla Tjitra For Credit Suisse disclosure information on other companies mentioned in this report, please visit the website at https://rave.creditsuisse.com/disclosures or call +1 (877) 291-2683.
Indonesia Retail Sector
15
08 April 2015
References in this report to Credit Suisse include all of the subsidiaries and affiliates of Credit Suisse operating under its investment banking division. For more information on our structure, please use the following link: https://www.credit-suisse.com/who_we_are/en/This report may contain material that is not directed to, or intended for distribution to or use by, any person or entity who is a citizen or resident of or located in any locality, state, country or other jurisdiction where such distribution, publication, availability or use would be contrary to law or regulation or which would subject Credit Suisse AG or its affiliates ("CS") to any registration or licensing requirement within such jurisdiction. All material presented in this report, unless specifically indicated otherwise, is under copyright to CS. None of the material, nor its content, nor any copy of it, may be altered in any way, transmitted to, copied or distributed to any other party, without the prior express written permission of CS. All trademarks, service marks and logos used in this report are trademarks or service marks or registered trademarks or service marks of CS or its affiliates. The information, tools and material presented in this report are provided to you for information purposes only and are not to be used or considered as an offer or the solicitation of an offer to sell or to buy or subscribe for securities or other financial instruments. CS may not have taken any steps to ensure that the securities referred to in this report are suitable for any particular investor. CS will not treat recipients of this report as its customers by virtue of their receiving this report. The investments and services contained or referred to in this report may not be suitable for you and it is recommended that you consult an independent investment advisor if you are in doubt about such investments or investment services. Nothing in this report constitutes investment, legal, accounting or tax advice, or a representation that any investment or strategy is suitable or appropriate to your individual circumstances, or otherwise constitutes a personal recommendation to you. CS does not advise on the tax consequences of investments and you are advised to contact an independent tax adviser. Please note in particular that the bases and levels of taxation may change. Information and opinions presented in this report have been obtained or derived from sources believed by CS to be reliable, but CS makes no representation as to their accuracy or completeness. CS accepts no liability for loss arising from the use of the material presented in this report, except that this exclusion of liability does not apply to the extent that such liability arises under specific statutes or regulations applicable to CS. This report is not to be relied upon in substitution for the exercise of independent judgment. CS may have issued, and may in the future issue, other communications that are inconsistent with, and reach different conclusions from, the information presented in this report. Those communications reflect the different assumptions, views and analytical methods of the analysts who prepared them and CS is under no obligation to ensure that such other communications are brought to the attention of any recipient of this report. Some investments referred to in this report will be offered solely by a single entity and in the case of some investments solely by CS, or an associate of CS or CS may be the only market maker in such investments. Past performance should not be taken as an indication or guarantee of future performance, and no representation or warranty, express or implied, is made regarding future performance. Information, opinions and estimates contained in this report reflect a judgment at its original date of publication by CS and are subject to change without notice. The price, value of and income from any of the securities or financial instruments mentioned in this report can fall as well as rise. The value of securities and financial instruments is subject to exchange rate fluctuation that may have a positive or adverse effect on the price or income of such securities or financial instruments. Investors in securities such as ADR's, the values of which are influenced by currency volatility, effectively assume this risk. Structured securities are complex instruments, typically involve a high degree of risk and are intended for sale only to sophisticated investors who are capable of understanding and assuming the risks involved. The market value of any structured security may be affected by changes in economic, financial and political factors (including, but not limited to, spot and forward interest and exchange rates), time to maturity, market conditions and volatility, and the credit quality of any issuer or reference issuer. Any investor interested in purchasing a structured product should conduct their own investigation and analysis of the product and consult with their own professional advisers as to the risks involved in making such a purchase. Some investments discussed in this report may have a high level of volatility. High volatility investments may experience sudden and large falls in their value causing losses when that investment is realised. Those losses may equal your original investment. Indeed, in the case of some investments the potential losses may exceed the amount of initial investment and, in such circumstances, you may be required to pay more money to support those losses. Income yields from investments may fluctuate and, in consequence, initial capital paid to make the investment may be used as part of that income yield. Some investments may not be readily realisable and it may be difficult to sell or realise those investments, similarly it may prove difficult for you to obtain reliable information about the value, or risks, to which such an investment is exposed. This report may provide the addresses of, or contain hyperlinks to, websites. Except to the extent to which the report refers to website material of CS, CS has not reviewed any such site and takes no responsibility for the content contained therein. Such address or hyperlink (including addresses or hyperlinks to CS's own website material) is provided solely for your convenience and information and the content of any such website does not in any way form part of this document. Accessing such website or following such link through this report or CS's website shall be at your own risk. This report is issued and distributed in Europe (except Switzerland) by Credit Suisse Securities (Europe) Limited, One Cabot Square, London E14 4QJ, England, which is authorised by the Prudential Regulation Authority and regulated by the Financial Conduct Authority and the Prudential Regulation Authority. This report is being distributed in Germany by Credit Suisse Securities (Europe) Limited Niederlassung Frankfurt am Main regulated by the Bundesanstalt fuer Finanzdienstleistungsaufsicht ("BaFin"). This report is being distributed in the United States and Canada by Credit Suisse Securities (USA) LLC; in Switzerland by Credit Suisse AG; in Brazil by Banco de Investimentos Credit Suisse (Brasil) S.A or its affiliates; in Mexico by Banco Credit Suisse (México), S.A. (transactions related to the securities mentioned in this report will only be effected in compliance with applicable regulation); in Japan by Credit Suisse Securities (Japan) Limited, Financial Instruments Firm, Director-General of Kanto Local Finance Bureau (Kinsho) No. 66, a member of Japan Securities Dealers Association, The Financial Futures Association of Japan, Japan Investment Advisers Association, Type II Financial Instruments Firms Association; elsewhere in Asia/ Pacific by whichever of the following is the appropriately authorised entity in the relevant jurisdiction: Credit Suisse (Hong Kong) Limited, Credit Suisse Equities (Australia) Limited, Credit Suisse Securities (Thailand) Limited, regulated by the Office of the Securities and Exchange Commission, Thailand, having registered address at 990 Abdulrahim Place, 27th Floor, Unit 2701, Rama IV Road, Silom, Bangrak, Bangkok 10500, Thailand, Tel. +66 2614 6000, Credit Suisse Securities (Malaysia) Sdn Bhd, Credit Suisse AG, Singapore Branch, Credit Suisse Securities (India) Private Limited (CIN no. U67120MH1996PTC104392) regulated by the Securities and Exchange Board of India (registration Nos. INB230970637; INF230970637; INB010970631; INF010970631), having registered address at 9th Floor, Ceejay House, Dr.A.B. Road, Worli, Mumbai - 18, India, T- +91-22 6777 3777, Credit Suisse Securities (Europe) Limited, Seoul Branch, Credit Suisse AG, Taipei Securities Branch, PT Credit Suisse Securities Indonesia, Credit Suisse Securities (Philippines ) Inc., and elsewhere in the world by the relevant authorised affiliate of the above. Research on Taiwanese securities produced by Credit Suisse AG, Taipei Securities Branch has been prepared by a registered Senior Business Person. Research provided to residents of Malaysia is authorised by the Head of Research for Credit Suisse Securities (Malaysia) Sdn Bhd, to whom they should direct any queries on +603 2723 2020. This report has been prepared and issued for distribution in Singapore to institutional investors, accredited investors and expert investors (each as defined under the Financial Advisers Regulations) only, and is also distributed by Credit Suisse AG, Singapore branch to overseas investors (as defined under the Financial Advisers Regulations). By virtue of your status as an institutional investor, accredited investor, expert investor or overseas investor, Credit Suisse AG, Singapore branch is exempted from complying with certain compliance requirements under the Financial Advisers Act, Chapter 110 of Singapore (the "FAA"), the Financial Advisers Regulations and the relevant Notices and Guidelines issued thereunder, in respect of any financial advisory service which Credit Suisse AG, Singapore branch may provide to you. This information is being distributed by Credit Suisse AG, Dubai Branch, duly licensed and regulated by the Dubai Financial Services Authority (DFSA), and is directed at Professional Clients or Market Counterparties only, as defined by the DFSA. The financial products or financial services to which the information relates will only be made available to a client who meets the regulatory criteria to be a Professional Client or Market Counterparty only, as defined by the DFSA, and is not intended for any other person. This research may not conform to Canadian disclosure requirements. In jurisdictions where CS is not already registered or licensed to trade in securities, transactions will only be effected in accordance with applicable securities legislation, which will vary from jurisdiction to jurisdiction and may require that the trade be made in accordance with applicable exemptions from registration or licensing requirements. Non-U.S. customers wishing to effect a transaction should contact a CS entity in their local jurisdiction unless governing law permits otherwise. U.S. customers wishing to effect a transaction should do so only by contacting a representative at Credit Suisse Securities (USA) LLC in the U.S. Please note that this research was originally prepared and issued by CS for distribution to their market professional and institutional investor customers. Recipients who are not market professional or institutional investor customers of CS should seek the advice of their independent financial advisor prior to taking any investment decision based on this report or for any necessary explanation of its contents. This research may relate to investments or services of a person outside of the UK or to other matters which are not authorised by the Prudential Regulation Authority and regulated by the Financial Conduct Authority and the Prudential Regulation Authority or in respect of which the protections of the Prudential Regulation Authority and Financial Conduct Authority for private customers and/or the UK compensation scheme may not be available, and further details as to where this may be the case are available upon request in respect of this report. CS may provide various services to US municipal entities or obligated persons ("municipalities"), including suggesting individual transactions or trades and entering into such transactions. Any services CS provides to municipalities are not viewed as "advice" within the meaning of Section 975 of the Dodd-Frank Wall Street Reform and Consumer Protection Act. CS is providing any such services and related information solely on an arm's length basis and not as an advisor or fiduciary to the municipality. In connection with the provision of the any such services, there is no agreement, direct or indirect, between any municipality (including the officials, management, employees or agents thereof) and CS for CS to provide advice to the municipality. Municipalities should consult with their financial, accounting and legal advisors regarding any such services provided by CS. In addition, CS is not acting for direct or indirect compensation to solicit the municipality on behalf of an unaffiliated broker, dealer, municipal securities dealer, municipal advisor, or investment adviser for the purpose of obtaining or retaining an engagement by the municipality for or in connection with Municipal Financial Products, the issuance of municipal securities, or of an investment adviser to provide investment advisory services to or on behalf of the municipality. If this report is being distributed by a financial institution other than Credit Suisse AG, or its affiliates, that financial institution is solely responsible for distribution. Clients of that institution should contact that institution to effect a transaction in the securities mentioned in this report or require further information. This report does not constitute investment advice by Credit Suisse to the clients of the distributing financial institution, and neither Credit Suisse AG, its affiliates, and their respective officers, directors and employees accept any liability whatsoever for any direct or consequential loss arising from their use of this report or its content. Principal is not guaranteed. Commission is the commission rate or the amount agreed with a customer when setting up an account or at any time after that. Copyright © 2015 CREDIT SUISSE AG and/or its affiliates. All rights reserved.
Investment principal on bonds can be eroded depending on sale price or market price. In addition, there are bonds on which investment principal can be eroded due to changes in redemption amounts. Care is required when investing in such instruments. When you purchase non-listed Japanese fixed income securities (Japanese government bonds, Japanese municipal bonds, Japanese government guaranteed bonds, Japanese corporate bonds) from CS as a seller, you will be requested to pay the purchase price only.
CS0799
Indonesia Retail Sector
16