Office of the Controller – Office of Economic Analysis
City and County of San Francisco
Increasing the Minimum Wage: Economic Impact Report Office of Economic Analysis Item #140687 July 17th, 2014
Office of the Controller – Office of Economic Analysis
City and County of San Francisco
Introduction
• • • •
The proposed legislation would raise the minimum wage that employers within San Francisco would be required to pay to employees. The current minimum wage in the city is $10.74 per hour. The wage is now indexed to inflation. The legislation would raise the minimum wage, in increments, to $15.00 per hour by July 1, 2018. Beginning on July 1, 2019, the minimum wage would be indexed to inflation.
2
Office of the Controller – Office of Economic Analysis
City and County of San Francisco
Proposed Minimum Wage Progression Date
Minimum Wage Under the Proposal
May 1, 2015
$12.25
July 1, 2016
$13.00
July 1, 2017
$14.00
July 1, 2018
$15.00
July 1, 2019 and thereafter
$15.00 + CPI increase
3
Office of the Controller – Office of Economic Analysis
City and County of San Francisco
Additional Provisions
•
The legislation establishes a category of "Government Supported Employees", who would have a lower minimum wage. These employees include: – –
–
•
•
Youth under 18 who are employed in a subsidized employment program. Adults over 55 who are employed in a subsidized employment program by a non-profit organization that provides social services to adults over 55. Only a portion of employees in this category who are hired after January 1, 2015 would be eligible for the reduced minimum wage. The minimum wage for Government Supported Employees would begin to increase by CPI as of July 1, 2016, two years earlier than other employees.
The minimum wage would apply to those employed through the San Francisco In-Home Supportive Services (IHSS) Authority, a public authority that distributes City, State, and Federal funds to provide home care for seniors and the disabled. As the City directly and indirectly pays the salary of workers whose pay would be raised by this ordinance, it would have an impact on the City's General Fund. The Controller's Office has estimated this impact at $12.8 million in FY 2015-16, rising to $56.3 million in FY 2018-19.
4
Office of the Controller – Office of Economic Analysis
City and County of San Francisco
Background: San Francisco's Minimum Wage History
• • • • •
San Francisco was the first city in the country to establish its own minimum wage, when the voters approved Proposition L in November 2003. The minimum wage was set at $8.50 for 2004, with a one-year delay for small businesses and non-profits. At the time, this was the highest minimum wage in the country. The legislation also called for annual increases in line with the San Francisco Bay Area's inflation rate. The City's current minimum wage, $10.74 for 2014, remains the highest in the nation.
5
Office of the Controller – Office of Economic Analysis
City and County of San Francisco
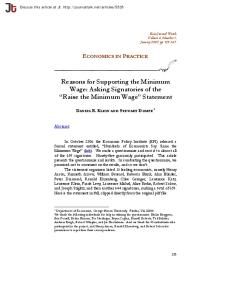
Federal, State, and City Minimum Wages Since 1968 Historical Minimum Wages, 1968-2014 $12.00
$10.00 City State $8.00
Federal 1968 + CPI adjustment
The City's minimum wage instituted in 2004 represented a 26% increase over the State's minimum wage. It was the largest annual increase in the minimum wage since 1956.
$6.00
Nevertheless, even the City's 2014 minimum wage is below what the 1968 federal minimum wage would have been, had it been indexed to inflation.
$4.00
$2.00
$0.00 1968 1970 1972 1974 1976 1978 1980 1982 1984 1986 1988 1990 1992 1994 1996 1998 2000 2002 2004 2006 2008 2010 2012 2014
6
Office of the Controller – Office of Economic Analysis
City and County of San Francisco
In the Next Three Years, the Gap Between the City and State Minimum Wages Will Shrink Future Minimum Wages under Current City and State Law $14
In 2013, the State raised its minimum wage to $9.00 per hour effective July 1, 2014. The State's minimum wage will rise again to $10.00 per hour in 2016.
$12
$10
$8
Both increases are higher than a typical CPI adjustment, and will narrow the gap between the City and State minimum wages, absent local action.
$6 SF (current) $4
SF (future with typical CPI) State (Current law)
$2
$0 2014
2015
2016
2017
7
Office of the Controller – Office of Economic Analysis
City and County of San Francisco
Despite Built-In Inflation Adjustments, Median Rents in the City Have Increased at Twice the Rate of the Minimum Wage since 2005 Minimum Wage and Median Rent Paid in San Francisco, 2005-2012 140
Notwithstanding the builtin CPI increase of the City's current minimum wage, that price index reflects the regional cost of living, not the cost of living within San Francisco.
130
120
110
SF Minimum Wage (2005=100) 100 Median Gross Rent in San Francisco (2005=100) 90
80 2005
2006
2007
2008
2009
2010
2011
Rent is a major aspect of the cost of living. Within San Francisco, the median rent paid has increased at twice the rate of the minimum wage, since 2005 (the earliest year for which rent data was available from the Census).
2012
Source: Office of Labor Standards and Enforcement; U.S. Census Bureau, American Communities Survey
8
Office of the Controller – Office of Economic Analysis
City and County of San Francisco
Prevalence of Minimum Wage Work in San Francisco
•
• •
The OEA estimates that a maximum of 11% of San Francisco workers, or about 60,000 people, earned the minimum wage in 2013, based on occupational data for the metropolitan division. These workers are heavily concentrated in food preparation service and personal service occupations. Among the industries that employ significant numbers of minimum wage workers include: – – – –
•
•
Restaurants and bars Retail Trade Manufacturing Personal and Maintenance and Repair Services
In addition, non-profit organizations employ many minimum wage workers not reflected here, including Government Supported Employees, as defined in the legislation. IHSS workers, however, were counted as Private Household workers, a different industry, until 2013, and are not part of this analysis.
9
Office of the Controller – Office of Economic Analysis
City and County of San Francisco
Economic Impact Factors
•
The proposed legislation can be expected to have two primary effects on San Francisco's economy: – To the extent that the higher minimum wage raises the income of workers who reside in San Francisco, it will raise consumer incomes, spending, and employment associated with consumer spending. This will tend to expand the city's economy. – To the extent that higher minimum wage raises labor costs, it will create a disincentive to hire employees and would lead to reduced employment within the city. This will tend to contract the city's economy. – The net economic impact will depend on the relative strength of these two effects.
10
Office of the Controller – Office of Economic Analysis
City and County of San Francisco
Employment Impacts: San Francisco's 2003-4 Experience • •
•
•
In 2003, the minimum wage instituted by Proposition L represented a 26% increase over the State minimum wage. In terms of employment loss, some of the low-wage industries in the city, such as retail trade and restaurants, declined more slowly than the city as a whole in 2004, or actually added jobs, despite the minimum wage increase. A clearer understanding of the effect of the minimum wage increase on employment requires an adjustment for industry-specific and city-specific economic factors at the time. The table on the next page indicates employment change in low-wage industries in the city, net of the effects of tourism and the overall city economy, and compares it to the same industries in surrounding counties.
11
Office of the Controller – Office of Economic Analysis
City and County of San Francisco
Gross and Net Employment Change in Low Wage Industries in San Francisco and Surrounding Counties, 2003-4 Industry
Industry Job Change, 2003-4 City
Food Services
Adjacent Counties
Total Job Change, 2003-4 City
Adjacent Counties
Net Industry Change City
Adjacent Counties
0.5%
2.0%
-2.3%
-0.2%
2.8%
2.2%
-0.9%
-0.9%
-2.3%
-0.2%
1.4%
-0.6%
Social Assistance
1.0%
-2.0%
-2.3%
-0.2%
3.3%
-1.8%
Personal Services
0.1%
-1.1%
-2.3%
-0.2%
2.4%
-0.9%
-8.5%
0.6%
-2.3%
-0.2%
-5.2%
0.8%
Retail Trade
Manufacturing
The early 2000s recession was more strongly felt in San Francisco than in surrounding counties, and the city's economy was still shrinking while the rest of region was bottoming out. The city's weak overall job situation would depress low-wage industries, and needs to be accounted for to provide a fair comparison. To some extent, the city's relative strength in restaurants and retail trade can be explained by an early recovery in tourism, as most of the area's hotels and tourism spending occurs in San Francisco. It is clear, however, that the city did not experience across-the-board employment declines in low-wage industries. Only the city's manufacturing industry grew at a slower rate than its regional counterpart. Source: Bureau of Labor Statistics, Quarterly Census of Employment and Wages, Surrounding counties are Alameda, Contra Costa, 12 Marin, and San Mateo.
Office of the Controller – Office of Economic Analysis
City and County of San Francisco
Wage Impacts: San Francisco's 2003-4 Experience •
• •
• •
While the statistics suggest that San Francisco's low-wage industries certainly grew no slower than the surrounding region after the city's minimum wage was enacted, the extent to which the policy actually raised earnings, and labor costs, also needs to be established. In 2003, the average worker in the city's restaurant industry earned $353 a week, and worked 36.4 hours, for an average hourly wage of $9.70. This wage was 43% higher than the state minimum wage of $6.75. This market wage was most likely higher than the minimum wage because of the high cost of living in San Francisco. Since food services is the lowest paying industry in the city, it raises the question of the extent to which the 2004 minimum wage actually raised wages. The table on the next page indicates changes in average weekly wages in lowwage industries in San Francisco, relative to the city as a whole and compared to the surrounding region.
13
Office of the Controller – Office of Economic Analysis
City and County of San Francisco
Gross and Net Changes in Wages in Low Wage Industries in San Francisco and Surrounding Counties, 2003-4 Industry
Industry Wage Change, 2003-4 City
Adjacent Counties
Total Private Sector Wage Change, 2003-4 City
Adjacent Counties
Net Wage Change City
Adjacent Counties
Food Services
5.4%
3.9%
7.1%
5.7%
-1.8%
-1.7%
Retail Trade
3.1%
1.3%
7.1%
5.7%
-4.0%
-4.3%
Social Assistance
0.0%
3.8%
7.1%
5.7%
-7.1%
-1.6%
Personal Services
4.4%
3.2%
7.1%
5.7%
-2.7%
-2.5%
-0.1%
0.3%
7.1%
5.7%
-7.3%
-5.4%
Manufacturing
Although 2004 was a weak year for employment growth in the city, average earnings in the private sector grew rapidly. And, as the Net Wage Change column suggests, this average increase was not due to the minimum wage, because low-wage industries had lower wage increases.
Source: Bureau of Labor Statistics, Quarterly Census of Employment and Wages, Surrounding counties are Alameda, Contra Costa, 14 Marin, and San Mateo.
Office of the Controller – Office of Economic Analysis
City and County of San Francisco
Conclusions from San Francisco's 2003-4 Experience
• •
•
•
•
The data is fairly conclusive that there was little to no negative employment effect associated with the introduction of the City's minimum wage in 2004. The data is also clear, however, in showing that the increase in the city's minimum wage did not lead to significant increases in average earnings in lowwage industries. On the contrary, these five industries had lower-than-average wage increases in 2004, supporting the contention that the minimum wage increase in 2004 was too modest to meaningfully raise wages, or raise labor costs to the point where affected businesses reduced their level of employment. As of 2013, the latest data available, the average hourly wage in the food services industry is between $13.10 and $13.80 and hour. The proposed minimum wage would pass this level by 2017, and therefore it should be expected to have a much more powerful impact on wages, and employment, than the 2003 increase had. The 2003-4 experience may therefore be of little value in considering the economic impact of an increase in the minimum wage to $15 per hour by 2018.
15
Office of the Controller – Office of Economic Analysis
City and County of San Francisco
Modeling the Relationship Between Minimum Wage and Average Industry Wage •
•
•
•
•
An increase to the minimum wage will affect the San Francisco economy to the extent that it increases average earnings, which raises worker incomes and the labor costs of businesses. In practice, a minimum wage increase could raise average wages both because minimum-wage workers were required to be paid a higher wage, and because businesses elected to raise the wage of higher-paid workers: the so-called "compression effect". The OEA created statistical models to estimate the relationship between the minimum wage and the average weekly wage of each industry. A different model was estimated for each of the five low-wage industries discussed on pages 1114, using quarterly wage data from the BLS for every county in California, from 1990 to 2012. The models were designed to reflect the fact that a minimum wage increase may have a larger impact on average wages when the minimum wage is already close to the average wage, and less of an impact when it is far below the average wage. In other words, the relationship could be non-linear. Using these models, and current wage levels, we predicted how average wages in each low-wage industry may change along with the minimum wage. 16
Office of the Controller – Office of Economic Analysis
City and County of San Francisco
Annual Increases in the Proposed Minimum Wage, and Projected Average Annual Wage Increases by Industry, 2015-18 2015
2016
2017
2018
2019
2014-19 combined
10.1%
6.7%
6.9%
7.4%
4.6%
28%
Food Services
8.7%
6.0%
6.4%
7.0%
4.5%
26%
Retail Trade
7.3%
5.0%
5.2%
5.7%
3.6%
21%
Social Assistance**
8.8%
5.5%
5.1%
5.5%
3.7%
21%
Personal Services
8.0%
5.4%
5.6%
6.1%
3.9%
23%
Manufacturing
2.8%
2.9%
3.0%
3.1%
3.1%
13%
Minimum Wage*
* Calendar year averages, excluding Government Sponsored Employees. For 2019, a CPI adjustment of 2.3% is assumed. ** Assumes 25% of social assistance employees are Government Sponsored Employees.
17
Office of the Controller – Office of Economic Analysis
City and County of San Francisco
Wage Impact Assessment
•
Given known current employment and wage levels in the affected industries, it is possible to estimate the increased earnings that an average San Francisco employee in the affected industries could receive by 2019: – – – – –
•
Food services industry: additional $125 per week. Retail trade industry: additional $185 per week. Social assistance industry: additional $75 per week. Personal services industry: additional $135 per week. Manufacturing industry : additional $197 per week
These estimates reflect expected inflation, as well as the direct and indirect effects of raising the minimum wage.
18
Office of the Controller – Office of Economic Analysis
City and County of San Francisco
Employment Impact Assessment
•
•
•
• •
The OEA used its REMI model of the San Francisco economy to estimate the impact of the average wage increases detailed on the previous page, over and above expected wage increases in a baseline projection. As discussed earlier, wage increases caused by the proposed legislation will tend to expand the city's economy to the extent that it increases the spending power of low-wage workers who reside in the city, and contract the city's economy to the extent it leads businesses to reduce employment levels. Based on the REMI simulation, the proposed legislation is estimated to reduce the city's employment by approximately 15,270 private sector jobs by 2019, compared to REMI's baseline projection for that year. This represents approximately 2% of private employment in the city. These employment reductions are distributed across the city's economy, but food services and retail trade account for nearly half of the total. The relevance of this employment effect, in terms of job opportunities for city residents, depends upon the city's level of continuing employment growth over the next five years, which is considered on the next page.
19
Office of the Controller – Office of Economic Analysis
City and County of San Francisco
Employment Impact in the Context of Projected Employment Growth •
•
• • •
•
The OEA generally relies upon three different sources for future projections of industry employment: the Employment Development Department (EDD), Moody's Analytics, and the REMI baseline projection. While none of the three sources anticipate a recession in the 2015-19 period, they differ in their projected job growth rate, leading to projections of overall employment growth in the city ranging from 27,000 to 59,000 additional jobs. The employment effect described on the previous page, therefore, represents 25-55% of the jobs the City can expect to add during the next five years, if these projections are accurate. Under the least optimistic projection, with the proposed minimum wage increase, the city's private sector employment would still increase by 12,000 by 2019. Moreover, although the employment affect is concentrated in the affected industries, all three projection sources see continued growth in the food services and social assistance industries, and no impact on manufacturing. Projections regarding retail trade and personal services differ greatly, with Moody's and REMI projecting flat or declining employment in these industries, regardless of any change to the minimum wage. EDD, on the other hand, projects a continuation of the healthy growth of those industries in the city, at a rate which could absorb the projected employment effect of a higher minimum wage.
20
Office of the Controller – Office of Economic Analysis
City and County of San Francisco
Conclusions and Potential Mitigations
•
• •
•
•
•
The OEA's analysis of the proposed increase to the minimum wage finds that it would effectively trade off future employment growth for higher wages for workers in low wage industries. Workers in low-wage industries in San Francisco would likely see their pay increase by an average of over 20%. On the other hand, this analysis suggests that the employment effect would be notable, equaling over 15,000 private sector jobs, or 2% of private employment in the city. If employment in the city continues to grow at its current robust rate through 2019, as our independent projections now expect, then the city overall, and most affected industries, would continue to expand employment. If, however, the city experienced a recession between now and 2019, then the higher labor costs associated with the higher minimum wage would likely deepen the job losses. The City may wish to consider adding flexibility to the proposal in the event of a recession during the 2015-19 period.
21
Office of the Controller – Office of Economic Analysis
City and County of San Francisco
Staff Contacts
• •
Ted Egan, Ph.D., Chief Economist
[email protected] Asim Khan, Ph.D., Principal Economist
[email protected]
22