Animal Science and Pastures | Research Article
DOI: http://dx.doi.org/10.1590/1678-992X-2016-0096 ISSN 1678-992X
In vitro rumen fermentation and effect of protein fractions of canola meals on methane production Jacinto Efrén Ramirez-Bribiesca1*, Tim McAllister2, Emilio Ungerfeld3, María Esther Ortega-Cerrilla1
1
ABSTRACT: Canola provides oil for human consumption and a by-product from the extraction
de Postgraduados – Programa de Ganadería), km. 36.5
of its oil canola meal (CM), is used as a good quality protein and lipid supplement for ruminants.
Carr. – 56230 – Texcoco, Mexico State – Mexico.
The aim of this study was to determine the chemical composition and fermentation profile asso-
College of Postgraduate – Dept. of Animal Science (Colegio
2
ciated with the potential for methane production of three types of CM: solvent-extracted CM of
Centre, 5403 1st Av. South – Lethbridge, Alberta – Canada.
Brassica napus (CMBN), B. juncea (CMBJ) and cold press-extracted CM from B. napus (CPCM)
Agriculture and Agri-Food Canada/Lethbridge Research
3
Institute of Agricultural Science (Instituto de Investigaciones
used to feed ruminants. The protein content of canola meal ranged from 36 to 41 %. The acid
Agropecuarias), Carillanca, km 10, Camino Cajón – 8340422
and neutral detergent insoluble in nitrogen ranged from 1 to 2 % and 4 to 5 %, respectively. The
– Temuco – Chile.
lipid content of canola meal samples ranged from 2 % (CMBN, CMBJ) to 14 % (CPCM). In vitro,
*Corresponding author
dry matter disappearance of CMBJ was higher than that of other types of CM at 4 h, 24 h and 48 h. Gas production from CMBJ was greater than that of CPCM and CMBN at 24 h and 48 h of
Edited by: Gerson Barreto Mourão
incubation. CPCM produced lower methane than CMBJ at 48 h of incubation. CPCM produced a higher (p < 0.05) molar proportion of propionate from 12 h to 48 h of incubation. In conclusion,
Received March 11, 2016
this study found that CPCM could be a good source of protein (mainly PB2) and lipids in the feed
Accepted January 02, 2017
of ruminants; it will decrease methane production and enhance propionate production. There was correlation between less methane production, and the content of lipids and PB2 in the three types of CM studied. Keywords: Brassica napus and juncea, degradability, ruminants
Introduction Canola is a rapeseed variety developed in Canada in 1979 (Bell, 1984). These Brassica varieties (B. carinata, B. juncea and B. napus) are considered an important oilseed crop with about 42-43 % oil, which is extracted for use as a premium edible vegetable oil (Uppstrom, 1995). The remaining canola meal is a by-product of canola extraction widely used as a protein supplement in the livestock and food industries (Bonnardeaux, 2007; He et al., 2013). Rumen degradable protein provides nitrogen in the form of ammonia, peptides and amino acids to the microorganisms for microbial protein synthesis, whereas rumen undegraded protein and endogenous secretions provide amino acids for direct intestinal absorption. The feed crude protein (CP) fraction is divided into fractions A, B1, B2, B3, and C according to ruminal degradation. Fraction A corresponds to non-protein nitrogen, fractions B1, B2 and B3 are proteins with different rates of degradation and fraction C is undegradable in the rumen. Canola meal contains a minimum 36 % CP (McAllister et al., 1993; Eghbalia et al., 2011; Tan et al., 2011). Canola meal can also be an energy source depending on its oil content. Solvent-extracted Brassica juncea and napus meals contain 3 % and 2 % oil, respectively, and cold press-extracted CM from B. napus contains 13 % oil (He et al., 2013). Furthermore, increasing oil in the diet of ruminants decreases the emission of enteric methane (Chung et al., 2012). Beauchemin et al. (2008) reviewed the effect of dietary lipids on the emission of methane over 17 studies and reported a decrease of 0.06 g of methane kg–1 dry matter (DM) intake per
Sci. Agric. v.75, n.1, p.12-17, January/February 2018
10 g kg–1 DM addition of supplemental fat. There are no reports of the effect of protein fractions on the emission of methane in ruminants. Therefore, the objective of this study was to determine the chemical composition and fermentation profile associated with the potential for methane production of three types of CM (solvent-extracted CM of Brassica napus and B. juncea, and cold press-extracted CM from B. napus) commonly used to feed ruminants.
Materials and Methods This study was carried out in Lethbridge, Alberta, Canada (lat. 49.70° N, long. 112.77° W, 910 m altitude). Animals used in this study to obtain ruminal fluid were cared for following the guidelines set out by the Canadian Council on Animal Care (CCAC, 1993). Three types of CM previously identified in another study (He et al., 2013) were used: 1) Solvent-extracted CM from B. napus; (CMBN) 2) Solvent-extracted CM from B. juncea (CMBJ) (XCEED), and 3) Cold press-extracted CM from B. napus (CPCM). All three CM types were obtained from two commercial production plants in Alberta, Canada. Physical and chemical characterization of canola meals Particle size distribution was determined using approximately 50 g (as fed basis) samples in triplicate. United States Bureau of Standards (USBS) sieves measuring 2.36 mm, 2.0 mm, 1.7 mm, 1.18 mm and 1.0 mm were utilized to determine particle size distribution. Samples were placed on the top sieve and sieved for 5
Ramirez-Bribiesca et al.
Canola meals on methane production
min. On completion of sieving, distribution was determined gravimetrically. Six samples of each CM were hand ground using a marble mortar and pestle, and all samples were stored in a -20 °C freezer. These samples were subsequently dried at 65 °C overnight in a forced air oven for chemical analysis (AOAC, 2005). Neutraldetergent fibre (NDF) and acid-detergent fibre (ADF) were determined using the method described by Van Soest et al. (1991). Total nitrogen (N) was measured by combustion analysis. Acid detergent insoluble N (ADIN) and neutral detergent insoluble N (NDIN) values were determined according to Licitra et al. (1996). Non-protein N (NPN) content was obtained by precipitation of true protein with trichloroacetic acid (Krishnamoorthy et al., 1982). Total soluble crude protein was determined with a bicarbonate-phosphate buffer followed by filtering through Whatman filter paper No. 541. Protein fractions in CM were partitioned according to the Cornell Net Protein System (Sniffen et al., 1992).
ric acid (0.25; w/v) and centrifuged by 6000 rpm by 15’ at 10 °C for ammonia-N analysis. The supernatant was frozen at -20 °C until analyzed for volatile fatty acid (VFA) concentrations (Holtshausen et al., 2009).
In vitro batch culture incubations For in vitro incubations, 0.5 g–1 DM of CM samples were weighed and put into ANKOM® bags and sealed. Bags were placed into 60 mL amber serum bottles fitted with rubber stoppers. Serum bottles containing the different types of CM were incubated for 0 h, 12 h, 24 h or 48 h. Inoculum for the in vitro incubation was obtained from two ruminally cannulated cows fed a 65:35 (forage: concentrate) diet, strained through 4 layers of cheesecloth and centrifuged at 1000 × g for 10 min to remove feed particles. The inoculum was prepared by mixing rumen fluid and a mineral buffer and micro- and macromineral solutions, using a cysteine sulphide solution as a reducing agent (Menke et al., 1979). Twentyfive milliliters of inoculum: buffer mixture were then transferred (25 mL) under a stream of O2-free N gas into serum bottles pre-warmed at 39 °C each containing one ANKOM bag with CM. Bottles were sealed and placed in an orbital shaker rack set at 90 oscillations/min in an incubator at 39 °C. Net gas production of each vial was measured at 12 h, 24 h and 48 h of incubation with a water displacement apparatus (Fedorak and Hrudey, 1983). Headspace gas was sampled from each vial before gas production measurement with a 20 mL syringe and immediately transferred to a 5.9 mL evacuated Exetainer for methane concentration analysis by gas chromatography (Holtshausen et al., 2009). Methane (CH4) was expressed as mg of CH4 g–1 DM disappeared, and total gas production as mL g–1 of incubated as a basis. Fermentation vials were opened after gas sampling and gas production measurement. ANKOM® bags containing undigested residues were then removed from the bottles, rinsed thoroughly with distilled water, dried at 65 °C for 24 h to constant weight and weighed to estimate in vitro DM disappearance (IVDMD). After removal of ANKOM® bags, 1.5 mL L–1 of the remaining liquid fraction was sub-sampled, and acidified with 300 µl of metaphospho-
where: % SOL P = % CP of the CM that is soluble protein; PA = % CP in the CM that is non-protein nitrogen; PB1 = % CP in the CM that is rapidly degraded protein; PB2 = % CP in the CM that is intermediately degraded protein; PB3 = % CP in the CM that is slowly degraded protein; PC = % CP in the CM that is bound protein. The IVDMD from the batch culture incubation was calculated by means of the following equation: IVDMD = 1 – [(R – B) / S] where R is g of DM as undigested residue, B is g of DM as undigested residue in blank bags, and S is the dry weight of the initial substrate. The IVDMD, GP and methane content were calculated using the inverted exponential function (Ørskov and McDonald, 1979) using Sigma Plot (v. 10.0.1): P = a + b (1-e–ct) where P is gas production volume at time t; ‘a’ and ‘b’ are mathematical parameters, ‘c’ is a constant fractional of gas production rates, and ‘a’ + ‘b’ is theoretical maximum gas production volume:
Sci. Agric. v.75, n.1, p.12-17, January/February 2018
Calculations Protein fractions (as % CP) were calculated using the following equations (Sniffen et al., 1992): PA = NPN (% SOL P) × 0.01 × SOL P (% CP) PB1 = SOL P (% CP) – PA (% CP) PC = ADIN (% CP) PB3 = NDIN (% CP) - ADIN (% CP) PB2 = 100 – PA (% CP) – PB1 (% CP) – PB3 (% CP) – PC (% CP).
limt→+∞ a + b(1– e – ct) = a + b Undigested protein at each time point was calculated according to: Residual Protein%=100(1 −
(SDM × Protein% SDM)-(RSDM × Protein% in RSDM) ) SDM × Protein% SDM
where: SDM is the sample CP (%N × 6.25) mass (g DM) and RSDM is the residual CP (%N × 6.25) mass (g DM). Statistical analyses Physical and chemical characterization of CM were analyzed by one-way ANOVA. Four incubation runs were completed on different days. In vitro results were produced by a randomized complete block design using the PROC Mixed procedure program (Statistical Analysis System, v. 9.6), with treatment as fixed effects. Differences between treatments and the interaction term CM types × Time were differentiated using the Least-Squares Means with the Pairwise Comparisons op13
Ramirez-Bribiesca et al.
Canola meals on methane production
tion. Pearson’s correlation coefficients between chemical composition and methane production were obtained using a correlation procedure (Statistical Analysis System, v. 9.6).
Results and Discussion Physical and chemical characterization of canola Crude protein content of CM ranged from 36 to 41 % (Table 1). CMBJ had the higher protein content (p < 0.05). The different types of CM differed in terms of protein sub-fractions. The CMBJ was lower in intermediately degradable CP (PB2: 22 %). The composition is affected both by the type of canola seed used and the industrial process used to extract the oil. CPCM contained lower protein and higher oil content than other types of canola. CM depends on the technique employed during oil extraction. On the other hand, soluble protein is assumed to be immediately degraded in the rumen (Sniffen et al., 1992). CPCM had the lower proportion of fraction A and CMBN had the higher ADIN content. The NDF and ADF content ranged from 18 to 29 % and 10 to 23 %, respectively. The lipid content of CM samples ranged from 2 to 14 %. Particle size distribution of each CM is also Table 1 – Physical characterization of three types of canola meal. Canola meal (CM) CPCM Moisture
2.91 b
CMBJ
CMBN
SEM
7.84 a
4.72 a
0.03
Dry Matter, % Protein (N × 6.25)
36.1 c
40.97 a
37.58 b
0.31
Lipid
13.99 a
2.49 c
3.66 b
0.98
Ash
8.04 c
8.46 b
9.65 a
0.05
Carbohydrates*
12.92 b
24.74 a
15.63 b
0.83
NDF
26.04 b
18.5 c
28.76 a
0.53
ADIN
1.03 c
1.73 b
2.27 a
0.04
NDIN
4.55 b
4.62 a
4.39 c
0.01
Protein fractions (% crude protein (CP)) PA 14.07 c
27.75 a
18.18 b
0.68
PB1
21.75 a
21.84 a
20.88 b
0.68
PB2
37.22 a
22.47 c
34.38 b
0.90
PB3
20.88 a
17.45 b
12.86 c
0.25
PC
6.07 c
10.48 a
13.69 b
0.18
> 2.36 mm
9.3 a
6.37 c
7.7 b
0.96
2.36 – 1.7º mm
7.58 a
7.13 a
6.64 b
0.89
23.99 c
1.60
Particle size, % retained
1.70 – 1 mm
43.4 a
26.2 b
< 1 mm 39.72 b 60.3 a 61.67 a 1.81 CPCM = Cold press-extracted CM from B. napus; CMBJ = Solvent-extracted CM from B. juncea; CMBN = Solvent-extracted CM from B. napus; NDF = Neutral-detergent fibre; ADIN: Acid detergent insoluble Nitrogen; NDIN: Neutral-detergent insoluble Nitrogen; PA = % CP in the CM that is non-protein nitrogen; PB1 = % CP in the CM that is rapidly degraded protein; PB2 = % CP in the CM that is intermediately degraded protein; PB3 = % CP in the CM that is slowly degraded protein; PC = % CP in the CM that is bound protein; SEM = Standard Error Mean; *Calculated by difference = 100 – (moisture + protein +lipid + ash + NDF); Means within the same row with unlike letters differ (p < 0.05).
Sci. Agric. v.75, n.1, p.12-17, January/February 2018
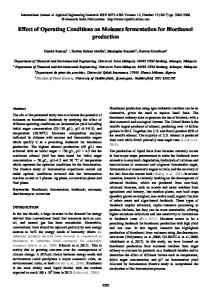
listed in Table 1. The proportion of particles > 2.36 mm ranged from 6 % for CMBJ to 9 % for CPCM. Likewise, CPCM had the higher percentage of particles that measured 1.0 to 1.7 mm. In contrast, CMBJ and CMBN had more than 60 % of particles smaller than 1.0 mm. In vitro batch culture incubation and kinetic parameters The IVDMD, gas and methane production from CM incubated in batch culture are presented in Table 2. IVDMD of CMBJ was higher than that of other types of canola at 24 h and 48 h. CPCM had the lowest of IVDMD at 48 h of incubation. Moreover, CM type × time interaction was different (p < 0.001). In this study, there was no correlation between particle size and DM digestibility in three types of CM (p > 0.05) and IVDMD Ruminal in vitro digestibility of DM in this study was between 50 and 60 %, Santos et al. (2014) reported values from 67 to 77 % using canola combined with other ingredients in ruminant diets. CMBJ gas production was higher than those of CPCM and CMBN at 24 h and 48 h of incubation (Table 2). In contrast, CMBN had lower gas production after 12 h and CM type × time interaction was different (p < 0.001) in gas production. CPCM produced less methane than CMBJ at all time points of incubation. In this study, gas formation was a direct consequence of fermentation conducted by ruminal microbes and alfalfa hay as subtracters by which carbohydrates were broken down (Molano et al., 2006). There was a tendency (p = 0.08) to less methane production in CPCM than in CMBN during all periods of incubation. However, the pattern of methane production of CM was distinctly different from CPCM vs. CMBJ and CMBN, particularly in later time periods of incubation when all treatments were compared with kinetic parameters (Figure 1). In vitro VFA are presented in Table 3. CMBJ and CMBN had a similar molar percentage of acetate and propionate at 24 h and 48 h. The acetate to propionate ratio at 12 h, 24 h and 48 h was lower for enhanced at CPCM than for CMBJ and CMBN. Moreover, a CM type × time interaction was different (p < 0.001) in acetate, propionate and Acetate: Propionate relationship. Ammonia concentration and residual protein of CM incubated in the rumen are presented in Table 4. Ammonia concentration increased linearly (p < 0.05) according to the period of incubation in all treatments. CPCM had less ammonia concentration than CMBJ and CMBN during the 48 h of incubation. CPCM and CMBJ had more undigested protein content at 48 h than CMBN. NPN is converted to ammonia during the incubation; in this case, CMBJ and CMBN contain more NPN and more ammonia production was, therefore, expected during the term of incubation (Ali et al., 2008). There were negative correlations between methane production and lipid contents (p < 0.05) and PB2 (p < 0.001) (Table 5) and methane had positive correlation with PA (p < 0.01). Other variables analysed such as PB1, PB3, PC, ADIN and NDIN and residual protein had 14
Ramirez-Bribiesca et al.
Canola meals on methane production
Table 2 – In vitro dry matter disappearance (IVDMD), total gas and methane production in three types of canola meal incubated in buffered rumen fluid. Canola meal
SEM
Table 3 – In vitro volatile fatty acids (VFA) concentration and profile in three types of canola meal incubated in buffered rumen fluid. Canola meal CPCM
CMBJ
CMBN
SEM
Acetate (mol %)
CPCM
CMBJ
CMBN
IVDMD 12 h
12 h
57.65 cx 58.99 bx 59.61 ax
0.30
32.79 az
32.88 az
31.36 az
0.85
24 h
55.58 by 57.4 ay
57.43 ay
0.30
24 h
43.66 by
48.26 ay
43.86 by
0.85
48 h
54.83 by 56.46 ay 55.93 az
0.30
48 h
50.93 cx
62.16 ax
55.06 bx
0.81
Propionate (mol %)
maximum gas production production rates
52.6 c 0.94
76.83 a 0.97
63.79 b 0.96
1.45
12 h
24.59 ay 22.83 by 22.28 by
0.14
24 h
26.68 ax 24.23 bx 24.26 bx
0.15
48 h
26.05 ax 24.27 bx 24.15 bx
0.14
10.71 by 11.78 ax 10.93 bx
0.12
Gas Production (mL g–1 DM) 12 h
50.37 az
37.39 bz
3.94
Butyrate (mol %)
82.59 cy 120.37 ay
56.11 az
96.27 by
3.94
12 h
48 h
132.62 bx 163.41 ax 125.24 bx
3.75
24 h
9.88 cx 11.17 ax 10.28 bxy 0.13
maximum gas production production rates
102.63 a 0.98
2.45
48 h
9.67 bx 10.52 ay
9.98 by
0.12
24 h
102.39 a 0.97
75.25 b 0-96
Acetate: Propionate relationship
Methane (mL g–1 DM) 12 h
12 h
2.34 cy
2.58 bx
2.67 ax
0.02
13.00 bz
15.18 az
12.37 bz
0.74
24 h
2.10 bx
2.37 ay
2.37 ay
0.02
24 h
23.40 by
25.99 ay
23.2 by
0.74
48 h
2.12 bx
2.33 ay
2.31 ay
0.02
48 h
27.17 bx
32.96 ax
28.99 bx
0.70
CPCM = Cold press-extracted CM from B. napus; CMBJ = Solvent-extracted CM from B. juncea; CMBN = Solvent-extracted CM from B. napus; Interaction types CM × hours = Acetate, p < 0.005; Propionate, p < 0.0001; Total VFA p < 0.001; Acetate: Propionate, p < 0.0001; SEM = Standard Error Mean; a-c Means within the same row with unlike letters differ (p < 0.05); x-z Means within the same column with unlike letters differ (p < 0.05).
maximum gas production 29.17 b 36.86 a 32.61 b 0.55 production rates 0.93 0.95 0.95 CPCM = Cold press-extracted CM from B. napus; CMBJ = Solvent-extracted CM from B. juncea; CMBN = Solvent-extracted CM from B. napus; SEM = Standard Error Mean; Interaction types CM × hours = IVDMD p < 0.0001; Gas Production; p < 0.0001. Maximum gas production (mL 0.1g–1 DM); production rates (gas production per hour); Different letters indicate significant difference (p < 0.05). a-cMeans within the same row with unlike letters differ (p < 0.05). x-z Means within the same column with unlike letters differ (p < 0.05).
Table 4 – Ammonia and Residual protein concentrations in three canola meal types incubated in buffered rumen fluid. Canola meal types, %
SEM
CPCM
CMBJ
CMBN
12 h
27.09 az
25.64 bz
21.32 cz
0.99
24 h
44.22 ay
38.01 by
39.4 by
0.99
48 h
61.68 bx
71.08 ax
68.52 ax
0.95
12 h
80.3 bx
89.67 ax
83.24 bx
1.22
24 h
70.97 by
78.27 ay
74.09 by
1.22
48 h
59.90 az
63.03 az
55.78 bz
1.16
Ammonia (mmol L–1)
Residual protein,%
CMBN = Solvent-extracted CM from B. napus; CMBJ = Solvent-extracted CM from B. Juncea; CPCM = Cold press-extracted CM from B. napus; Interaction types CMs × hours = Residual Protein, p < 0.0001; a-cMeans within the same row with unlike letters differ (p < 0.05); x-zMeans within the same column with unlike letters differ (p < 0.05); Interaction types CMs × hours: Residual Protein, p < 0.001.
Figure 1 – Pattern of in vitro methane production (fitted with exponential model) on incubation of canola meal in buffered rumen fluid.
no correlation (p > 0.05) with the emission of methane. Currently, there is no published information indicating the importance of each fraction of protein and carbohydrates in the methane. However, it is known that methane emissions are lower with higher proportions of forage legumes (~19 % protein, ~53 % of fraction of CP that is soluble) than forages (~14 % of protein, ~33 % of the
Sci. Agric. v.75, n.1, p.12-17, January/February 2018
fraction of CP that is soluble) in the diet (NRC, 2001; Pal et al., 2015). This was due, in part, to lower fibre contact, a faster rate of passage and, in certain cases, the presence of condensed tannins (Beauchemin et al., 2008). Whatsmore, the stage of maturity also affected methane production per unit of forage digested (McAllister et al., 1996). CPCM should be a good source of protein in the feed of ruminants, resulting in a decrease in methane production and enhancement of propionate production. Furthermore, there is uncertainty surrounding protein that the content in ruminant feed could increase (ad lib ryegrass plus cottonseed meal and corn supplements: De 15
Ramirez-Bribiesca et al.
Canola meals on methane production
Table 5 – Correlations between chemical composition of three types of canola meal (CM)* and the emission of methane 48 h after incubation in vitro with ruminal fluid. Protein fractions Lipids
PA
PB1
PB2
PB3
PC
ADIN
NDIN
Residual protein
Methane
-0.801
0.994
0.292
-0.992
0.227
0.393
0.385
0.484
0.610
p=0
0.048
0.001
0.575
0.001
0.665
0.441
0.452
0.331
0.198
*CPCM = Cold press-extracted CM from B. napus; CMBJ = Solvent-extracted CM from B. juncea; CMBN = Solvent-extracted; CM from B. napus; PA = % crude protein (CP) in the CM that is non-protein nitrogen; PB1 = % CP in the CM that is rapidly degraded protein; PB2 = % CP in the CM that is intermediately degraded protein; PB3 = % CP in the CM that is slowly degraded protein; PC = % CP in the CM that is bound protein; ADIN = Acid detergent insoluble Nitrogen; NDIN = Neutral-detergent insoluble Nitrogen.
Ramus et al., 2003), which does not modify (Lucerne in the replacement of soya bean meal plus beet pulp: Doreau et al., 2014) or decrease (binding of tannins to protein: Tavendale et al., 2005) enteric CH4 emission. In our in vitro study, PA content was positively correlated with the production of methane; this result is associated with the quantity of nitrate and free amino acids in this protein fraction (Tylutki et al., 2008) and is rapidly metabolized in the rumen (O’Connor et al., 1992). PB2 was negatively correlated with the production of methane; it is mainly composed of albumins and glutelins and is fermented in the rumen at lower rates compared to buffer-soluble fractions (Sniffen et al., 1992; Tylutki et al., 2008). It is interesting to consider future studies with protein supplements rich in glutelins; perhaps this nutrient will reduce enteric methane production. Finally, PB3 and PC are associated with the cell wall and are highly resistant to breakdown by microbial enzymes; these fractions did not correlate with the production of methane. In conclusion, this study found that CPCM could be a good source of protein (mainly PB2) and lipids in the rations of ruminants; it will decrease methane production and enhance propionate production. Furthermore, the novelty of this study was the correlation between less methane production, with the content of lipids and PB2 in the three types of CM studied.
Acknowledgements This study was funded by The Lethbridge Research Centre, Alberta, Canada.
References Ali, C.S.; Khaliq, L.T.; Sarwar, M.; Javaid, A.; Shahzad, M.A.; Nisa, M.; Zakir, S. 2008. Effect of various non protein nitrogen sources on in vitro dry matter digestibility, ammonia production, microbial growth and pH changes by rumen bacteria. Pakistan Veterinary Journal 28: 25-30. Association of Official Analytical Chemists [AOAC]. 2005. Official Methods of Analysis. 18ed. AOAC, Washington, DC, USA. Beauchemin, K.A.; Kreuzer, M.; O´Mara, F.; McAllister, T.A. 2008. Nutritional management for enteric methane abatement: a review. Australian Journal of Experiment Agriculture 48: 21-27. Bell, J.M. 1984. Nutrients And Toxicants In Rapeseed Meal: Review. Journal Of Animal Science 58: 996-1010.
Sci. Agric. v.75, n.1, p.12-17, January/February 2018
Bonnardeaux, J. 2007. Uses for Canola Meal. Department of Agriculture and Food, Government of Western Australia, Perth, Australia. Canadian Council of Animal Care [CCAC]. 1993. Guide to the care and use of experimental animals. Canadian Council of Animal Care, Ottawa, Canada. Chung, Y.H.; Zhou, M.; Holtshausen, L.; Alexander, T.W.; McAllister, T.A.; Guan, L.L.; Oba, M.; Beauchemin, K.A. 2012. A fibrolytic enzyme additive for lactating Holstein cow diets: ruminal fermentation, rumen microbial populations, and enteric methane emissions. Journal of Dairy Science 95: 1419-1427. De Ramus, H.A.; Clement, T.C.; Giampola, D.D.; Dickison, P.C. 2003. Methane emissions of beef cattle on forages: efficiency of grazing management systems. Journal of Environmental Quality 32: 269-277. Doreau, M.; Ferlay, A.; Rochette, Y.; Martin, C. 2014. Effects of dehydrated lucerne and soya bean meal on milk production and composition, nutrient digestion, and methane and nitrogen losses in dairy cows receiving two different forages. Animal 8: 420-430. Eghbalia, M.; Kafilzadeha, F.; Hozhabria, F.; Afshar, S.; KazemiBonchenaric, M. 2011. Treating canola meal changes in situ degradation, nutrient apparent digestibility, and protein fractions in sheep. Small Ruminant Research 96: 136-139. Fedorak, P.M.; Hrudey, S.E. 1983. A simple apparatus for measuring gas production by methanogenic cultures in serum bottles. Environmental and Technology Letters 4: 425-432. He, L.M.; Gibb, D.; McKinnon, J.J.; McAllister, T.A. 2013. Effect of high dietary levels of canola meal on growth performance, carcass quality and meat fatty acid profiles of feedlot cattle. Canadian Journal of Animal Science 93: 269-280. Holtshausen, L.; Chaves, A.V.; Beauchemin, K.A.; McGinn, S.M.; McAllister, T.A.; Odongo, N.E.; Cheeke, P.R.; Benchaar, C. 2009. Feeding saponin-containing Yucca schidigera and Quillaja saponaria to decrease enteric methane production in dairy cows. Journal of Dairy Science 92: 2809-2821. Krishnamoorthy, U.; Muscato, T.V.; Sniffen, C.J.; Van Soest, P.J. 1982. Nitrogen fractions in selected feedstuffs. Journal of Dairy Science 65: 217-225. Licitra, G.; Hernandez, T.M.; Van Soest, P.J. 1996. Standardization of procedures for nitrogen fractionation of ruminant feeds. Animal Feed Science and Technology 57: 347-358. McAllister, T.A.; Cheng, K.J.; Beauchemin, K.A.; Bailey, D.R.C.; Pickard, M.D.; Gilbert, R.P. 1993. Use of lignosulfonate to decrease the rumen degradability of canola meal protein. Canadian Journal of Animal Science 73: 211-215.
16
Ramirez-Bribiesca et al.
McAllister, T.A.; Okine, I.E.K.; Mathison, G.W.; Cheng, K.J. 1996. Dietary, environmental and microbiological aspects of methane production in ruminants. Canadian Journal of Animal Science 76: 241-243. Menke, K.H.; Raab, L.; Salewski, A.; Steingass, H.; Fritz, D.; Schneider, W. 1979. The estimation of digestibility and metabolisable energy content of ruminant feedstuffs from the gas production when they incubated with rumen liquor in vitro. Journal of Agriculture Science 93: 217-222. Molano, G.; Clark, H.; Knight, T.W.; Cavanagh, A. 2006. Methane emissions from growing beef cattle grazing hill country pasture. Proceedings of the New Zealand Society of Animal Production 66: 172-175. National Research Council [NRC]. 2001. Nutrient Requirements of Dairy Cattle. 7ed. National Academy Press, Washington, DC, USA. O'Connor, J.D.; Sniffen, C.J.; Fox, D.G.; Chalupa, W. 1992. A net carbohydrate and protein system for evaluating cattle diets. IV. Predicting amino acid adequacy. Journal of Animal Science 71: 1298-1311. Ørskov, E.R.; McDonald, I. 1979. The estimation of protein degradability in the rumen from incubation measurements weighted according to rate of passage. Journal of Agriculture Research 92: 499-503. Pal, K.; Patra, A.K.; Sahoo, A. 2015. Evaluation of feeds from tropical origin for in vitro methane production potential and rumen fermentation in vitro. Spanish Journal of Agricultural Research 13: 1-12. Santos, G.T.; Marchi, F.E.; Damasceno, J.C.; Alcalde, C.R.; Branco, A.F.; Jobim, C.C.; Cecato, U.; Santos, F.S. 2014. Digestibility of canola seeds treated by autoclaving and/or condensed tannins. Revista Colombiana de Ciencias Pecuarias 27: 29-36.
Sci. Agric. v.75, n.1, p.12-17, January/February 2018
Canola meals on methane production
Sniffen, C.J.; O'Connor, J.D.; Van Soest, P.J.; Fox, D.G.; Russell, J.B. 1992. A net carbohydrate and protein system for evaluating cattle diets. II. Carbohydrate and protein availability. Journal of Animal Science 70: 3562-3577. Tan, S.H.; Mailer, R.J.; Blanchard, C.L.; Agboola, S.O. 2011. Extraction and characterization of protein fractions from Australian canola meals. Food Research International 44: 10751082. Tavendale, M.H.; Meagher, L.P.; Pacheco, D.; Walker, N.; Attwood, G.T.; Sivakumaran, S. 2005. Methane production from in vitro rumen incubations with Lotus pedunculatus and Medicago sativa, and effects of extractable condensed tannin fractions on methanogenesis. Animal Feed Science and Technology 123: 403-419. Tylutki, T.P.; Fox, V.D.G.; Durbal, M.; Tedeschi, L.O.; Russell J.B.; Van Amburgh, M.E.; Overton, T.R.; Chase, L.E.; Pell, A.N. 2008. Cornell net carbohydrate and protein system: a model for precision feeding of dairy cattle. Animal Feed Science and Technology 143: 174-202. Uppstrom, B. 1995. Seed chemistry. In: Kimber, D.; McGregor, D.I., eds. Brassica oilseeds: production and utilization. CAB International, Wallington, UK. Van Soest, P.J.; Robertson, J.B.; Lewis, B.A. 1991. Methods of dietary fiber, NDF and non-starch polysaccharides in relation to animal nutrition. Journal of Dairy Science 74: 3585-3597.
17