Open clamp structure in the clamp-loading complex visualized by electron microscopic image analysis Tomoko Miyata*†, Hirofumi Suzuki*†, Takuji Oyama*, Kouta Mayanagi*, Yoshizumi Ishino‡, and Kosuke Morikawa*§ *Department of Structural Biology, Biomolecular Engineering Research Institute, 6-2-3 Furuedai, Suita, Osaka 565-0874, Japan; and ‡Laboratory of Protein Chemistry and Engineering, Faculty of Agriculture, Kyushu University, Hakozaki, Higashi-ku, Fukuoka-shi, Fukuoka 812-8581, Japan Communicated by John Kuriyan, University of California, Berkeley, CA, July 28, 2005 (received for review June 13, 2005)
AAA⫹ ATPase 兩 clamp loader 兩 DNA replication 兩 electron microscopy 兩 single-particle analysis
I
n highly processive genomic DNA duplication, the DNA polymerase is tethered on the DNA strand through a direct interaction with the sliding clamp, which is topologically linked to the DNA by the action of the clamp loader (1). In this reaction, the clamp loader opens and reseals the clamp ring at the primer–template junctions in an ATP-dependent manner. Functional (2–8) and structural (9–12) analyses have indicated that the clamp-loading mechanism is conserved across the domains of life (13–15). All of the sliding clamps from phage to eukarya form similar planer rings, despite their distinct subunit compositions and lower sequence identities. Likewise, the clamp loader complexes from various organisms commonly exist as pentameric complexes with similar subunit configurations. The complexes have a unique oligomeric shape with the open ring in the N-terminal regions of each subunit, which folds into an architecture classified within the AAA⫹ ATPase superfamily (16), while the C-terminal regions form the closed ‘‘collar’’ structure. The crystal structure of the yeast clamp loader, replication factor C (RFC), in complex with the sliding clamp, proliferating cell nuclear antigen (PCNA), revealed their detailed contact mode and the elegant match of the spiral configuration of the Nterminal domains of RFC with that of the double-stranded (ds) DNA, and thus allowed the reasonable model building of the RFC–PCNA binary complex docked with a DNA duplex (12). We previously reported the 23-Å resolution EM structure of a clamp-loading RFC–PCNA–DNA ternary complex from Pyrococcus furiosus (Pfu), which was stabilized by introducing a nonhydrolyzable ATP analog, ATP␥S (17). The structure showed the two building blocks, a larger horseshoe and a smaller closed ring. It appeared the best interpretation based on the available data that the horseshoe and the closed ring correspond to RFC and PCNA, respectively. Although the atomic structures of the PCNA trimer (18) and RFC small subunits (RFCSs) (11) were available, along with the information about the 1:4 stoichiometry for RFC large subunit (RFCL) and RFCS in the RFC hetero-pentamer (5), the fitting of the atomic model into the EM map was not completely satisfactory, and some ambiguity rewww.pnas.org兾cgi兾doi兾10.1073兾pnas.0506447102
mained. In this study, we describe the EM structure of the clamp-loading complex determined at 12-Å resolution. The more excellent fitting of the atomic structures of the RFC and PCNA subunits into the map allows us to ensure that this is a real 3D structure. We now see that the PCNA is kept open in the complex with a spring-washer-shaped conformation. The previous EM map was conversely assigned, with a closed PCNA and an open C-terminal collar of RFC. The first direct view of the open clamp structure provides an opening mode of the clamp during the clamp-loading reaction. Methods Sample Preparation and Data Collection. Sample preparation of the
clamp-loading complex and EM data collection were performed as described in our previous report (17), with a modification in the variety of primed template DNAs (priDNAs) to reconstruct the ternary complexes. Three kinds of the priDNAs were created by annealing two synthetic DNAs as follows: tem30 (TTAAGCAATTCGTAATCATGGTCATAGCT) primed with pri11 (AGCTATGACCA) for pri11兾30, tem30 primed with pri21 (AGCTATGACCATGATTACGAA) for pri21兾30, and tem40 (GCCTGCACGA AT TA AGCA AT TCGTA ATCATGGTCATAGCT) primed with pri-25 (GCTATGACCATGATTACGAATTGC) for pri25兾40. PfuPCNA and PfuRFC were mixed with either of the priDNAs and ATP␥S and incubated at 37°C for 30 min. The mixture was repurified with a Superdex 200 gel filtration column. The fractions corresponding to the reconstructed complex were applied onto the carbon-coated grids, stained with 2% uranyl acetate, and examined with a JEOL JEM-100CX electron microscope equipped with a LaB6 electron gun. The images obtained on Fuji FG films were digitized with a DSScanner 1010. Single-Particle Reconstruction of the Nonlabeled Complex. Three data sets of the nonlabeled clamp-loading complexes were processed as follows. All of the processing for image analysis was carried out with the EMAN software suite (19). Particle images were picked up semiautomatically by the program BOXER. Estimation of the contrast transfer function (CTF) parameters and correction of the CTF phase flipping were performed by using the CTFIT program. The 3D models were generated by using the STARTNRCLASSES and STARTANY programs and were used as the initial models for the low-resolution refinement process. In this refinement process, the low-pass filtered particle images were used, and no CTF correction was performed. Because the resolution and the convergence in the refinement of the pri11兾30 data set were much better than those of the others, only the pri11兾30 data set was applied to the subsequent high-resolution refinement processes, including CTF amplitude correction, au-
Abbreviations: CTF, contrast transfer function; ds, double-stranded; PCNA, proliferating cell nuclear antigen; Pfu, Pyrococcus furiosus; priDNA, primed template DNA; RFC, replication factor C; RFCL, RFC large subunit; RFCS, RFC small subunit; ss, single-stranded. †T.M. §To
and H.S. contributed equally to this work.
whom correspondence should be addressed. E-mail:
[email protected].
© 2005 by The National Academy of Sciences of the USA
PNAS 兩 September 27, 2005 兩 vol. 102 兩 no. 39 兩 13795–13800
BIOCHEMISTRY
Ring-shaped sliding clamps and clamp loader ATPases are essential factors for rapid and accurate DNA replication. The clamp ring is opened and resealed at the primer–template junctions by the ATP-fueled clamp loader function. The processivity of the DNA polymerase is conferred by its attachment to the clamp loaded onto the DNA. In eukarya and archaea, the replication factor C (RFC) and the proliferating cell nuclear antigen (PCNA) play crucial roles as the clamp loader and the clamp, respectively. Here, we report the electron microscopic structure of an archaeal RFC–PCNA–DNA complex at 12-Å resolution. This complex exhibits excellent fitting of each atomic structure of RFC, PCNA, and the primed DNA. The PCNA ring retains an open conformation by extensive interactions with RFC, with a distorted spring washer-like conformation. The complex appears to represent the intermediate, where the PCNA ring is kept open before ATP hydrolysis by RFC.
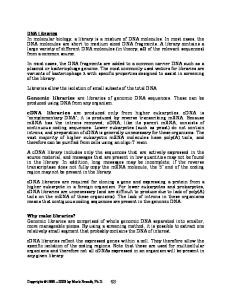
Fig. 1. Single-particle reconstruction of the clamp-loading complex. (a) The top row shows examples of the individual particle images in various orientations, with the respective 2D class averages in the middle row. The bottom row represents the reprojections of the 3D structure of the clamp-loading complex. Good correlation of the class-averages and respective reprojection indicates the reliability of the 3D map. (Scale bar, 100 Å.) (b) Schematic representation of the priDNAs. The nonlabeled clamp-loading complex with the best quality was reconstructed by using pri11兾30 (cyan). The ds-labeled complex was generated by using pri25兾40 biotinylated at the 5⬘ end of the primer strand (yellow), and the ss-labeled one was generated by using pri25兾40 with 5⬘ biotin of the template strand (magenta). (c) Surface representations of the ternary complex. Back, front, bottom, and top views are shown from left to right. (d) Structures of the ds-labeled (first, yellow) and ss-labeled (second, magenta) complexes are superimposed onto the nonlabeled complex (third and fourth, cyan). The third and fourth images correspond to the front and bottom views in c, respectively. The label positions are indicated by the arrows with respective colors. (Scale bar, 100 Å.)
tomatic 3D masking (20), and Fourier ring correlation, instead of cross-correlation factor for the criterion of image similarity. The total iteration number of refinements was 100. The number of particle images used for the final 3D reconstructions was 19,495. The resolution estimated by the 0.5 criterion of the Fourier shell correlation was 12 Å. Single-Particle Reconstruction of Labeled Complexes. Two types of
the pri25兾40DNAs, with 5⬘ biotin either on the primer or template strand (Fig. 1b), were prepared to generate the streptavidin-labeled complex. The complexes, with streptavidin on the ds or single-stranded (ss) terminus, were designated as ds- or ss-labeled complex, respectively. These priDNAs were incubated with the proteins under the same condition as that for the nonlabeled complex. Before repurification with gel filtration, 2-fold excess of streptavidin (Roche) was added into the complex mixtures, and they were further incubated for 5 min. EM experiments, film scanning, and particle picking-up were carried out as described above. The refined 3D map of the nonlabeled complex was used for the initial models for both data sets, and the low-resolution refinement processes were performed. The additional density for the labeled streptavidin was poorly visualized in the refined 3D maps, indicating that the structures of the labeled complexes were heterogeneous, presumably because of the variability of the streptavidin-labeled 13796 兩 www.pnas.org兾cgi兾doi兾10.1073兾pnas.0506447102
DNA termini or from contamination of the labeled and nonlabeled particles in each data set. Therefore, further refinement was performed by using the MULTIREFINE program (21), in which multiple 3D models are refined simultaneously by using a single data set. For each of the data sets, two 3D maps, model A and model B, were prepared as the initial models for the labeled and nonlabeled complexes, respectively. As model A of each data set, the refined 3D maps obtained from the prior conventional refinement were used. On the other hand, the low-pass filtered maps of the nonlabeled complexes were used as model B. The numbers of particle images used for the final 3D reconstructions and the estimated resolutions were as follows: 3,583 particles and 22 Å for class A of the ds-labeled (3D model not shown), 3,718 particles and 22 Å for class B of the ds-labeled (yellow in Fig. 1d), 2,568 particles and 23 Å for class A of the ss-labeled (magenta in Fig. 1d), and 2,365 particles and 23 Å for class B of the ss-labeled (3D model not shown). To identify label positions on the complex, automatic fitting with the FOLDHUNTER program (22) was performed to fit the 3D maps of labeled complex into that of the nonlabeled complex. Model Fitting and Graphical Representation. All of the 3D graphical
representations were produced by using the University of California, San Francisco CHIMERA package (23). The volume for Miyata et al.
Results and Discussion Three-Dimensional Structure of the Pfu Clamp-Loading Complex.
Since the publication of the previous report, we have obtained higher-resolution EM maps, which allowed more definite conclusions to be made about the subunit assignments and the path of the primed DNA within the complex. In particular, we have searched for DNA structures suitable for high-resolution analysis, using various DNA lengths and structures, and tried other computing techniques for image analysis (see Methods for details). The best 3D map was obtained from the complex that was reconstructed by using a 30-nt template DNA primed with an 11-nt primer (pri11兾30) with a 5⬘ overhanging of the template (Fig. 1b, cyan). The 3D map was calculated by using an angularreconstitution-like method, which is implemented in EMAN (19). In our previous work, we chose the random conical tilt reconstruction method, because the previous pri25兾40 complex exhibited probable conformational variability and limited distribution of the particle orientation on the carbon film. This limited distribution could be due to the nonrandom adsorption, which is caused mainly by interaction between the carbon film and DNA portions protruded from the complex. In the present pri11兾30 complex, the particles were absorbed on the carbon film with various orientations and exhibited well ordered structures. Accordingly, the structure determination was possible using only micrographs from untilted specimens. Indeed, structural ambiguity along the z-direction, which is sometimes derived from the flattening and兾or the ‘‘missing cone’’ effects, was almost completely eliminated, as supported by the good fitting of atomic structures described below. Furthermore, the correction of CTF, applied to the untilted images, significantly improved the quality of the structure. Finally, we have obtained a 3D map (Fig. 1 a and c) at a resolution of 12 Å from 19,495 particle images, which is much higher than the previous 23 Å from 2,459 particles. The present EM 3D map of the clamp-loading complex exhibits a substantially different morphology, as compared with the previous one, although common features are also observed, with a larger open ring and a smaller closed ring. The complex forms a three-layered barrel-like shape, with dimensions of 105 ⫻ 110 ⫻ 120 Å (Fig. 1c), whereas the previous map was divided into two blocks. In the present map, the open and closed rings clearly show six and five knots of density, respectively (Fig. 1c, bottom and top). Taken together with the known atomic structures of the clamps and clamp loaders, the open ring with six knots should be Miyata et al.
assigned to the open PCNA trimer with six structural domains. Meanwhile, the closed ring with five knots corresponds to the C-terminal collar region of RFC, as observed in the crystal structures of the Escherichia coli ␥ (9) and yeast RFC (12) clamp loader complexes. Consequently, the remaining open ring in the middle of the complex should be assigned to the N-terminal AAA⫹ domains of RFC. Determination of the priDNA Termini in the Clamp-Loading Complex by the Streptavidin Labeling. In our new map, a rod-like density,
roughly ranging over a 10-nt dsDNA, is encircled by the lower six-knotted open ring, suggesting that even the DNA can be partly visualized (Fig. 1c, front and bottom). In fact, further DNA labeling experiments, using streptavidin (24), revealed the functional binding of DNA. For selective labeling, the clamploading complexes were reconstituted, using a 3⬘ recessed primed DNA consisting of a 25-nt primer and a 40-nt template strand (pri25兾40), with a biotinylated 5⬘ end on either the primer (Fig. 1b, yellow) or template strand (Fig. 1b, magenta), which was subsequently bound to streptavidin. For the 3D structure calculation of these labeled complex, the multireference refinement gave the improved 3D structures (see Methods for details). In the ss-labeled complex, the class A structure showed a clear globular density for the streptavidin, whereas the class B did not. This result indicates that the refinement successfully separated the labeled complexes from the nonlabeled ones. In the refinement for the ds-labeled complex, unexpectedly, the additional density was seen in the class B structure, whose initial model was derived from the nonlabeled complex, whereas the class A structure showed a deformed morphology. Thus, the ds-labeled complexes, with the structure similar to the nonlabeled ones, were classified into class B, and exhibited a clear globular density for streptavidin, whether or not the initial model holds additional density. The other particles grouped into class A could be heterogeneous, and thus resulted in a deformed structure. In the 3D structure of the streptavidin-labeled complex with the biotinylated 5⬘ end of the primer strand (ds-labeled complex), an additional globular density, assigned to the bound streptavidin, was observed below the rod-shaped density within the lower open ring (yellow arrows in Fig. 1d). On the other hand, in the other complex containing pri25兾40 biotinylated at the 5⬘ end of the template strand (ss-labeled complex), the same additional density was seen near the crack of the middle open ring (magenta arrows in Fig. 1d). These results strongly suggest that the DNA approaches from the open ring side and runs toward the central chamber of RFC. The 5⬘ overhang of the template strand passes through the crack of the N-terminal domains of RFC and is positioned outside of the complex, whereas the recessed 3⬘ end of the primer is located within the center of RFC (Fig. 4). Therefore, the rod-shaped density within the open PCNA should correspond to the ds region of the priDNA. This feature completely supports the DNA binding mode proposed from the yeast RFC–PCNA complex (12). Fitting of the PfuPCNA and PfuRFCS Atomic Structure. The fitting of the atomic structures of the RFCS and PCNA subunits into the density allowed us to build a reasonable model (Fig. 2 and Movie 1, which is published as supporting information on the PNAS web site). First, the three PCNA subunits were fitted into the six-knotted open ring, which holds the interface with other proteins facing to RFC. Then, the five RFCSs were fitted into the map, so that the C-terminal collar domains can be located in the five-knotted closed ring and the N-terminal AAA⫹ domains in the middle region. Although we did not perform any domain rearrangement of the subunits or molecular dynamics simulation, iteration of manual rearrangements allowed the building of a suitable atomic model without any serious steric clash between the subunits. Using the FOLDHUNTER utility (22) in EMAN, we PNAS 兩 September 27, 2005 兩 vol. 102 兩 no. 39 兩 13797
BIOCHEMISTRY
the 3D surface rendering of the nonlabeled complex was estimated from the theoretical molecular mass of the clamp-loading complex, 302.4 kDa, and an average protein density of 0.81 Da兾A3. The volumes of the labeled complexes were chosen to create surface shapes similar to that of the nonlabeled complex. The atomic coordinates of proteins, PfuRFCS chain B in the hexameric form [Protein Data Bank (PDB) ID code 1IQPB] and the PfuPCNA trimer (PDB ID code 1GE8), were interactively fitted as rigid bodies by using the 3D viewing mode of CHIMERA. An ideal B-form DNA with 11 base pairs (ATATATATATA and TATATATATAT) was fitted by using the QSEGMENT program, which is an interacting volume-segmentation tool, and the FOLDHUNTER program. To calculate the difference 3D map between the EM 3D map and the atomic model, the density value of the EM map and the 12-Å-resolution map of the atomic model, which was generated by the PDB2MRC program, were normalized to make their means of density 0 and their standard deviations 1. The difference map calculation was performed by the PROC3D program of EMAN. The simplified 3D structures shown in Fig. 4 were created by using the Volume Path Tracer tool in CHIMERA. In the 3D space, the ‘‘markers’’ were placed interactively onto the representative vertexes of every domain of the atomic coordinates. Appropriate markers were linked to each other with the sticks.
could also consistently place an 11-nt dsDNA model into the rod-shaped density, which was encircled by the lower open ring. This remarkably good fitting, which highlights the accuracy of the density assignment, convinced us that the present EM map represents the true 3D view of the archaeal RFC–PCNA–DNA ternary complex, and proved that our careful and unique approach by the combination of useful techniques for 3D reconstruction, such as image comparison by Fourier ring correlation and automatic 3D masking in the refinement process (see Methods), is effective even on the negatively stained images. The C-Terminal Domain of RFCL Is Visualized in the EM 3D Map. The overall shape of the RFC in our archaeal clamp-loading complex is similar to that of the E. coli clamp loader ␥ complex alone (Fig. 3a) (9), rather than the structure of yeast RFC complexed with PCNA (12). On the other hand, the comparison of our EM structure with the yeast RFC–PCNA complex crystal structure revealed that the archaeal and yeast clamp loaders adopt a common domain organization, including the similar shapes of the archaeal RFCL and the yeast RFC1 subunit. In our atomic model of the ternary complex, one RFCS at the edge of RFC should correspond to RFCL, considering the positions of the functionally equivalent E. coli ␦ (9) and yeast RFC1 (12) subunits in their clamp loader complexes (Fig. 2a, gold subunit, or Fig. 3c, yellow subunit). Consistent with this prediction, we found an extra density near the crack of the N-terminal domain of RFC, in a difference density map that was calculated between the EM experimental map and a map computed from the atomic structures of the PCNA and RFCSs and the DNA duplex (Fig. 2b, magenta density). This density lies at a position equivalent to that occupied by the C-terminal domain IV of yeast RFC1 (12), suggesting that it could be assigned to the C-terminal domain of RFCL and could possibly contact PCNA (Fig. 3 b and c). Thus, we believe that archaeal RFCL and yeast RFC1 share a unique extra C-terminal domain, in addition to the N-terminal crescent, which consists of three common domains in all of the clamp loader subunits. Open Clamp Structure in the Clamp-Loading Complex. The PCNA
Fig. 2. Fitting of atomic models into the EM 3D map of the clamp-loading complex. (a) Front (Upper) and back (Lower) views corresponding to Fig. 1c are shown as stereo pairs. RFCSs are colored gold, green, cyan, violet, and sky blue. The gold RFCS corresponds to RFCL. Three PCNA subunits are depicted in purple, yellow-green, and red. An 11-nt DNA duplex is fitted into the rod-like density encircled by PCNA. (b) A difference density map (see text) is shown from the front (Left) and back (Right) sides, with the meshed surface of the complex. (c) Cut-away views of the complex with the fitted atomic models. 13798 兩 www.pnas.org兾cgi兾doi兾10.1073兾pnas.0506447102
structure within the clamp-loading complex is quite remarkable, because this presents the first direct view of the open state of the clamp ring. Intriguingly, the intrinsic planarity of the PCNA trimer, observed in the crystal structure (18), is deformed to the shape of a spring washer-shaped ring (Fig. 2a). This spiral configuration allows PCNA to contact RFC through a broader interface than that in the yeast RFC–PCNA binary complex (12): The contact in the archaeal complex could involve all of the five RFC subunits, in contrast to the contribution of only three RFC subunits to the interface in the yeast complex. This RFC–PCNA interaction mode, which enables PCNA to broadly contact the N-terminal surface of RFC but cannot be achieved by its planer conformation, may be a major factor for PCNA ring opening. Notably, the spiral pitch for the PCNA and the N-terminal domains of RFC is roughly one-half (about 3 Å translation兾60° rotation) of that for the arrangement of the RFC AAA⫹ domains in the yeast RFC–PCNA complex (about 6 Å translation兾60° rotation) (12). Molecular dynamics simulation indicated that archaeal and yeast PCNA could move into a spiral structure similar to that in our clamp-loading complex (25). Even taking the 12-Å resolution limit into account, the 5-Å gap size of the open PCNA appears to be too small for at least dsDNA, and
Views 1 and 2 show the central region of the complex from the back and front. Views 3–5 are cut-away perpendicular to views 1 and 2, showing the Cterminal collar of RFC in the top (view 3) of the complex, the AAA⫹ domains of RFC in the middle (view 4), and the open clamp structure in the bottom (view 5).
Miyata et al.
possibly for ssDNA, to enter it. Therefore, there could exist other states of the ternary complexes in which PCNA opens more widely. On the other hand, we cannot exclude a possibility that PCNA first pass the ssDNA and then slides on DNA to the primed position. Possible Mechanism of the Clamp-Loading Reaction. Our present atomic model derived from EM presents the functional domain Miyata et al.
arrangements of the clamp loader and the sliding clamp, which agree well with those in the two previous x-ray structures (9, 12), implying that these three complex structures may represent static snapshots taken at different steps during a common clamploading reaction (Fig. 4). The structure of the E. coli ␥ clamp loader alone (9) would correspond to a state before the beginning of the clamp-loading reaction (Fig. 4a), whereas the yeast RFC–PCNA binary complex (12) may represent a view just after the PCNA closed onto the DNA (Fig. 4e). On the other hand, it is likely that our present RFC–PCNA–DNA ternary complex structure corresponds to an intermediate state between the above two structures (Fig. 4c). Combined with the two previously reported x-ray structures, our EM model implies the following structural and functional mechanisms. Firstly, the conformational change of the clamp loader, induced by the binding of a clamp and a DNA, may be quite small, as proposed by a FRET measurement of the E. coli clamp-loader system (26). Indeed, the shape of the archaeal RFC in our clamp-loading complex is quite similar to that of the E. coli ␥ complex alone (Fig. 4 a and b). However, in general, ATP binding to a clamp loader is essential for its functional interaction with a sliding clamp, and therefore the ATP binding should cause PNAS 兩 September 27, 2005 兩 vol. 102 兩 no. 39 兩 13799
BIOCHEMISTRY
Fig. 3. Structural comparison of the Pfu clamp-loading complex with the E. coli clamp loader ␥ complex and the yeast clamp loader– clamp binary complex. (a) The Pfu clamp-loading complex is shown by a mesh surface, and the crystal structure of the E. coli ␥ clamp loader (PDB ID code 1JR3) is depicted by a ribbon diagram. The component subunits, ␦, ␥3, ␥2, ␥1, and ␦⬘, are colored yellow, green, blue, cyan, and red, respectively. Cut-away views highlighting the collar region (view 1) and the AAA⫹ domains (view 2) are shown from the bottom. (Scale bar, 100 Å.) (b) Stereo view of a difference density map (magenta, see text), shown from the front with the fitted atomic models of the Pfu clamp-loading complex. The yellow RFCS is located within the RFCL site. An RFCS, which contacts the putative C-terminal domain of RFCL, is colored cyan. (c) The crystal structure of the yeast clamp loader– clamp complex (PDB ID code 1SXJ), shown as stereo pairs. Domains I to III of the RFC1 subunit, which corresponds to PfuRFCL, are depicted by a yellow ribbon, and domain IV is shown by a magenta space-filling model. RFC5 is colored cyan. (d) Schematic drawing of the domain organization of the RFC subunits. The domains of PfuRFCL were predicted based on their possible structural similarity to yeast RFC1.
Fig. 4. Structural comparison of clamp loaders and sliding clamps. (a, c, and e) The schematic 3D models of the E. coli ␥ clamp loader (open) alone (a), the archaeal RFC(open)–PCNA(open)–DNA ternary complex (c), and a ternary complex model based on the yeast RFC(closed)–PCNA(closed) binary complex (e). (b, d, and f ) Schematic representations showing the interaction modes among clamp loaders, sliding clamps, and DNA, corresponding to the structures (a, c, and e), respectively. These structures, derived from different protein sources and techniques, appear to represent static snapshots during a common clamp-loading mechanism conserved across the domains of life. Circles in the clamp loader complexes represent nucleotide binding states in the three structures. White circles in b show the nucleotide-empty state. Gray circles in d show ATP binding or empty states, as suggested from a biochemical analysis. Black circles and the half filled circle in f represent the ATP␥S and either ADP or ATP␥S binding states, respectively, observed in the crystal structure.
a structural change, even though it is small. To define such a small but essential structural change of the clamp loader along with the clamp-loading reactions, further precise structural studies are required. Notably, the binding of two ATP molecules to the E. coli ␥ complex has triggered no significant structural change from the nucleotide-free ‘‘inactive’’ complex, suggesting that the binding of the third ATP (the ␥ complex binds up to three ATPs) could cause a structural change of the clamp loader to an active form (27). Secondly, PCNA remains open in our structure, where the ATP has not been hydrolyzed yet, suggesting that the detachment of RFC from the ternary complex is strongly coupled with ATP hydrolysis by RFC. Notably, both the yeast binary complex and our ternary complexes lie in ATP-bound states, while they assume substantially different PCNA and RFC conformations. At the moment, the mechanism of their conformational conversion remains elusive. One possible explanation is that the RFC open–PCNA open state (our archaeal complex, Fig. 4 c and d) could be transformed to the RFC closed–PCNA closed state (the yeast complex, Fig. 4 e and f ) by the consumption of very little energy. Our EM view and the yeast RFC–PCNA complex structure may reflect distinct scenes, which happened to selectively trap various nucleotide-bound states, depending on the sample preparation and兾or mutations in the arginine finger of the RFC subunits. It may also be possible that the conversion between the two states depends on the stronger affinity of RFC for DNA than for PCNA, while the functional conversion appears to be coupled with the hydrolysis of some bound ATP molecules and possibly with the recognition of the 3⬘ ends of the primer strands by RFC. For instance, upon binding to PCNA, RFC could convert the closed PCNA ring to an open form, while
RFC retains essentially the same conformation. Then, the interaction of RFC with a primed DNA may induce its conformational change to adjust to the DNA spiral. In the yeast model, ⬇10 base pairs of the DNA duplex could be involved in the interaction with the RFC subunits. On the other hand, in our present model, RFC appears to contact four base pairs or less on its central chamber. From the present 3D map, determined at a medium resolution, it is uncertain whether RFC contacts the 3⬘ end of the primer, although in the current atomic model the dsDNA region may be slightly short for RFC to interact with the 3⬘ end of the primer. Subsequently, PCNA may reduce its extensive contact with RFC and regain its planer ring form, thereby completing the topological link to DNA (Movie 2, which is published as supporting information on the PNAS web site). In the entire course of this reaction, the C-terminal collar region of RFC could retain its firm pentameric ring structural base, to allow the clamp-loading reaction to proceed smoothly without RFC subunit separation. The crucial, but elusive, question is the true role of ATP hydrolysis during the clamp-loading event. At the moment, it is not possible for us to propose a unified model that can account for all of the reported data about ATP hydrolysis. Further progress will be required for a more precise understanding of the clamp-loading mechanism.
1. Waga, S. & Stillman, B. (1998) Annu. Rev. Biochem. 67, 721–751. 2. Tsurimoto, T. & Stillman, B. (1991) J. Biol. Chem. 266, 1950–1960. 3. Cai, J., Yao, N., Gibbs, E., Finkelstein, J., Phillips, B., O’Donnell, M. & Hurwitz, J. (1998) Proc. Natl. Acad. Sci. USA 95, 11607–11612. 4. Turner, J., Hingorani, M. M., Kelman, Z. & O’Donnell, M. (1999) EMBO J. 18, 771–783. 5. Cann, I. K., Ishino, S., Yuasa, M., Daiyasu, H., Toh, H. & Ishino, Y. (2001) J. Bacteriol. 183, 2614–2623. 6. Gomes, X. V. & Burgers, P. M. (2001) J. Biol. Chem. 276, 34768–34775. 7. Dionne, I., Nookala, R. K., Jackson, S. P., Doherty, A. J. & Bell, S. D. (2003) Mol. Cell 11, 275–282. 8. Seybert, A. & Wigley, D. B. (2004) EMBO J. 23, 1360–1371. 9. Jeruzalmi, D., O’Donnell, M. & Kuriyan, J. (2001) Cell 106, 429–441. 10. Jeruzalmi, D., Yurieva, O., Zhao, Y., Young, M., Stewart, J., Hingorani, M., O’Donnell, M. & Kuriyan, J. (2001) Cell 106, 417–428. 11. Oyama, T., Ishino, Y., Cann, I. K., Ishino, S. & Morikawa, K. (2001) Mol. Cell 8, 455–463. 12. Bowman, G. D., O’Donnell, M. & Kuriyan, J. (2004) Nature 429, 724–730. 13. Trakselis, M. A. & Benkovic, S. J. (2001) Structure 9, 999–1004. 14. Bowman, G. D., Goedken, E. R., Kazmirski, S. L., O’Donnell, M. & Kuriyan, J. (2005) FEBS Lett. 579, 863–867. 15. Jeruzalmi, D., O’Donnell, M. & Kuriyan, J. (2002) Curr. Opin. Struct. Biol. 12, 217–224.
16. Neuwald, A. F., Aravind, L., Spouge, J. L. & Koonin, E. V. (1999) Genome Res. 9, 27–43. 17. Miyata, T., Oyama, T., Mayanagi, K., Ishino, S., Ishino, Y. & Morikawa, K. (2004) Nat. Struct. Mol. Biol. 11, 632–636. 18. Matsumiya, S., Ishino, Y. & Morikawa, K. (2001) Protein Sci. 10, 17–23. 19. Ludtke, S. J., Baldwin, P. R. & Chiu, W. (1999) J. Struct. Biol. 128, 82–97. 20. Ludtke, S. J., Jakana, J., Song, J. L., Chuang, D. T. & Chiu, W. (2001) J. Mol. Biol. 314, 253–262. 21. Brink, J., Ludtke, S. J., Kong, Y., Wakil, S. J., Ma, J. & Chiu, W. (2004) Structure 12, 185–191. 22. Jiang, W., Baker, M. L., Ludtke, S. J. & Chiu, W. (2001) J. Mol. Biol. 308, 1033–1044. 23. Pettersen, E. F., Goddard, T. D., Huang, C. C., Couch, G. S., Greenblatt, D. M., Meng, E. C. & Ferrin, T. E. (2004) J. Comput. Chem. 25, 1605–1612. 24. Poglitsch, C. L., Meredith, G. D., Gnatt, A. L., Jensen, G. J., Chang, W. H., Fu, J. & Kornberg, R. D. (1999) Cell 98, 791–798. 25. Kazmirski, S. L., Zhao, Y., Bowman, G. D., O’Donnell, M. & Kuriyan, J. (2005) Proc. Natl. Acad. Sci. USA 102, 13801–13806. 26. Goedken, E. R., Levitus, M., Johnson, A., Bustamante, C., O’Donnell, M. & Kuriyan, J. (2004) J. Mol. Biol. 336, 1047–1059. 27. Kazmirski, S. L., Podobnik, M., Weitze, T. F., O’Donnell, M. & Kuriyan, J. (2004) Proc. Natl. Acad. Sci. USA 101, 16750–16755.
13800 兩 www.pnas.org兾cgi兾doi兾10.1073兾pnas.0506447102
We thank Dr. S. Ishino for assistance with sample preparation and Dr. K. Namba for discussion about the EM data interpretation. This work was partly supported by a research grant endorsed by the New Energy and Industrial Technology Development Organization. Y.I. was supported by the Human Frontier Science Program. K. Mayanagi was supported by CREST, Japan Science and Technology Agency.
Miyata et al.