TCRP Web-Only Document 30 (Project D-8)/ NCHRP Web-Only Document 91 (Project 3-71): Contractor’s Final Report – Appendices B to O
Improving Pedestrian Safety at Unsignalized Crossings Appendices B to O
Prepared for: Transit Cooperative Research Program National Cooperative Highway Research Program
Submitted by: Kay Fitzpatrick, Shawn Turner, Marcus Brewer, Paul Carlson, Brooke Ullman, Nada Trout, Eun Sug Park, Jeff Whitacre, Texas Transportation Institute, College Station, Texas and Nazir Lalani, Traffex Engineers, Inc., Ventura, California and Dominique Lord, Texas A&M University, College Station, Texas
March 2006
ACKNOWLEDGMENT This work was sponsored by the Federal Transit Administration (FTA) in cooperation with the Transit Development Corporation (TDC) and the American Association of State Highway and Transportation Officials (AASHTO) in cooperation with the Federal Highway Administration (FHWA). It was conducted through the Transit Cooperative Research Program (TCRP) and the National Cooperative Highway Research Program (NCHRP), which are administered by the Transportation Research Board (TRB) of the National Academies.
COPYRIGHT PERMISSION Authors herein are responsible for the authenticity of their materials and for obtaining written permissions from publishers or persons who own the copyright to any previously published or copyrighted material used herein. Cooperative Research Programs (CRP) grants permission to reproduce material in this publication for classroom and not-for-profit purposes. Permission is given with the understanding that none of the material will be used to imply TRB, AASHTO, FAA, FHWA, FMCSA, FTA, or TDC endorsement of a particular product, method, or practice. It is expected that those reproducing the material in this document for educational and not-for-profit uses will give appropriate acknowledgment of the source of any reprinted or reproduced material. For other uses of the material, request permission from CRP.
DISCLAIMER The opinion and conclusions expressed or implied in the report are those of the research agency. They are not necessarily those of the TRB, the National Research Council, the FTA, TDC, AASHTO, or the U.S. Government. This material has not been edited by TRB.
The National Academy of Sciences is a private, nonprofit, self-perpetuating society of distinguished scholars engaged in scientific and engineering research, dedicated to the furtherance of science and technology and to their use for the general welfare. On the authority of the charter granted to it by the Congress in 1863, the Academy has a mandate that requires it to advise the federal government on scientific and technical matters. Dr. Ralph J. Cicerone is president of the National Academy of Sciences. The National Academy of Engineering was established in 1964, under the charter of the National Academy of Sciences, as a parallel organization of outstanding engineers. It is autonomous in its administration and in the selection of its members, sharing with the National Academy of Sciences the responsibility for advising the federal government. The National Academy of Engineering also sponsors engineering programs aimed at meeting national needs, encourages education and research, and recognizes the superior achievements of engineers. Dr. William A. Wulf is president of the National Academy of Engineering. The Institute of Medicine was established in 1970 by the National Academy of Sciences to secure the services of eminent members of appropriate professions in the examination of policy matters pertaining to the health of the public. The Institute acts under the responsibility given to the National Academy of Sciences by its congressional charter to be an adviser to the federal government and, on its own initiative, to identify issues of medical care, research, and education. Dr. Harvey V. Fineberg is president of the Institute of Medicine. The National Research Council was organized by the National Academy of Sciences in 1916 to associate the broad community of science and technology with the Academy’s purposes of furthering knowledge and advising the federal government. Functioning in accordance with general policies determined by the Academy, the Council has become the principal operating agency of both the National Academy of Sciences and the National Academy of Engineering in providing services to the government, the public, and the scientific and engineering communities. The Council is administered jointly by both the Academies and the Institute of Medicine. Dr. Ralph J. Cicerone and Dr. William A. Wulf are chair and vice chair, respectively, of the National Research Council. The Transportation Research Board is a division of the National Research Council, which serves the National Academy of Sciences and the National Academy of Engineering. The Board’s mission is to promote innovation and progress in transportation through research. In an objective and interdisciplinary setting, the Board facilitates the sharing of information on transportation practice and policy by researchers and practitioners; stimulates research and offers research management services that promote technical excellence; provides expert advice on transportation policy and programs; and disseminates research results broadly and encourages their implementation. The Board's varied activities annually engage more than 5,000 engineers, scientists, and other transportation researchers and practitioners from the public and private sectors and academia, all of whom contribute their expertise in the public interest. The program is supported by state transportation departments, federal agencies including the component administrations of the U.S. Department of Transportation, and other organizations and individuals interested in the development of transportation. www.TRB.org www.national-academies.org
TABLE OF CONTENTS TABLE OF CONTENTS................................................................................................................. i LIST OF TABLES......................................................................................................................... vi LIST OF FIGURES ..................................................................................................................... viii ACKNOWLEDGMENTS .............................................................................................................. x ABSTRACT.................................................................................................................................. xii APPENDIX B PROPOSED CHANGES TO MUTCD ................................................................ 1 PROPOSED CHANGE I – PEDESTRIAN SIGNAL WARRANT........................................... 1 PROPOSED CHANGE II – ADD ALTERNATIVE ................................................................. 5 PROPOSED CHANGE III – ADD PEDESTRIAN BEACON.................................................. 6 APPENDIX C LITERATURE REVIEW OF PEDESTRIAN CROSSING TREATMENTS AT UNCONTROLLED LOCATIONS .................................................................................. 18 TRAFFIC SIGNAL AND RED BEACON DISPLAY ............................................................ 19 Half-Signals or Adapted Half-Signals (e.g., HAWK) .......................................................... 19 Automated Pedestrian Detection........................................................................................... 20 Pedestrian Countdown Indication ......................................................................................... 21 SIGNING AND PAVEMENT MARKING ............................................................................. 22 Multiple Treatments.............................................................................................................. 22 Flashing Signals or Beacons ................................................................................................. 23 In-Roadway Warning Lights at Crosswalks ......................................................................... 24 Motorist Warning Signs........................................................................................................ 27 Advance Yield/Stop Line...................................................................................................... 28 “Animated Eyes” Display ..................................................................................................... 29 Crosswalk Pavement Markings............................................................................................. 29 Pedestrian Warning Signs and Markings.............................................................................. 31 GENERAL DESIGN ................................................................................................................ 32 Median Refuge Islands ......................................................................................................... 32 ENFORCEMENT..................................................................................................................... 33 APPENDIX D PEDESTRIAN CROSSING TREATMENTS ................................................... 34 SUMMARY OF ITE INFORMATIONAL REPORT.............................................................. 34 Treatments at Major Street Crossings at Uncontrolled Locations ........................................ 34 Midblock Signal-Controlled Crossings for Pedestrians........................................................ 44 NEW CROSSING TREATMENTS ......................................................................................... 48 Staggered Crosswalks with Speed Monitoring Signs in Phoenix, Arizona .......................... 48 Pedestrian-Activated Beacons and Lights in Salt Lake City, Utah ...................................... 50 Triple-Four High-Visibility Markings in Sacramento, California........................................ 51 Five-Bar Triangle Advance Crosswalk Pavement Markings in Salt Lake City, Utah.......... 52 In-Roadway Signs at Michigan State University, East Lansing, Michigan.......................... 52 Crosshatched Crosswalk Markings in Arcadia, California................................................... 53 Overhead Animated Eye Display at Midblock Crossings .................................................... 53 Midblock Crosswalk with Overhead Signs and Pedestrian Refuge Island........................... 54 Midblock Crosswalk with High-Visibility Markings, Pedestrian Refuge Island, and InPavement Flashing Markers.................................................................................................. 55 Crosswalk with Double-Piano Type Markings..................................................................... 56 In-Roadway Signs at Crosswalks in New York State........................................................... 57 i
TREATMENTS USED IN EUROPE....................................................................................... 57 Midblock Crossing in Frankfurt, Germany........................................................................... 57 Painted Midblock Crossing in Stockholm, Sweden.............................................................. 58 Midblock Crossing near Copenhagen, Denmark .................................................................. 58 Midblock Crossing with Refuge Island in the U.K............................................................... 59 Midblock Crossing with Refuge Island in the Netherlands .................................................. 61 COMMENTS ON UNCONTROLLED CROSSINGS AND MIDBLOCK SIGNAL TREATMENTS ............................................................................................................ 61 In-Roadway Signs................................................................................................................. 61 In-Pavement Flashing Markers ............................................................................................. 61 Pedestrian Refuge Islands ..................................................................................................... 62 Smart Crosswalks with Activated Flashing Beacons/Overhead Sign Legends .................... 62 Midblock Signals .................................................................................................................. 62 Pelican Crossings and Midblock Signals with Flashing Red................................................ 62 Midblock Signals .................................................................................................................. 63 Intersection Pedestrian Signals (Also Called Half-Signals) ................................................. 63 Puffins and Toucans.............................................................................................................. 63 HAWKS................................................................................................................................ 63 CONCLUSIONS ...................................................................................................................... 64 APPENDIX E SUMMMARY OF PEDESTRIAN CROSSING TREATMENT EVALUATIONS .............................................................................................................. 65 APPENDIX F PEDESTRIAN CROSSING INSTALLATION GUIDELINES ........................ 76 NEW ZEALAND ..................................................................................................................... 91 AUSTRALIA............................................................................................................................ 91 Major Traffic Control Items.................................................................................................. 91 Minor Traffic Control Items ................................................................................................. 91 Pedestrian Crossings without Flashing Lights...................................................................... 92 SUMMARY.............................................................................................................................. 94 PEDESTRIAN CROSSING INSTALLATION CRITERIA.................................................... 95 APPENDIX G INTERNATIONAL SIGNAL WARRANTING PRACTICES........................ 103 UNITED KINGDOM ............................................................................................................. 104 CANADA ............................................................................................................................... 104 SOUTH AFRICA ................................................................................................................... 120 AUSTRALIA.......................................................................................................................... 120 APPENDIX H ADEQUACY OF PEDESTRIAN SIGNAL WARRANT ............................... 125 BASIS OF THE PEDESTRIAN SIGNAL WARRANT........................................................ 125 CRITIQUE OF THE PEDESTRIAN SIGNAL WARRANT................................................. 128 Primary and Secondary Factors .......................................................................................... 129 Pedestrian Volume .............................................................................................................. 130 Distance to Nearest Traffic Signal...................................................................................... 131 Reduction Criteria Based on Walking Speeds .................................................................... 131 POTENTIAL FACTORS ....................................................................................................... 132 Pedestrian Generators (Transit Stops) ................................................................................ 132 School Warrant ................................................................................................................... 132 Crash Experience ................................................................................................................ 133 Counting Pedestrians on the Minor Approach with Vehicular and Bicycle Volumes ....... 133
ii
Vehicle Speed ..................................................................................................................... 134 Pedestrian Delay ................................................................................................................. 134 USAGE OF THE PEDESTRIAN SIGNAL WARRANT...................................................... 135 CONCLUSIONS .................................................................................................................... 135 APPENDIX I SUGGESTED ISSUES TO CONSIDER WHEN REVISING THE PEDESTRIAN SIGNAL WARRANT ........................................................................... 137 PREVIOUS EFFORT ............................................................................................................. 137 CURRENT EFFORT.............................................................................................................. 138 SITE SELECTION ................................................................................................................. 138 WORKSHOP .......................................................................................................................... 138 FINDINGS.............................................................................................................................. 143 Site 1 ................................................................................................................................... 143 Site 2 ................................................................................................................................... 143 Site 4 ................................................................................................................................... 143 Site 5 ................................................................................................................................... 144 Site 6 ................................................................................................................................... 144 Site 7 ................................................................................................................................... 145 Site 8 ................................................................................................................................... 145 Follow-On Discussion ........................................................................................................ 145 CONCLUSIONS .................................................................................................................... 146 APPENDIX J SURVEY OF PROVIDERS.............................................................................. 148 METHODOLOGY ................................................................................................................. 148 FOCUS GROUPS OF PROVIDERS ..................................................................................... 148 Key Findings....................................................................................................................... 151 PHONE MEETINGS.............................................................................................................. 153 ON-SITE INTERVIEWS ....................................................................................................... 153 Portland, Oregon ................................................................................................................. 154 Kirkland, Washington ......................................................................................................... 155 Redmond, Washington........................................................................................................ 157 Bellveue, Washington ......................................................................................................... 158 Seattle, Washington ............................................................................................................ 158 Los Angeles, California ...................................................................................................... 159 Phoenix, Arizona................................................................................................................. 161 Tucson, Arizona.................................................................................................................. 161 FOCUS GROUP OF BUS DRIVERS .................................................................................... 162 Methodology ....................................................................................................................... 163 Summary of Responses....................................................................................................... 165 Key Findings from Bus Driver Focus Group...................................................................... 167 APPENDIX K ON-STREET PEDESTRIAN SURVEYS ........................................................ 168 SURVEY DESIGN................................................................................................................. 168 SURVEY PROTOCOL .......................................................................................................... 169 PEDESTRIAN CROSSING TREATMENT DESCRIPTIONS............................................. 170 Marked Crosswalk Treatment............................................................................................. 170 In-Roadway Warning Lights Treatment ............................................................................. 171 HAWK Crossing Treatment ............................................................................................... 172 Split Midblock Signal Treatment........................................................................................ 172 iii
Countdown Display with Signal ......................................................................................... 174 FINDINGS.............................................................................................................................. 175 Marked Crosswalk .............................................................................................................. 175 In-Roadway Warning Lights............................................................................................... 177 HAWK ................................................................................................................................ 177 Split Midblock Signal ......................................................................................................... 178 Countdown Indication at a Signalized Intersection ............................................................ 179 Comparison of Selected Findings ....................................................................................... 180 CONCLUSIONS .................................................................................................................... 181 APPENDIX L MOTORIST COMPLIANCE TO ENGINEERING TREATMENTS AT MARKED CROSSWALKS ........................................................................................... 183 APPENDIX SUMMARY ....................................................................................................... 183 INTRODUCTION .................................................................................................................. 183 BACKGROUND .................................................................................................................... 184 STUDY METHODOLOGY ................................................................................................... 185 Experimental Design........................................................................................................... 185 Study Sites .......................................................................................................................... 186 Descriptions of Crossing Treatments.................................................................................. 186 Data Collection Protocol..................................................................................................... 188 Data Reduction and Analysis.............................................................................................. 188 FINDINGS AND DISCUSSION............................................................................................ 189 Summary of Motorist Yielding Rates ................................................................................. 189 Significant Differences in Treatment Effectiveness ........................................................... 192 Street Characteristics that Influence Treatment Effectiveness ........................................... 194 CONCLUSIONS .................................................................................................................... 198 RECOMMENDATIONS........................................................................................................ 198 APPENDIX M WALKING SPEED......................................................................................... 200 INTRODUCTION .................................................................................................................. 200 PREVIOUS WORK................................................................................................................ 200 Source of MUTCD Walking Speed..................................................................................... 200 Pedestrian Walking Speed .................................................................................................. 200 TCRP/NCHRP FIELD STUDY FINDINGS.......................................................................... 204 Pedestrian Walking Speed by Age Groups......................................................................... 204 Age Group Comparison ...................................................................................................... 208 Statistical Evaluations of Available Variables.................................................................... 208 Comparison of Walking Speeds by Type of Pedestrian Treatment.................................... 210 Comparison of Walking Speed between Initial Crossing Stage and Second Crossing Stage ............................................................................................................................................. 212 When a Median is Present................................................................................................... 212 Practical Differences........................................................................................................... 213 COMPARISON OF TCRP/NCHRP FINDINGS WITH PREVIOUS WORK...................... 215 FUTURE PROJECTIONS...................................................................................................... 217 SUMMARY AND CONCLUSIONS ..................................................................................... 217 APPENDIX N GAP ACCEPTANCE....................................................................................... 219 INTRODUCTION .................................................................................................................. 219 BACKGROUND .................................................................................................................... 219
iv
DATA COLLECTION ........................................................................................................... 221 DATA REDUCTION ............................................................................................................. 221 ANALYSIS............................................................................................................................. 223 Behavioral Analysis ............................................................................................................ 223 Statistical Analysis.............................................................................................................. 227 FINDINGS.............................................................................................................................. 229 COMPARISON OF OBSERVED AND CRITICAL GAPS.................................................. 231 CONCLUSIONS .................................................................................................................... 232 APPENDIX O GUIDELINES DEVELOPMENT.................................................................... 233 WHAT SHOULD THE BASIC FORMAT BE FOR A PEDESTRIAN SIGNAL WARRANT? .................................................................................................................................... 233 WHAT SHOULD THE CRITERIA BE FOR NUMBER OF PEDESTRIANS FOR CONSIDERATION OF A SIGNAL?......................................................................... 234 AT WHAT POSTED SPEED OR 85TH PERCENTILE SPEED VALUE SHOULD THE USER BE DIRECTED TO A SET OF REDUCED VALUES? ................................ 237 COUNT HIGHEST OR BOTH APPROACHES? ................................................................. 237 WHAT SHOULD BE THE MINIMUM PEDESTRIAN VOLUME? ................................... 238 WHAT SHOULD BE THE ASSUMED WALKING SPEED FOR THE GUIDELINES? ... 238 HOW SHOULD CROSSING DISTANCE BE CONSIDERED?.......................................... 238 SHOULD PEDESTRIAN DELAY BE CONSIDERED, AND IF SO, HOW? ..................... 238 HOW DOES COMPLIANCE FIT WITH THE GUIDELINES? ........................................... 239 WILL “TOO MANY SIGNALS” RESULT FROM THE PROPOSED GUIDELINES? ...... 239 Sources of Data ................................................................................................................... 240 Findings............................................................................................................................... 240 Comments ........................................................................................................................... 242 WHAT CHANGES WOULD PRACTITIONERS MAKE TO THE DRAFT GUIDELINES? .................................................................................................................................... 243 Findings from Survey ......................................................................................................... 243 SUMMARY............................................................................................................................ 246 REFERENCES ........................................................................................................................... 247
v
LIST OF TABLES TABLE C-1. Basic Categories of Pedestrian Crossing Treatments. ............................................ 18 TABLE C-2. Evaluation Results of In-Roadway Warning Lights in California (18). ................. 25 TABLE C-3. Evaluation Results of In-Roadway Warning Lights in Kirkland, Washington (19). ........................................................................................................................................... 25 TABLE C-4. Effectiveness of Pedestrian Treatments at Unsignalized Locations (26)................ 28 TABLE C-5. Percentage of Pedestrians Looking for Threats at Signalized Intersections (41). .. 32 TABLE D-1. Summary of Treatments for Major Street Crossings at Uncontrolled Locations. .. 36 TABLE D-2. Summary of Midblock Signal-Controlled Crossings for Pedestrians..................... 45 TABLE E-1. Summary of Pedestrian Crossing Treatment Evaluations....................................... 65 TABLE F-1. Guidelines for Marked Crosswalk Installation (for Uncontrolled Intersections) (31).................................................................................................................................... 79 TABLE F-2. Guidelines for the Installation of Marked Crosswalks Used in San Luis Obispo, California. ......................................................................................................................... 80 TABLE F-3. Guidelines for the Installation of Pedestrian Crossing Treatments for Sacramento, California – Two-Lane Streets.......................................................................................... 83 TABLE F-4. Guidelines for the Installation of Pedestrian Crossing Treatments for Sacramento, California – Three-Lane Streets........................................................................................ 83 TABLE F-5. Guidelines for the Installation of Pedestrian Crossing Treatments for Sacramento, California – Four or More Lanes with a Raised Median. ................................................. 84 TABLE F-6. Guidelines for the Installation of Pedestrian Crossing Treatments for Sacramento, California – Four or More Lanes without a Raised Median. ............................................ 84 TABLE F-7. Equivalent Adult Units (93). ................................................................................... 85 TABLE F-8. Community Size Adjustment Factor (93)................................................................ 86 TABLE F-9. Guidelines for the Selection of Appropriate Midblock Pedestrian Facilities According to Road Classification (96). ............................................................................ 92 TABLE F-10. Guidelines for the Installation of Pedestrian Crossings without Flashing Lights. 93 TABLE F-11. Summary of Pedestrian Treatment Guidelines – Signals. ..................................... 96 TABLE F-12. Summary of Pedestrian Treatment Guidelines – Marked Crosswalk. .................. 98 TABLE F-13. Summary of Pedestrian Treatment Guidelines – Other Treatment Types. ......... 101 TABLE G-1. Pedestrian Warranting Factors.............................................................................. 103 TABLE H-1. Evolution of the Pedestrian Warrant Criteria. ...................................................... 126 TABLE H-2. Comparison of Vehicle and Pedestrians Threshold Values.................................. 131 TABLE H-3. Critical Gaps for Vehicle and Pedestrian at an Unsignalized Intersection. .......... 133 TABLE H-4. Reproduction of HCM Exhibit 18-13: LOS Criteria for Pedestrians at Unsignalized Intersections. ................................................................................................................... 135 TABLE I-1. Intersection Characteristics and Warrant Analysis Results.................................... 140 TABLE J-1. Typical Questions Used in Focus Groups of Providers and On-Site Interviews. .. 149 TABLE J-2. Focus Group Participants. ...................................................................................... 150 TABLE J-3. Cities and Agencies Contacted............................................................................... 153 TABLE J-4. Agency Interviews. ................................................................................................ 154 TABLE J-5. Participant Information. ......................................................................................... 163 TABLE K-1. Treatment Characteristics. .................................................................................... 169 TABLE K-2. Demographics for Seven Sites.............................................................................. 176 TABLE K-3. Results of Perceived Pedestrian Delay Thresholds (%)........................................ 180
vi
TABLE L-1. Summary of Motorist Yielding at Innovative Pedestrian Crossing Treatments. .. 185 TABLE L-2. Summary of Study Sites........................................................................................ 187 TABLE L-3. Summary of Motorist Yielding Compliance from Three Sources for Red Signal or Beacon and Active When Present................................................................................... 191 TABLE L-4. Summary of Motorist Yielding Compliance from Three Sources for Enhanced and/or High Visibility Treatments. ................................................................................. 192 TABLE M-1. Knoblauch et al. (118) Findings on Walking Speeds at Signalized Intersections for Pedestrians Who Complied with the Pedestrian Signal Indication................................. 202 TABLE M-2. Intersection Crossing Speeds of Pedestrians with and without Walking Difficulty ()...................................................................................................................................... 204 TABLE M-3. Mean Walking Speeds for Disabled Pedestrians and Users of Various Assistive Devices (129). ................................................................................................................. 204 TABLE M-4. Walking Speed by Age Group. ............................................................................ 206 TABLE M-5. Walking Speed by Gender and Age Group.......................................................... 206 TABLE M-6. F-Test Results for Gender and Age Group Walking Speed Comparisons........... 208 TABLE M-7. Analysis of Covariance for Walking Speed for Younger Age Group. ................ 209 TABLE M-8. Analysis of Covariance for Walking Speed for Older Age Group. ..................... 210 TABLE M-9. Result of Tukey’s HSD Multiple Comparisons for Treatment Based on the Model in Table M-7. .................................................................................................................. 211 TABLE M-10. Result of Tukey’s HSD Multiple Comparisons for Treatment Based on the Model in Table M-8. ....................................................................................................... 211 TABLE M-11. Walking Speed by Treatment Category, Gender, and Age Groups. .................. 212 TABLE M-12. F-Test Results for Treatment Category, Gender and Age Group Walking Speed Comparisons. .................................................................................................................. 212 TABLE M-13. Walking Speed by Crossing Stage, Gender, and Age Groups for those Sites with Medians........................................................................................................................... 213 TABLE M-14. F-Test Results for Crossing Stage, Gender, and Age Group Walking Speed Comparisons. .................................................................................................................. 213 TABLE M-15. Walking Speed by Age Groups for Knoblauch et al. () and TCRP/NCHRP Studies............................................................................................................................. 215 TABLE M-16. Representative 15th Percentile Walking Speed for Future Years....................... 217 TABLE N-1. Characteristics for Each Approach. ...................................................................... 223 TABLE N-2. Results of SAS Logistic Analysis for Approaches with More Than 20 Pedestrians. ......................................................................................................................................... 229 TABLE N-3. Summary of Gap Distribution for Approaches with Separation of Data.............. 231 TABLE O-1. Equations for the Signal Warrant Curves ().......................................................... 237 TABLE O-2. Comparison of Guidelines to Existing Treatments............................................... 241 TABLE O-3. Number of Crossings Where Signals Are To Be Considered............................... 242 TABLE O-4. Number of Crossings Where a Red Device Is To Be Considered. ....................... 242 TABLE O-5. Responses from Survey Questions. ...................................................................... 244
vii
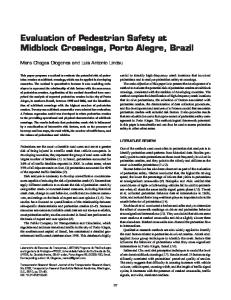
LIST OF FIGURES Figure B-1. Proposed MUTCD Figure 4C-4. Warrant 4, Four-Hour Volume ............................. 3 Figure B-2. Proposed MUTCD Figure 4C-5. Warrant 4, Four-Hour Volume (70% Factor) ....... 3 Figure B-3. Proposed MUTCD Figure 4C-6. Warrant 4, Peak Hour ........................................... 4 Figure B-4. Proposed MUTCD Figure 4C-7. Warrant 4, Peak Hour (70% Factor) ...................... 4 Figure B-5. Proposed MUTCD Figure 4M-1. Example of Sequence for a Pedestrian Beacon. ... 7 Figure B-6. Proposed MUTCD Figure 2B-19 Traffic Signal Signs. ............................................ 17 Figure D-1. Pedestrian Crossing Using Traditional Treatments................................................... 34 Figure D-2. Staggered Crosswalk in Phoenix, Arizona................................................................ 49 Figure D-3. Staggered Crosswalk in the Las Vegas Area of Nevada........................................... 50 Figure D-4. Pedestrian-Activated Flashing Beacons in Salt Lake City, Utah. ............................. 50 Figure D-5. Pedestrian-Activated Beacons with Light Illumination in Salt Lake City, Utah. ..... 51 Figure D-6. Triple-Four High-Visibility Markings in Sacramento, California. ........................... 52 Figure D-7. Five-Bar Triangle Advance Crosswalk Pavement Markings in Salt Lake City, Utah. ........................................................................................................................................... 52 Figure D-8. In-Roadway Sign Type in East Lansing, Michigan (77)........................................... 53 Figure D-9. Crosshatched Crosswalk Markings in Arcadia, California. ...................................... 53 Figure D-10. Overhead Animated Eye Display in the Puget Sound Area, Washington. ............. 54 Figure D-11. Midblock Crosswalk with Overhead Signs and Pedestrian Refuge Island. ............ 54 Figure D-12. Midblock Crosswalk with Overhead Signs, Pedestrian Refuge Island, and Curb Extensions. ........................................................................................................................ 55 Figure D-13. Midblock Crosswalk with Median Refuge Island and In-Pavement Flashing Markers. ............................................................................................................................ 55 Figure D-14. Crosswalk with Double Piano Style Markings in New York State......................... 56 Figure D-15. In-Roadway Signs at Crosswalks in New York State. ............................................ 57 Figure D-16. Midblock Crossing in Frankfurt, Germany. ............................................................ 58 Figure D-17. Painted Raised Crosswalk in Stockholm, Sweden. ................................................. 58 Figure D-18. Midblock Crossing in Copenhagen, Denmark. ....................................................... 59 Figure D-19. Midblock Crossing with Raised Crosswalk in Copenhagen, Denmark. ................. 59 Figure D-20. Midblock Crossing with Refuge Island in the U.K................................................. 60 Figure D-21. Midblock Crossing with Refuge Island and Color-Treated Median in the U.K. .... 60 Figure D-22. Midblock Crossing with Refuge Island in the Netherlands. ................................... 61 Figure F-1. Guidelines for Installing Crosswalks at Uncontrolled and Midblock Crossings (90). ........................................................................................................................................... 77 Figure F-2. Warrant Model Flow Chart (adapted from 93). ......................................................... 85 Figure F-3. Estimated Crossing Opportunities for a Two-Lane Cross Section (93). ................... 87 Figure F-4. Estimated Crossing Opportunities for a Four-Lane Cross Section (93). ................... 87 Figure F-5. Estimated Crossing Opportunities for a Six-Lane Cross Section (93). ..................... 88 Figure F-6. Estimated Crossing Opportunities for a Three-Lane One-way Cross Section (93)... 88 Figure F-7. Pedestrian Crossing Control Warrant Chart (93)....................................................... 89 Figure H-1. Current Pedestrian Signal Warrant (1). ................................................................... 127 Figure I-1. Photographs of Site 7................................................................................................ 139 Figure I-2. Warrant 2 and 3 Plot for Site 7. ................................................................................ 139 Figure I-3. Site Questionnaire..................................................................................................... 141 Figure I-4. Wrap-Up Questionnaire............................................................................................ 142
viii
Figure J-1. Preference of Focus Group Participants for Pedestrian Crossing Treatments at Unsignalized Intersections. ............................................................................................. 150 Figure J-2. Preference of Focus Group Participants for Pedestrian Crossing Treatments at Midblock Locations. ....................................................................................................... 151 Figure J-3. Examples of Treatments in Portland. ....................................................................... 155 Figure J-4. Example of Treatments in Kirkland. ........................................................................ 156 Figure J-5. Examples of Treatments in Redmond. ..................................................................... 157 Figure J-6. Examples of Treatments in Bellevue........................................................................ 158 Figure J-7. Example of an Intersection Pedestrian Signal in Seattle. ......................................... 159 Figure J-8. Examples of Treatments in Los Angeles.................................................................. 160 Figure J-9. Example of Treatments Used near a Phoenix School............................................... 161 Figure J-10. Examples of Treatments in Tucson. ....................................................................... 162 Figure K-1. Marked Crosswalk Treatments at Sites 1 and 2. ..................................................... 170 Figure K-2. In-Roadway Warning Lights Treatment at Site 3. .................................................. 171 Figure K-3. HAWK Treatment at Site 4..................................................................................... 172 Figure K-4. Split Midblock Signal Crossing at Sites 5 and 6..................................................... 173 Figure K-5. Countdown Pedestrian Signal. ................................................................................ 174 Figure K-6. Average Pedestrian Safety Ratings. ........................................................................ 181 Figure L-1. Site Average and Range for Motorist Yielding by Crossing Treatment. ................ 193 Figure L-2. Motorist Yielding by Crossing Treatment and Number of Lanes. .......................... 195 Figure L-3. Motorist Yielding by Crossing Treatment and Posted Speed Limit........................ 197 Figure M-1. Walking Speed Distribution by Age Group. .......................................................... 207 Figure M-2. Older than 60 (Old) and 60 and Younger than 60 (Young) Walking Speed Distribution. .................................................................................................................... 207 Figure M-3. Walking Speed by Crossing Characteristic. ........................................................... 214 Figure M-4. Comparison of Findings from Previous Studies for 15th Percentile Walking Speed (Labels Contain Year of Study, Authors or Abbreviation of Title, and Characteristics of Study if Relevant). .......................................................................................................... 216 Figure N-1. Definition of Gap Length. ....................................................................................... 221 Figure N-2. Sample of Gap Acceptance Data............................................................................. 222 Figure N-3. Pedestrian Waiting to Cross at Crosswalk with High Traffic Volumes.................. 225 Figure N-4. Pedestrian Crossing First Lane of Approach Using a “Rolling Gap.” .................... 226 Figure N-5. Pedestrian Crossing Second Lane of Approach Using a “Rolling Gap.”................ 227 Figure N-6. Sample Cumulative Distribution of Gap Acceptance. ............................................ 228 Figure N-7. Cumulative Distribution of Gap Acceptance with Separation of Data. .................. 230 Figure N-8. Comparison of Trends for Observed 85th Percentile Accepted Gaps and Calculated Critical Gaps for Walking Speeds of 3.0, 3.5, and 4.0 ft/s (0.9, 1.05, and 1.2 m/s). ...... 232 Figure O-1. Cumulative Plot of Pedestrian Directional Split for 43 Study Sites (Represents 185 Hours of Data)................................................................................................................. 235 Figure O-2. Cumulative Plot of Pedestrian Directional Split for Eight California Sites (Represents 88 Hours of Data)........................................................................................ 235 Figure O-3. Comparison between Warrant 3 (Peak Hour) and Warrant 4 (Pedestrian, Adjusted to Highest Approach Volume). ........................................................................................... 236
ix
ACKNOWLEDGMENTS The research reported herein was performed under Transit Cooperative Research Program/National Cooperative Highway Research Program (TCRP/NCHRP) Project D-08/3-71 by the Texas Transportation Institute (TTI). Texas A&M Research Foundation was the contractor for this study. Kay Fitzpatrick of the Texas Transportation Institute was the Principal Investigator. Primary authors of this report are: Kay Fitzpatrick (Research Engineer), Shawn Turner (Associate Research Engineer), and Marcus Brewer (Assistant Research Engineer), all of the Texas Transportation Institute. Assisting the primary authors were: Paul Carlson (Associate Research Engineer, TTI), Nazir Lalani (Principal Associate of Traffex Engineers, Inc.), Brooke Ullman (Associate Transportation Researcher, TTI), Nada Trout (Assistant Research Scientist, TTI), Eun Sug Park (Assistant Research Scientist, TTI) Dominique Lord (Assistant Professor, TAMU), and Jeff Whitacre (Graduate Research Assistant, TTI). The work was performed under the general supervision of Dr. Fitzpatrick. The authors would also like to recognize the following individuals with TTI for assistance with the research: Collecting field data: Todd Hausman (Associate Research Specialist), Laura Sandt (Research Associate), Andrew Holick (Assistant Transportation Researcher), and Gary Barricklow (Traffic Surveyor) Reducing field data: Todd Hausman, Megan Kubecka, Charles Stevens, Tim Wolff, Pammy Katsabas, Melissa Ghrist, Brianne McEwen, Amber Holguin, Stephanie Sandt, Kathleen Newton, and Steven Wilcox Report preparation: Denise Robledo and Maria Medrano The authors wish to acknowledge the many individuals who contributed to this research by participating in the focus groups, on-street surveys, and on-site interviews, along with those who assisted in identifying potential study sites for the Phase II field studies. Those that hosted members of the research team during the on-site interviews included: Dan Bergenthal (Salt Lake City, Utah); Richard Nassi, Shellie Ginn, George Caria (Tucson, Arizona); Michael Cynecki, Thomas Godbee, Ron Robinson, Chuck Italiano (Phoenix, Arizona); Lucy Dyke, Beth Rolandson (Santa Monica, California); Wayne Tanda, John Fisher (Los Angeles, California); Julie Mercer-Matlick, Paula Reeves, Randy Wesselman (Olympia, Washington); Pat O’Neill (University Place, Washington); Robert Spillar, Brian Kemper, Megan Hoyt, Ross Hudson (Seattle, Washington); David Godfrey (Kirkland, Washington); Mark Poch, Kurt Latt (Bellevue, Washington); Jeff Palmer, Susan Byszeski (Redmond, Washington); and Bill Kloos, Jamie Jeffreys, Jean Senechal, Basil Christopher (Portland, Oregon). Several individuals also assisted the research team with identifying study sites and coordinating the field data collection including: Richard Nassi (Tucson Department of Transportation [DOT]); John Fisher (Los Angeles DOT); Dan Bergenthal (Salt Lake City Corporation); Bill Kloos, Jean Senechal (Portland Office of Transportation); Lucy Dyke, Beth Rolandson (City of Santa Monica Planning and Community Development); Jeff Palmer, Susan Byszeski (City of Redmond); David Godfrey (City of Kirkland Public Works); Brian Kemper,
x
Megan Hoyt (Seattle Transportation); Eric Tabacek, Ed Paulis (Maryland State Highway Administration); David Gerard (City of Austin); and Ken Fogle (City of College Station). Individuals who participated in the workshop on evaluating the pedestrian signal warrant at selected locations include: Ruth Smith, Bill Kloos, Mohamed Yussef, Sandra Marks, Raja Sethuraman, Monica Suter, Anne Hernandez, Nancy Cooper, Colleen Hill, Rock Miller, Crystal Killian, Jeffrey Bagdade, and Bob Mabry. Individuals who donated their time to review the draft Guidelines for Pedestrian Crossing Treatments include: Richard Nassi (City of Tucson), David Gerard (City of Austin), Monica Suter (City of Santa Ana), Mark Meisinger (City of Portland), Tom Hicks (Maryland State Highway Administration), and John Fisher (City of Los Angeles).
xi
ABSTRACT A recent research project jointly sponsored by the Transit Cooperative Research Program and the National Cooperative Highway Research Program had two main objectives: (a) recommend selected engineering treatments to improve safety for pedestrians crossing highvolume, high-speed roadways at unsignalized intersections, in particular those served by public transportation; and (b) recommend modifications to the Manual on Uniform Traffic Control Devices [MUTCD] pedestrian traffic signal warrant. The research team developed guidelines that can be used to select pedestrian crossing treatments for unsignalized intersections and midblock locations (Guidelines for Pedestrian Crossing Treatments). Quantitative procedures in the Guidelines use key input variables (such as pedestrian volume, street crossing width, traffic volume, etc.) to recommend one of four possible crossing treatment categories. The research team developed and presented recommendations to revise the MUTCD pedestrian warrant for traffic control signals to the National Committee on Uniform Traffic Control Devices. In accomplishing the two main study objectives, the research team also developed useful supporting information such as the findings from the field studies on walking speed and motorist compliance. Pedestrian walking speed recommendations were 3.5 ft/s (1.07 m/s) for general population and 3.0 ft/s (0.9 m/s) for older or less able population. Motorist compliance (yielding or stopping where required) was the primary measure of effectiveness for engineering treatments at unsignalized roadway crossings. The study found that the crossing treatment does have an impact on motorist compliance, and other factors influencing the treatment effectiveness were number of lanes being crossed and posted speed limit.
xii
Appendix B: Proposed Changes to MUTCD
APPENDIX B PROPOSED CHANGES TO MUTCD PROPOSED CHANGE I – PEDESTRIAN SIGNAL WARRANT Following is a reproduction of the Manual of Uniform Traffic Control Devices (MUTCD) (1) sections with strike-outs and underlines showing the recommended changes to the Manual. Section 4C.05 Warrant 4, Pedestrian Volume Support: The Pedestrian Volume signal warrant is intended for application where the traffic volume on a major street is so heavy that pedestrians experience excessive delay in crossing the major street. Standard: The need for a traffic control signal at an intersection or midblock crossing shall be considered if an engineering study finds that the both of the following criteria are met: that one of the following criteria is met: A. The pedestrian volume crossing the major street at an intersection or midblock location during an average day is 100 or more for each of any 4 hours or 190 or more during 1 hour; and B. There are fewer than 60 gaps per hour in the traffic stream of adequate length to allow pedestrians to cross during the same period when the pedestrian volume criterion is satisfied. Where there is a divided street having a median of sufficient width for pedestrians to wait, the requirement applies separately to each direction of vehicular traffic. A. For each of any 4 hours of an average day, the plotted points representing the vehicles per hour on the major street (total of both approaches) and the corresponding pedestrians per hour crossing major roadway (total of all crossings) all fall above the curve in Figure 4C-4. B. For 1 hour (any four consecutive 15-minute periods) of an average day the plotted point representing the vehicles per hour on the major street (total of both approaches) and the corresponding pedestrians per hour crossing major roadway (total of all crossings) falls above the curve in Figure 4C-6. The Pedestrian Volume signal warrant shall not be applied at locations where the distance to the nearest traffic control signal or all-way Stop is less than 300 ft (90 m), unless the proposed traffic control signal will not restrict the progressive movement of traffic. 1
TCRP/NCHRP: Improving Pedestrian Safety at Unsignalized Crossings
If this warrant is met and a traffic control signal is justified by an engineering study, the traffic control signal shall be equipped with pedestrian signal heads conforming to requirements set forth in Chapter 4E. Option: If the posted or statutory speed limit or the 85th-percentile speed on the major street exceeds 35 mph (55 km/h), or if the intersection lies within the built-up area of an isolated community having a population of less than 10,000, or where a major transit stop is present, Figure 4C-5 may be used in place of Figure 4C-4 to satisfy criteria A or Figure 4C-7 may be used in place of Figure 4C-6 to satisfy criteria B. Guidance: If this warrant is met and a traffic control signal is justified by an engineering study, then: A. If at an intersection, the traffic control signal should be traffic-actuated and should include pedestrian activation detectors. B. If at a nonintersection crossing, the traffic control signal should be pedestrian-actuated, parking and other sight obstructions should be prohibited for at least 100 ft (30 m) in advance of and at least 20 ft (6.1 m) beyond the crosswalk, and the installation should include suitable standard signs and pavement markings. C. Furthermore, if installed within a signal system, the traffic control signal should be coordinated. Option: The criterion for the pedestrian volume crossing the major roadway may be reduced as much as 50 percent if the average 15th percentile crossing speed of pedestrians is less than 3.5 ft/sec (1.1 m/sec) 1.2 m/sec (4 ft/sec). A traffic control signal may not be needed at the study location if adjacent coordinated traffic control signals consistently provide gaps of adequate length for pedestrians to cross the street., even if the rate of gap occurrence is less than one per minute.
2
Appendix B: Proposed Changes to MUTCD
Pedestrians Crossings Major RoadwayPPH
Figure B-1. Proposed MUTCD Figure 4C-4. Warrant 4, Four-Hour Volume 500 400 300 200 100 0 300
500
700
900
1100
1300
Major Roadway - Total of Both Approaches - Vehicles Per Hour (VPH) *Note: 107 pph applies as the lower threshold volume.
Figure B-2. Proposed MUTCD Figure 4C-5. Warrant 4, Four-Hour Volume (70% Factor) Community less than 10,000 population or above 55 km/h or above 35 mph on major street or where a major transit stop is present
Pedestrians Crossings Major Roadway-PPH .
400
300
200
100
0 200
300
400
500
600
700
800
900
1000
Major Roadway - Total of Both Approaches - Vehicles Per Hour (VPH) *Note: 75 pph applies as the lower threshold volume.
3
TCRP/NCHRP: Improving Pedestrian Safety at Unsignalized Crossings
Figure B-3. Proposed MUTCD Figure 4C-6. Warrant 4, Peak Hour
Pedestrians Crossings Major RoadwayPPH .
700 600 500 400 300 200 100 0 300
600
900
1200
1500
1800
Major Roadway - Total of Both Approaches - Vehicles Per Hour (VPH) *Note: 133 pph applies as the lower threshold volume.
Figure B-4. Proposed MUTCD Figure 4C-7. Warrant 4, Peak Hour (70% Factor) Community less than 10,000 population or above 55 km/h or above 35 mph on major street or where a major transit stop is present
Pedestrians Crossings Major Roadway-PPH .
500 400 300 200 100 0 200
400
600
800
1000
1200
Major Roadway - Total of Both Approaches - Vehicles Per Hour (VPH) *Note: 93 pph applies as the lower threshold volume.
4
Appendix B: Proposed Changes to MUTCD
PROPOSED CHANGE II – ADD ALTERNATIVE Following is a reproduction of the MUTCD section with the recommended addition to the MUTCD shown with an underline. Section 4B.04 Alternatives to Traffic Control Signals Guidance: Since vehicular delay and the frequency of some types of crashes are sometimes greater under traffic signal control than under STOP sign control, consideration should be given to providing alternatives to traffic control signals even if one or more of the signal warrants has been satisfied. Option: These alternatives may include, but are not limited to, the following: A. Installing signs along the major street to warn road users approaching the intersection; B. Relocating the stop line(s) and making other changes to improve the sight distance at the intersection; C. Installing measures designed to reduce speeds on the approaches; D. Installing a flashing beacon at the intersection to supplement STOP sign control; E. Installing flashing beacons on warning signs in advance of a STOP sign controlled intersection on major- and/or minor-street approaches; F. Adding one or more lanes on a minor-street approach to reduce the number of vehicles per lane on the approach; G. Revising the geometrics at the intersection to channelize vehicular movements and reduce the time required for a vehicle to complete a movement, which could also assist pedestrians; H. Revising the geometrics at the intersection to add a pedestrian median refuge island(s) and/or a curb extension; I. Installing roadway lighting if a disproportionate number of crashes occur at night; J. Restricting one or more turning movements, perhaps on a time-of-day basis, if alternate routes are available; K. If the warrant is satisfied, installing multiway STOP sign control; L. Installing a roundabout intersection; and M. Employing other alternatives, depending on conditions at the intersection.
5
TCRP/NCHRP: Improving Pedestrian Safety at Unsignalized Crossings
PROPOSED CHANGE III – ADD PEDESTRIAN BEACON Following is a reproduction of the MUTCD sections with strike-outs and underlines showing recommended changes to the MUTCD. CHAPTER 4M. TRAFFIC CONTROL BEACONS FOR PEDESTRIANS Section 4M.01 Application of Pedestrian Beacons Support: A pedestrian beacon is a special highway traffic signal used at some locations for pedestrians waiting to cross or crossing the street. Option: A pedestrian beacon may be considered for installation at a location that does not meet other traffic signal warrants to facilitate pedestrian crossings. Guidance: If a traffic control signal is not justified under the signal warrants of Chapter 4C and if gaps in traffic are not adequate to permit pedestrians to cross, or if the speed for vehicles approaching on the major street is too high to permit pedestrians to cross, or if pedestrian delay is excessive, installing a pedestrian beacon should be considered. If one of the signal warrants of Chapter 4C is met and a traffic control signal is justified by an engineering study, and if a decision is made to install a traffic control signal, it should be installed based upon the provisions of Chapter 4D. Standard: If used, pedestrian beacons shall be used in conjunction with signs and pavement markings to warn and control traffic at midblock locations where pedestrians enter or cross a street or highway. A pedestrian beacon shall only be installed at a marked midblock crosswalk. Section 4M.02 Design of Pedestrian Beacons Standard: Except as specified in this Section, a pedestrian beacon shall meet the requirements of this Manual.
6
Appendix B: Proposed Changes to MUTCD
A pedestrian beacon shall consist of three signal sections, with a CIRCULAR YELLOW signal lens centered below two horizontally aligned CIRCULAR RED signal lenses (see Figure 4M-1). If the criteria described in the third paragraph of Section 4M.01 is met and a pedestrian beacon is justified by an engineering study, then: A. At least two pedestrian beacons shall be installed for each approach of the major street, and B. A stop line shall be installed for each approach of the major street, and C. A pedestrian signal head conforming to the provisions set forth in Chapter 4E shall be installed at each end of the marked crosswalk, and D. The pedestrian beacon shall be pedestrian actuated.
Dark Until Activated
Flashing Yellow for 3 to 6 sec
Steady Yellow for 3 to 6 sec
Alternating Flashing Red During Pedestrian Clearance Interval Steady Red during Pedestrian Walk Interval Figure B-5. Proposed MUTCD Figure 4M-1. Example of Sequence for a Pedestrian Beacon.
7
TCRP/NCHRP: Improving Pedestrian Safety at Unsignalized Crossings Guidance: If the criteria described in the third paragraph of Section 4M.01 is met and a pedestrian beacon is justified by an engineering study, then: A. Parking and other sight obstructions should be prohibited for at least 30 m (100 ft) in advance of and at least 6.1 m (20 ft) beyond the marked crosswalk, B. The installation should include suitable standard signs and pavement markings, and C. If installed within a signal system, the pedestrian beacon should be coordinated. Option: Pedestrian beacons may be located over the roadway or adjacent to each side of the roadway at a suitable location. Guidance: On approaches having posted speed limits or 85th-percentile speeds in excess of 60 km/h (35 mph) and on approaches having traffic or operating conditions that would tend to obscure visibility of roadside beacon locations, at least one of the pedestrian beacons should be installed over the roadway. On multilane approaches having posted speed limits or 85th-percentile speeds of 60 km/h (35 mph) or less, either a pedestrian beacon should be installed on each side of the approach (if a median of sufficient width exists) or at least one of the pedestrian beacons should be installed over the roadway. A pedestrian beacon should comply with the signal face provisions described in Sections 4D.15 and 4D.17. Standard: A CROSSWALK STOP ON RED (symbolic red ball) (R10-23) sign shall be mounted adjacent to a signal face on each major street approach (see Section 2B.45). If an overhead signal face is provided, the sign shall be mounted adjacent to the overhead signal face. Option: A Pedestrian (W11-2) sign (see Section 2C.41) with an AHEAD (W16-9p) supplemental plaque may be placed in advance of a pedestrian beacon. A warning beacon may be installed to supplement the W11-2 sign and may be programmed to only flash during the yellow and red signal indications of the pedestrian beacon.
8
Appendix B: Proposed Changes to MUTCD
Standard: If a warning beacon is installed to supplement the W11-2 sign, the design and location of the beacon shall conform to the provisions of Sections 4K.01 and 4K.03. Section 4M.03 Operation of Pedestrian Beacons Standard: Pedestrian beacons shall be dark (not illuminated) during periods between actuations. Upon actuation by a pedestrian, a pedestrian beacon shall display a flashing CIRCULAR YELLOW signal indication, followed by a steady CIRCULAR YELLOW signal indication, followed by both steady CIRCULAR RED signal indications during the pedestrian walk interval, followed by alternating flashing CIRCULAR RED signal indications during the pedestrian clearance interval (see Figure 4M-1). Upon termination of the pedestrian clearance interval, the pedestrian beacon shall revert to a non-illuminated condition. The pedestrian signal heads shall continue to display a steady UPRAISED HAND (symbolizing DONT WALK) signal indication when the pedestrian beacon is displaying a flashing or steady CIRCULAR YELLOW signal indication. The pedestrian signal heads shall display a WALKING PERSON (symbolizing WALK) signal indication when the pedestrian beacon is displaying a steady CIRCULAR RED signal indication. The pedestrian signal heads shall display a flashing UPRAISED HAND (symbolizing DONT WALK) signal indication when the pedestrian beacon is displaying alternating flashing CIRCULAR RED signal indications. Upon termination of the pedestrian clearance interval, the pedestrian signal heads shall revert to a steady UPRAISED HAND (symbolizing DONT WALK) signal indication. Guidance: The duration of the flashing yellow interval should be determined by engineering judgment. The steady yellow interval should have a duration of approximately 3 to 6 seconds (see Section 4D.10). The longer intervals should be reserved for use on approaches with higher speeds. Section 4A.01 Types Support: The following types and use of highway traffic signals are discussed in Part 4: traffic control signals, pedestrian control features signals, emergency-vehicle traffic control signals, traffic control signals for one-lane, two-way facilities; traffic control signals for freeway entrance 9
TCRP/NCHRP: Improving Pedestrian Safety at Unsignalized Crossings ramps, traffic control signals for movable bridges; lane-use control signals; flashing beacons; and in-roadway lights; and pedestrians beacons. 4A.02 Definitions Relating to Highway Traffic Signals Standard: The following technical terms, when used in Part 4, shall be defined as follows: 1. Accessible Pedestrian Signal—a device that communicates information about pedestrian timing in nonvisual format such as audible tones, verbal messages, and/or vibrating surfaces. 2. Active Grade Crossing Warning System—the flashing-light signals, with or without warning gates, together with the necessary control equipment used to inform road users of the approach or presence of trains at highway-rail grade crossings or highway-light rail transit grade crossings. 3. Actuated Operation—a type of traffic control signal operation in which some or all signal phases are operated on the basis of actuation. 4. Actuation—initiation of a change in or extension of a traffic signal phase through the operation of any type of detector. 5. Approach—all lanes of traffic moving towards an intersection or a midblock location from one direction, including any adjacent parking lane(s). 6. Average Day—a day representing traffic volumes normally and repeatedly found at a location, typically a weekday when volumes are influenced by employment or a weekend day when volumes are influenced by entertainment or recreation. 7. Backplate—see Signal Backplate. 8. Beacon—a highway traffic signal with one or more signal sections that operates in a flashing mode. 9. Conflict Monitor—a device used to detect and respond to improper or conflicting signal indications and improper operating voltages in a traffic controller assembly. 10. Controller Assembly—a complete electrical device mounted in a cabinet for controlling the operation of a highway traffic signal. 11. Controller Unit—that part of a controller assembly that is devoted to the selection and timing of the display of signal indications. 12. Crosswalk—(a) that part of a roadway at an intersection included within the connections of the lateral lines of the sidewalks on opposite sides of the highway measured from the curbs or in the absence of curbs, from the edges of the traversable roadway, and in the absence of a sidewalk on one side of the roadway, the part of a roadway included within the extension of the lateral lines of the sidewalk at right angles to the centerline; (b) any portion of a roadway at an intersection or elsewhere distinctly indicated as a pedestrian crossing by lines on the surface, which may be supplemented by a contrasting pavement texture, style, or color. 13. Cycle Length—the time required for one complete sequence of signal indications. 14. Dark Mode—the lack of all signal indications at a signalized location. (The dark mode is most commonly associated with power failures, ramp meters, beacons, and some movable bridge signals.)
10
Appendix B: Proposed Changes to MUTCD 15. Detector—a device used for determining the presence or passage of vehicles or pedestrians. 16. Dual-Arrow Signal Section—a type of signal section designed to include both a yellow arrow and a green arrow. 17. Emergency Vehicle Traffic Control Signal—a special traffic control signal that assigns the right-of-way to an authorized emergency vehicle. 18. Flasher—a device used to turn highway traffic signal indications on and off at a repetitive rate of approximately once per second. 19. Flashing—an operation in which a highway traffic signal indication is turned on and off repetitively. 20. Flashing Mode—a mode of operation in which at least one traffic signal indication in each vehicular signal face of a highway traffic signal is turned on and off repetitively. 21. Full-Actuated Operation—a type of traffic control signal operation in which all signal phases function on the basis of actuation. 22. Highway Traffic Signal—a power-operated traffic control device by which traffic is warned or directed to take some specific action. These devices do not include signals at toll plazas, power-operated signs, illuminated pavement markers, warning lights (see Section 6F.78), or steady-burning electric lamps. 23. In-Roadway Lights—a special type of highway traffic signal installed in the roadway surface to warn road users that they are approaching a condition on or adjacent to the roadway that might not be readily apparent and might require the road users to slow down and/or come to a stop. 24. Intersection—(a) the area embraced within the prolongation or connection of the lateral curb lines, or if none, the lateral boundary lines of the roadways of two highways that join one another at, or approximately at, right angles, or the area within which vehicles traveling on different highways that join at any other angle might come into conflict; (b) the junction of an alley or driveway with a roadway or highway shall not constitute an intersection. 25. Intersection Control Beacon—a beacon used only at an intersection to control two or more directions of travel. 26. Interval—the part of a signal cycle during which signal indications do not change. 27. Interval Sequence—the order of appearance of signal indications during successive intervals of a signal cycle. 28. Lane-Use Control Signal—a signal face displaying signal indications to permit or prohibit the use of specific lanes of a roadway or to indicate the impending prohibition of such use. 29. Lens—see Signal Lens. 30. Louver—see Signal Louver. 31. Major Street—the street normally carrying the higher volume of vehicular traffic. 32. Malfunction Management Unit—same as Conflict Monitor. 33. Minor Street—the street normally carrying the lower volume of vehicular traffic. 34. Movable Bridge Resistance Gate—a type of traffic gate, which is located downstream of the movable bridge warning gate, that provides a physical deterrent to vehicle and/or pedestrian traffic when placed in the appropriate position. 35. Movable Bridge Signal—a highway traffic signal installed at a movable bridge to notify traffic to stop during periods when the roadway is closed to allow the bridge to open. 11
TCRP/NCHRP: Improving Pedestrian Safety at Unsignalized Crossings 36. Movable Bridge Warning Gate—a type of traffic gate designed to warn, but not primarily to block, vehicle and/or pedestrian traffic when placed in the appropriate position. 37. Pedestrian Change Interval—an interval during which the flashing UPRAISED HAND (symbolizing DONT WALK) signal indication is displayed. When a verbal message is provided at an accessible pedestrian signal, the verbal message is “wait.” 38. Pedestrian Clearance Time—the time provided for a pedestrian crossing in a crosswalk, after leaving the curb or shoulder, to travel to the far side of the traveled way or to a median. 39. Pedestrian Signal Head—a signal head, which contains the symbols WALKING PERSON (symbolizing WALK) and UPRAISED HAND (symbolizing DONT WALK), that is installed to direct pedestrian traffic at a traffic control signal. 40. Pedestrian Beacon—a special highway traffic signal used at some locations for pedestrians waiting to cross or crossing the street. 41. Permissive Mode—a mode of traffic control signal operation in which, when a CIRCULAR GREEN signal indication is displayed, left or right turns are permitted to be made after yielding to pedestrians and/or oncoming traffic. 42. Platoon—a group of vehicles or pedestrians traveling together as a group, either voluntarily or involuntarily, because of traffic signal controls, geometrics, or other factors. 43. Preemption Control—the transfer of normal operation of a traffic control signal to a special control mode of operation. 44. Pretimed Operation—a type of traffic control signal operation in which none of the signal phases function on the basis of actuation. 45. Priority Control—a means by which the assignment of right-of-way is obtained or modified. 46. Protected Mode—a mode of traffic control signal operation in which left or right turns are permitted to be made when a left or right GREEN ARROW signal indication is displayed. 47. Pushbutton—a button to activate pedestrian timing. 48. Pushbutton Locator Tone—a repeating sound that informs approaching pedestrians that they are required to push a button to actuate pedestrian timing and that enables pedestrians who have visual disabilities to locate the pushbutton. 49. Ramp Control Signal—a highway traffic signal installed to control the flow of traffic onto a freeway at an entrance ramp or at a freeway-to-freeway ramp connection. 50. Ramp Meter—see Ramp Control Signal. 51. Red Clearance Interval—an optional interval that follows a yellow change interval and precedes the next conflicting green interval. 52. Right-of-Way (Assignment)—the permitting of vehicles and/or pedestrians to proceed in a lawful manner in preference to other vehicles or pedestrians by the display of signal indications. 53. Roadway Network—a geographical arrangement of intersecting roadways. 54. Semiactuated Operation—a type of traffic control signal operation in which at least one, but not all, signal phases function on the basis of actuation. 55. Separate Left-Turn Signal Face—a signal face for controlling a left-turn movement that sometimes displays a different color of circular signal indication than the adjacent through signal faces display.
12
Appendix B: Proposed Changes to MUTCD 56. Shared Left-Turn Signal Face—a signal face, for controlling both a left turn movement and the adjacent through movement, that always displays the same color of circular signal indication that the adjacent through signal face or faces display. 57. Signal Backplate—a thin strip of material that extends outward from and parallel to a signal face on all sides of a signal housing to provide a background for improved visibility of the signal indications. 58. Signal Coordination—the establishment of timed relationships between adjacent traffic control signals. 59. Signal Face—that part of a traffic control signal provided for controlling one or more traffic movements on a single approach. 60. Signal Head—an assembly of one or more signal sections. 61. Signal Housing—that part of a signal section that protects the light source and other required components. 62. Signal Indication—the illumination of a signal lens or equivalent device. 63. Signal Lens—that part of the signal section that redirects the light coming directly from the light source and its reflector, if any. 64. Signal Louver—a device that can be mounted inside a signal visor to restrict visibility of a signal indication from the side or to limit the visibility of the signal indication to a certain lane or lanes, or to a certain distance from the stop line. 65. Signal Phase—the right-of-way, yellow change, and red clearance intervals in a cycle that are assigned to an independent traffic movement or combination of movements. 66. Signal Section—the assembly of a signal housing, signal lens, and light source with necessary components to be used for providing one signal indication. 67. Signal System—two or more traffic control signals operating in signal coordination. 68. Signal Timing—the amount of time allocated for the display of a signal indication. 69. Signal Visor—that part of a signal section that directs the signal indication specifically to approaching traffic and reduces the effect of direct external light entering the signal lens. 70. Signal Warrant—a threshold condition that, if found to be satisfied as part of an engineering study, shall result in analysis of other traffic conditions or factors to determine whether a traffic control signal or other improvement is justified. 71. Speed Limit Sign Beacon—a beacon used to supplement a SPEED LIMIT sign. 72. Steady (Steady Mode)—the continuous illumination of a signal indication for the duration of an interval, signal phase, or consecutive signal phases. 73. Stop Beacon—a beacon used to supplement a STOP sign, a DO NOT ENTER sign, or a WRONG WAY sign. 74. Traffic Control Signal (Traffic Signal)—any highway traffic signal by which traffic is alternately directed to stop and permitted to proceed. 75. Vibrotactile Pedestrian Device—a device that communicates, by touch, information about pedestrian timing using a vibrating surface. 76. Visibility-Limited Signal Face or Signal Section—a type of signal face or signal section designed (or shielded, hooded, or louvered) to restrict the visibility of a signal indication from the side, to a certain lane or lanes, or to a certain distance from the stop line. 77. Walk Interval—an interval during which the WALKING PERSON (symbolizing WALK) signal indication is displayed. When a verbal message is provided at an accessible pedestrian signal, the verbal message is “walk sign.”
13
TCRP/NCHRP: Improving Pedestrian Safety at Unsignalized Crossings 78. Warning Beacon—a beacon used only to supplement an appropriate warning or regulatory sign or marker. 79. Yellow Change Interval—the first interval following the green interval during which the yellow signal indication is displayed. Section 2B.45 Traffic Signal Signs (R10-1 through R10-21) Option: To supplement traffic signal control, Traffic Signal signs R10-1 through R10-21 23 may be used to regulate road users. Guidance: When used, Traffic Signal signs should be located adjacent to the signal face to which they apply. Standard: Traffic Signal signs applicable to pedestrian actuation (see Figure 2B-18) shall be mounted immediately above or incorporated in pedestrian pushbutton units (see Section 4E.08). Support: Traffic Signal signs applicable to pedestrians include: A. B. C. D.
CROSS ON GREEN LIGHT ONLY (R10-1); CROSS ON WALK SIGNAL ONLY (R10-2); PUSH BUTTON FOR GREEN LIGHT (R10-3); and PUSH BUTTON FOR WALK SIGNAL (R10-4).
Option: The following signs may be used as an alternate for the R10-3 and R10-4 signs: A. TO CROSS STREET (arrow), PUSH BUTTON WAIT FOR GREEN LIGHT (R10-3a); and B. TO CROSS STREET (arrow), PUSH BUTTON WAIT FOR WALK SIGNAL (R10-4a). The symbol sign R10-2a may be used as an alternate to sign R10-2. Where symbol-type pedestrian signal indications are used, an educational sign (R10-3b) may be used to improve pedestrian understanding of pedestrian indications at signalized intersections. Where word-type pedestrian signal indications are being retained for the remainder of their useful service life, the legends WALK/DONT WALK may be substituted for the symbols on the educational sign R103b, thus creating sign R10-3c. The R10-3d sign may be used if the pedestrian clearance time is sufficient only for the pedestrian to cross to the median. The diagrammatic sign R10-4b may also be used as an alternate to sign R10-4. At intersections where pedestrians cross in two stages using a median refuge island, the word message “CROSS TO MEDIAN” may be placed on the near corner of the refuge island along with the educational plaque.
14
Appendix B: Proposed Changes to MUTCD Traffic Signal signs (see Figure 2B-19) may be installed at certain locations to clarify signal control. Among the legends for this purpose are LEFT ON GREEN ARROW ONLY (R10-5), STOP HERE ON RED (R10-6 or R10-6a) for observance of stop lines, DO NOT BLOCK INTERSECTION (R10-7) for avoidance of traffic obstructions, USE LANE(S) WITH GREEN ARROW (R10-8) for obedience to Lane Control signals, LEFT TURN YIELD ON GREEN (symbolic green ball) (R10-12), and LEFT TURN SIGNAL YIELD ON GREEN (symbolic green ball) (R10-21) (see Section 4D.06). In situations where traffic control signals are coordinated for progressive timing, the Traffic Signal Speed (I1-1) sign may be used (see Section 2D.47). Standard: The NO TURN ON RED (R10-11a, R10-11b) sign (see Figure 2B-19) shall be used to prohibit a right turn on red (or a left turn on red from a one-way street to a one-way street). Option: A symbolic NO TURN ON RED (R10-11) sign (see Figure 2B-19) may be used as an alternate to the R10-11a and R10-11b signs. Guidance: If used, the NO TURN ON RED sign should be installed near the appropriate signal head. A NO TURN ON RED sign should be considered when an engineering study finds that one or more of the following conditions exists: A. Inadequate sight distance to vehicles approaching from the left (or right, if applicable); B. Geometrics or operational characteristics of the intersection that might result in unexpected conflicts; C. An exclusive pedestrian phase; D. An unacceptable number of pedestrian conflicts with right-turn-on-red maneuvers, especially involving children, older pedestrians, or persons with disabilities; and E. More than three right-turn-on-red accidents reported in a 12-month period for the particular approach. Where turns on red are permitted and the signal indication is a RED ARROW, the RIGHT (LEFT) ON RED ARROW AFTER STOP (R10-17a) sign (see Figure 2B-19) should be installed adjacent to the RED ARROW signal indication. Option: In order to remind drivers who are making turns to yield to pedestrians, especially at intersections where right turn on red is permitted and pedestrian crosswalks are marked, a TURNING TRAFFIC MUST YIELD TO PEDESTRIANS (R10-15) sign may be used (see Figure 2B-19).
15
TCRP/NCHRP: Improving Pedestrian Safety at Unsignalized Crossings A supplemental R10-20a plaque (see Figure 2B-19) showing times of day (similar to the S4-1 plaque shown in Figure 7B-1) with a black legend and border on a white background may be mounted below a NO TURN ON RED sign to indicate that the restriction is in place only during certain times. Standard: The EMERGENCY SIGNAL (R10-13) sign (see Figure 2B-19) shall be used in conjunction with emergency-vehicle traffic control signals (see Section 4F.02). Standard: The CROSSWALK STOP ON RED (symbolic red ball) (R10-23) sign (see Figure 2B-19) shall be used in conjunction with pedestrian beacons (see Chapter 4M). Option: A U-TURN YIELD TO RIGHT TURN (R10-16) sign (see Figure 2B-19) may be installed near the left-turn signal face if U-turns are allowed on a protected left-turn movement on an approach from which drivers making a right turn from the conflicting approach to their left are simultaneously being shown a right-turn GREEN ARROW signal indication.
16
Appendix B: Proposed Changes to MUTCD
R10-23
Figure B-6. Proposed MUTCD Figure 2B-19 Traffic Signal Signs.
17
TCRP/NCHRP: Improving Pedestrian Safety at Unsignalized Crossings
APPENDIX C LITERATURE REVIEW OF PEDESTRIAN CROSSING TREATMENTS AT UNCONTROLLED LOCATIONS For this literature review, pedestrian crossing treatments are grouped into similar categories (as shown below) for ease of information presentation. In practice, several treatments or design elements may be combined at a single street crossing. For example, overhead flashing beacons may be used with a median refuge island and curb extensions. For evaluations in which several treatments were combined at a single location, the evaluation information is included in the section corresponding to the predominant treatment. If there is not a predominant treatment, then the evaluation information may be included in several sections corresponding to each treatment at that location. The basic categories of pedestrian crossing treatments (and some examples) as presented in this literature review are listed in Table C-1. TABLE C-1. Basic Categories of Pedestrian Crossing Treatments. Traffic Signal and Red Beacon Display Half-signal or adaptations (e.g., HAWK signal) Puffin/Pelican/Toucan pedestrian crossing signalization from Europe Automated pedestrian detection Educational plaques for walk signals Countdown indications Signing and Marking Overhead flashing beacons In-roadway warning lights Flashing signs or beacons beside the crossing Motorist warning signs at or in advance of crossing Pedestrian warning signs at the crossing (e.g., “animated eyes,” pavement text) Crosswalk pavement marking Text pavement markings Advance stop lines Pedestrian crossing flags General Design Median refuge with angled or staggered pedestrian opening Landscaped median or fencing to discourage crossing at inappropriate location(s) No on-street parking in vicinity of crossing location Adequate street lighting Shortened curb radius for shorter crossing time Railing to direct pedestrians to appropriate crossing location(s) Curb extensions or bulb-outs Raised crosswalk or intersection Enforcement Enforcement of motor vehicle yielding (“crosswalk sting”) Enforcement of pedestrian crossing (jaywalk enforcement) Automated enforcement of red light running and/or speeding
18
Appendix C: Literature Review of Pedestrian Crossing Treatments at Uncontrolled Locations TRAFFIC SIGNAL AND RED BEACON DISPLAY Pedestrian crossing treatments in the signalization category include various types of pedestrian-specific signals or pedestrian elements that can be added to regular traffic signals. Examples include the following: Half-signal or adaptations (e.g., HAWK signal), Puffin/Pelican/Pussycat pedestrian crossing signalization from Europe, and Automated pedestrian detection. Half-Signals or Adapted Half-Signals (e.g., HAWK) The pedestrian signal (or half-signal) has been used in British Columbia, Canada, for over 25 years (2). Voss and Parks describe several operational and safety issues in a 2001 report and also document a study of half-signals in British Columbia. The operational and design characteristics of half-signals do vary among municipalities within British Columbia, which adds to the safety issues noted by the authors. For example, the typical half-signal consists of a regular traffic signal on the main street with stop control on the side street. The half-signal typically dwells in a flashing green ball mode until the pedestrian phase is activated, at which time a 5second solid green indication is shown before the yellow and red intervals. However, several municipalities do not use the solid green indication. Other inconsistencies or design variations in British Columbia’s half-signals include: Red flashing overhead signals are used at stop-controlled approaches. A painted crosswalk and pedestrian signal heads are often used on only one leg of the main street crossing. Vehicle and transit bus detectors are installed on the side street for actuation of the pedestrian phase for motorist and transit bus use. Pedestrian countdown timers are sometimes installed at the main street crossings. Voss and Parks conducted a modest study of STOP sign compliance on side street approaches at 12 half-signal installations throughout the greater Vancouver area in the summer of 2000 (2). Despite including rolling stops as compliance, the authors found very low STOP sign compliance rates at nearly all half-signal installations. Only 2 of the 12 installations had STOP sign compliance rates above 90 percent, whereas the lowest compliance rate was 14 percent. The authors implied that the low STOP sign compliance was due in part to conflicting vehicle and pedestrian control at these half-signal installations. City engineers in Tucson, Arizona, have made modifications to the basic half-signal design to develop what they refer to as a HAWK (High-intensity Activated crossWalK) signal (3, 4). The HAWK crossing design utilizes a warning signal that is dark until activated by a pedestrian. Once activated, the HAWK signal flashes yellow then provides a solid red indication to vehicles and a WALK indication to pedestrians. An evaluation by the Highway Safety Research Center (HSRC) of the University of North Carolina (UNC) used two measures of effectiveness (MOEs): (1) the percent of motorists who yield to pedestrians and (2) the percent of pedestrians who hesitate before crossing, abort their crossing, or run while crossing. In a 19
TCRP/NCHRP: Improving Pedestrian Safety at Unsignalized Crossings traditional before-and-after study, the evaluation of a single HAWK crossing found that motorist yielding increased from 31 to 93 percent. The percentage of hesitating, aborting, or rushed pedestrians decreased from 24 to 10 percent. The study site was a multilane divided arterial street with a posted speed limit of 40 mph (64 km/h). Before installation of the HAWK signal, the pedestrian crossing was delineated by advance and point-of-crossing pedestrian signs, a painted crosswalk, and advance pavement legends. Nassi noted the effectiveness of this type of treatment on wide, higher speed arterial streets (3). Automated Pedestrian Detection Automated pedestrian detection automatically detects waiting or crossing pedestrians and initiates a specific response, such as flashing beacons or extension of crossing time for WALK signals. Automated pedestrian detection is used because research has shown that pedestrians waiting to cross a street do not always activate pedestrian crossing pushbuttons. For example, a study by Zegeer et al. found that, on average, just half of all pedestrians use a pushbutton to cross streets (5). Another study in Cambridge, Massachusetts, indicated that as few as 10 percent of pedestrians used a pushbutton to cross low-volume streets (6). The study indicated that more pedestrians used the pushbutton on moderate- to high-volume streets, when it was necessary to get an exclusive pedestrian crossing phase. A study by Hughes et al. evaluated the use of automated pedestrian detection in conjunction with standard pedestrian pushbuttons (7). The research team used two MOEs to determine if automated pedestrian detection could improve pedestrian safety: pedestrian-vehicle conflicts and inappropriate crossing behavior (i.e., crossing during the DON’T WALK signal). The detection devices (and corresponding technology) were installed at the following locations: Los Angeles, California: one intersection, both infrared and microwave; Rochester, New York: two intersections, microwave; and Phoenix, Arizona: one intersection, microwave. This study found that the use of automated pedestrian detection reduced pedestrianvehicle conflicts by the following amounts: (1) 89 percent for the first half of the street crossing, (2) 42 percent for the second half of the street crossing, (3) 40 percent for right-turning vehicles, and (4) 76 percent for other types of conflicts. The study also found an overall 24 percent increase in the pedestrians who began to cross during the WALK signal and an overall 81 percent decrease in the pedestrians who began to cross during the steady DON’T WALK signal. The authors also noted some difficulties in tuning the detection devices to avoid false and missed detections. Several technologies automatically detect pedestrians: passive infrared, ultrasonic, Doppler radar, video imaging, and pressure-sensitive (piezometric) mats. Beckwith and HunterZaworski evaluated the first three technologies listed above and reported on their effectiveness in passively detecting pedestrians (8). Preliminary tests of the three devices produced positive detection rates that varied from 47 to 96 percent, with all devices above 89 percent detection once they had been optimally positioned and tuned. The Doppler radar and infrared devices were combined into a single installation for long-term testing. Initial results from this long-term
20
Appendix C: Literature Review of Pedestrian Crossing Treatments at Uncontrolled Locations testing site indicate that 100 percent of pedestrians (in 60 pedestrian crossings) were detected. One issue noted was that the activated device, flashing beacons in this case, remained activated for nearly twice as long as the time pedestrians needed to cross. The authors indicated that passing vehicles from high-volume traffic may have kept the flashing beacons activated longer than required. Pedestrian Countdown Indication Pedestrian countdown indications provide pedestrians with a descending numerical countdown of the flashing hand clearance interval. It indicates to the pedestrian the time available for their crossing. The device was installed on one leg of an intersection in Hampton, Virginia. The results found after 24 months of experience that 88 percent of pedestrians feel that the new pedestrian signals are clearer than the conventional displays and 82 percent feel that the new pedestrian heads are an improvement (9). A 1999 study at two locations in Monterey, California surveyed pedestrians after they had crossed the intersection (10). The interviews indicated that the countdown signals were easily understood by all age groups. A large majority of pedestrians felt safer knowing the remaining crossing time and indicated that the device was a welcome added feature. The researchers also found that pedestrians did not attempt to cross when less than 10 to 6 seconds remained on the display (depending upon which intersection they were crossing). Another study in Minnesota that included market research at five intersections also found that pedestrians do understand the countdown pedestrian indication and use the information appropriately and well (11). A Florida DOT study evaluated the effects of countdown signals. The study evaluated two intersections with the treatments and compared the findings to three control intersections that were similar but did not have countdown signals (12). The countdown signals had the positive effect (compared to sites without countdown signals) of reducing the number of pedestrians who started running when the flashing DON’T WALK signal appeared. They had the undesired effect of reducing compliance with the WALK signal (i.e., more pedestrians began their crossing during the flashing or steady DON’T WALK). There was no effect on the number of persons who ran out of time while crossing. Pedestrian countdown signals were evaluated in San Jose, California, in 2001-2002 at four intersections/crossings (13). In addition, two comparative sites were also included in the study. The performance of the signals was assessed with operations studies, pedestrian surveys, conflict analysis, and a review of crash data. Similar to the Florida DOT study, this study found that the percentage of pedestrians entering the intersection during the flashing DON’T WALK signal increased. They also found that the proportions of pedestrians exiting on the DON’T WALK signal decreased, which they attributed to pedestrians using the information on the timer to adjust their walking speeds in order to clear the intersection before the DON’T WALK phase. Their observations of motorist signal violations (entering in yellow or red) showed no discernable negative effect from the installation of the signal.
21
TCRP/NCHRP: Improving Pedestrian Safety at Unsignalized Crossings SIGNING AND PAVEMENT MARKING There are numerous crossing treatments that are grouped into the signing and marking category. The most common examples include: Overhead flashing beacons, In-roadway warning lights, Flashing signs or beacons beside the crossing, Motorist warning signs at or in advance of crossing, Pedestrian warning signs at the crossing (e.g., “animated eyes,” pavement text), and Crosswalk pavement markings. Multiple Treatments A study team led by the Center for Urban Transportation Research (CUTR) of the University of South Florida evaluated numerous pedestrian crossing treatments in St. Petersburg, Florida (14). The study evaluated the effects of engineering treatments in a program that used education, enforcement, and engineering (3E) components at both signalized and unsignalized intersections. The engineering treatments used include: Advance stop/yield lines, Lead pedestrian intervals (signalized intersections only), Scanning eyes on pedestrian signal heads (signalized intersections only), Flashing amber beacons with pedestrian signal (with passive pedestrian detection), Half-signals, and Pedestrian and motorist prompting signs. Motor vehicle yielding behavior and pedestrian-motor vehicle conflicts were the primary measures used in evaluating the treatments. Because of the 3E components of the pedestrian safety campaign, it is difficult to decisively attribute post-installation changes to specific program elements (such as the engineering treatments only). Despite this difficulty, the study authors reported that the engineering treatments provided little improvement in vehicle yielding at signalized intersections (from 60 to 62 percent, on average) but found some improvement at unsignalized intersections (3 to 24 percent). The evaluation results for changes in vehicle conflicts were similar. For signalized intersections, pedestrians experiencing conflicts remained nearly unchanged, from 3 to 4 percent. However, for signalized intersections, pedestrians experiencing conflicts decreased from 4 to 0.3 percent. The study found that the largest improvements were realized when implementing multiple treatments that prompted both motor vehicle and pedestrian awareness. The study authors indicated that the greatest improvements were obtained with the halfsignal installation, which also included advance stop lines and motorist prompting signs. At this study site, motorist yielding increased from 3 to 100 percent. Additionally, pedestrians experiencing conflicts decreased from 4 to 0 percent. This was the only study site to achieve a motorist yielding rate greater than 70 percent. The next most effective installation employed multiple treatments: flashing amber beacons, advance stop lines, motorist prompting signs, and
22
Appendix C: Literature Review of Pedestrian Crossing Treatments at Uncontrolled Locations special crosswalk markings. At this study site, motorist yielding increased from 3 to 30 percent, while the pedestrian conflicts dropped from 2 to 0.5 percent. The city of Los Angeles, California, has developed what they refer to as a “Smart Pedestrian Warning” system that includes multiple pedestrian crossing treatments (15): Advance pavement messages (“PED XING”), Advance warning pedestrian signs, Extended red curb, Double posting of intersection pedestrian signs, Ladder-style crosswalk markings, Automated pedestrian detection (video imaging), and Actuated alternating flashing overhead amber beacons. This pedestrian crossing design and its various elements have evolved over the past several years based on experimentation and testing. To date, about 25 pedestrian crossing warning systems have been installed in Los Angeles. Fisher reports on informal evaluations by city engineering staff, which indicate that this pedestrian warning system has improved motorist yielding to pedestrians from 20 to 30 percent to the 72 to 76 percent range. Their evaluation also indicates that, of the 24 to 28 percent of motorists who do not yield, at least they travel more slowly when approaching the enhanced crossings. For example, limited data indicate that 85th percentile vehicle speeds are reduced from 2 to 12 mph (3.2 to 19.3 km/h). Flashing Signals or Beacons An overhead beacon and crosswalk sign was evaluated in Seattle, Washington, by the HSRC research team. The treatment consisted of a large internally illuminated yellow sign reading “CROSSWALK” with flashing amber beacons on each side (2). After installation of this treatment, motorist yielding to pedestrians increased from 46 to 52 percent. Pedestrians running, hesitating, or aborting their crossing deceased from 58 to 43 percent. The study noted that driver compliance could be further improved by using actuated flashing beacons (i.e., activated by the pedestrian or a pedestrian-sensing device). Van Winkle and Neal evaluated the use of pedestrian-actuated advance and crosswalk flashers in Chattanooga, Tennessee (16). The installation of the crosswalk flashers was a compromise solution for a group of senior citizens that demanded a traffic signal so that they could cross a minor arterial street with speed limit of 40 mph (64.4 km/h). City staff conducted a before-and-after study in 1987, with follow-up data collection in 2000. The evaluation collected data on the percentage of drivers yielding or slowing at the pedestrian crosswalk. The original 1987 data collection showed that driver yielding improved from 11 to 52 percent in the eastbound direction and 6 to 32 percent in the westbound direction. The percentage of drivers yielding at this location has been sustained as a long-term improvement, as driver yielding in 2000 was measured to be 55 percent in the eastbound direction and 45 percent in the westbound direction. The authors attribute the success of the flashers to pedestrian actuation. The city of Chattanooga has installed similar flashing crosswalk warning devices at three other locations
23
TCRP/NCHRP: Improving Pedestrian Safety at Unsignalized Crossings with what they characterize as similar results, although no formal studies of their effectiveness have been conducted. Sparks and Cynecki report on the use of flashing beacons for warning of pedestrian crosswalks in Phoenix, Arizona (17). The city evaluated the application of advance warning flashing beacons at four pedestrian crossing locations. The authors describe the use of several experiments in their evaluation, including before-and-after speed and crash data collection as well as treatment-and-control experiments for traffic speeds. The authors found that the advance warning flashing beacons did not decrease speeds or crashes, and in some cases the traffic speeds or crashes increased after installation of the flashing beacons. These findings led the authors to conclude “that flashers offer no benefit for intermittent pedestrian crossings in an urban environment. In addition, the longer the flashers operate the more it becomes part of the scenery and loses any effectiveness.” The authors do concede that actuated warning flashers may be beneficial in a high-speed rural environment with unusual geometrics, high pedestrian crossings, and unfamiliar drivers. However, these conditions were not tested in their study. In-Roadway Warning Lights at Crosswalks In-roadway warning lights have been evaluated in numerous studies with varying results. It appears that the effectiveness of this treatment varies widely depending upon the characteristics of the site and existing motorist and pedestrian behavior. The following paragraphs describe results from numerous evaluations of in-roadway warning lights. Whitlock and Weinberger Transportation, Inc., summarize the evaluation results of inroadway warning lights at numerous locations in California (18). In these installations, the inroadway warning lights were supplemented with a pedestrian crosswalk sign with warning amber light-emitting diode (LED) lights, as well as a pedestrian-activated pushbutton with flashing LEDs and “CROSS WITH CAUTION” sign. Two different MOEs are used to report evaluation results: (1) percentage of motorists yielding to pedestrians and (2) advanced vehicle braking distance. These MOEs are shown in Table C-2 for both daytime and nighttime conditions. For all six study sites, the percentage of motorists yielding to pedestrians increased. The improvements in motorist yielding behavior were typically much greater for nighttime conditions. The changes with advanced vehicle braking distance showed similar results, with improvements (increases) to braking distance being greater during nighttime conditions. The city of Kirkland, Washington, installed in-roadway warning lights at two midblock locations in the fall of 1997 (19). Whitlock and Weinberger Transportation, Inc., evaluated the crossing treatments at these locations and reported the results using the same two MOEs as the California study: (1) percentage of motorists yielding to pedestrians and (2) advanced vehicle braking distance. The evaluation results are shown in Table C-3. The evaluation team found improvements to both MOEs after installation, with more dramatic improvements evident during nighttime tests. Before installation, driver yielding ranged from 16 to 65 percent. After installation of the in-roadway warning lights, driver yielding ranged from 85 to 100 percent. The study found that “the concept of amber flashing lights embedded in the pavement at uncontrolled crosswalks clearly has a positive effect in enhancing a driver’s awareness of crosswalks and modifying driving habits to be more favorable to pedestrians.”
24
Appendix C: Literature Review of Pedestrian Crossing Treatments at Uncontrolled Locations
TABLE C-2. Evaluation Results of In-Roadway Warning Lights in California (18). Location Summerfield Road, Santa Rosa, CA Main Street, Fort Bragg, CA Mt. Diablo Blvd., Lafayette, CA Pleasant Hill Road, Lafayette, CA Petaluma Blvd. S., Petaluma, CA JFK University, Orinda, CA Main Street, Willits, CA Unweighted Average
Percentage of motorists yielding to pedestrians Daytime Nighttime Before After Before After
Advanced vehicle braking distance (ft) Daytime Nighttime Before After Before After
25
64
1
87
152
220
187
268
47
85
11
95
106
142
90
216
6
21
1
53
130
127
93
174
8
32
2
39
173
210
201
318
68
87
56
83
99
119
97
123
18
23
16
31
115
104
122
146
26
61
6
66
170
193
141
228
28
53
13
65
135
159
133
210
TABLE C-3. Evaluation Results of In-Roadway Warning Lights in Kirkland, Washington (19). Location Central Way Eastbound Central Way Westbound NE 124th Street Eastbound NE 124th Street Westbound Unweighted Average
Percentage of motorists yielding to pedestrians Daytime Nighttime Before After Before After
Advanced vehicle braking distance (ft) Daytime Nighttime Before After Before After
62
92
16
100
200
278
115
238
59
94
27
98
192
244
175
270
46
85
65
93
209
214
204
244
55
92
48
97
271
312
266
304
56
91
39
97
218
262
190
264
Boyce and Van Derlofske compared the effectiveness of in-roadway warning lights to basic crosswalk markings at a single location with two crosswalks in Denville, New Jersey (20). The authors found that the in-roadway warning lights decreased the speed at which vehicles 25
TCRP/NCHRP: Improving Pedestrian Safety at Unsignalized Crossings approached the crosswalk, but that this speed reduction diminished over time. Additionally, vehicle-pedestrian conflicts with the in-roadway warning lights also increased over time. The authors also reported several problems with this specific implementation of in-roadway warning lights. The passive detection of waiting or crossing pedestrians was considered inadequate, and the authors recommended other types of detection. Five of the ten in-roadway warning lights had to be replaced within a year of installation, and the lenses of the warning lights also required regular cleaning because of debris build-up. Snowplows also damaged several of the in-roadway warning lights. The authors consider the in-roadway warning lights (with some modifications) to be appropriate at unusual locations (e.g., midblock crossings) with a documented crash history. Katz, Okitsu, and Associates prepared a study of in-roadway warning lights for Fountain Valley, California (21). Their study analyzed the reported safety record of approximately 30 treatment locations that have been in place for more than 1 year and compared it with the expected safety record for traditional crosswalk treatments. The in-roadway warning light system is not 100 percent effective in preventing motor vehicle-pedestrian crashes; however, the few accidents that have been reported may not have been susceptible to correction by the warning system. The system appears to have reduced the crash expectancy by 80 percent; however, it is not known whether this is a novelty effect or will continue over time. The study also found that marked crosswalks with in-roadway flashers had a lower crash rate than comparable marked crosswalks. Huang et al. documented the evaluation of in-roadway warning lights at a single location in Orlando, Florida (22). The evaluation, which was conducted to determine the effects of the inroadway warning lights on pedestrian and motorist behavior, collected both before-and-after and treatment-and-control data. The before-and-after data focused on vehicle speeds and vehicle yielding. The treatment-and-control data included: (1) pedestrian crossing locations relative to the in-roadway warning crosswalk, with and without police officers; (2) pedestrian-motor vehicle conflicts; (3) pedestrian activation of the flashing crosswalk; and (4) pedestrian interviews. The authors reported these results: Average vehicle speeds decreased by 1.9 mph (3.1 km/h) when a pedestrian was present and 0.8 mph (1.3 km/h) when no pedestrians were present, but the decreases were not significant. Vehicle yielding improved from 13 percent before to 34 percent (when flashers were activated) and 47 percent (when flashers were not activated). The authors could not explain why more drivers yielded when the flashers were not activated. About 28 percent of the pedestrians crossed in the flashing crosswalk when police officers were not present. The remaining 72 percent of pedestrians crossed elsewhere, depending on what was the most convenient path between their origins and destinations. Of the pedestrians who crossed in the flashing crosswalk, 40 percent did not experience any conflicts. This compared to 22 percent of those who crossed within 30 ft (9.2 m) and only 13 percent of those who crossed elsewhere. The researchers concluded that motorists were more likely to stop or slow for pedestrians who crossed in or near the flashing crosswalk than those who crossed elsewhere.
26
Appendix C: Literature Review of Pedestrian Crossing Treatments at Uncontrolled Locations A subsequent study Huang evaluated in-roadway warning lights at one uncontrolled pedestrian crossing each in Gainesville and Lakeland, Florida (23). The evaluation used traditional before-and-after data collection and used these MOEs: (1) motorists yielding to pedestrians, (2) pedestrians who had the benefit of motorists yielding to them, (3) pedestrians who crossed at a normal walking speed, and (4) pedestrians who crossed in the crosswalk. The results for these MOEs were quite different between the two study sites. At the study site in Gainesville, driver yielding actually decreased from 81 to 75 percent. Although the decrease was significant, it was considered practically negligible because of site characteristics. At the Lakeland site driver yielding improved, in this case from 18 to 30 percent, a result that was reported as not statistically significant because of low sample sizes. The results from the other MOEs were not that informative, as major changes were not observed. Prevedouros reported on the evaluation of in-roadway warning lights installed on a sixlane arterial street in Honolulu, Hawaii (24). The evaluation consisted of a traditional before-andafter study of traffic volumes, vehicle spot speeds, pedestrian crossing observations, and pedestrians’ and motorists’ perceptions of change in the situation. The author reported the following results: A 16 to 27 percent reduction in vehicle speeds was measured when the flashing lights were activated. The average pedestrian wait time at the curb decreased from 26 to 13 seconds, and the average crossing time decreased from 34 to 27 seconds. The crossing time decreased because pedestrians did not have to wait as long in the refuge island before crossing the second direction. The proportion of pedestrians who were observed to run during the crossing decreased from 22 to 12 percent after the flashing lights were installed. The proportion of pedestrians crossing outside the marked crosswalk also decreased from 16 to 8 percent after installation. Motorist Warning Signs Nitzburg and Knoblauch reported on the evaluation of an illuminated pedestrian crossing sign used in combination with a high-visibility ladder-style crosswalk marking (25). Four crossing locations in Clearwater, Florida, were evaluated with a treatment-and-control experimental design (before-and-after data collection was not possible because the treatments had already been installed). The authors reported a significant increase (30 to 40 percent) in daytime driver yielding behavior and a smaller (8 percent) and statistically insignificant increase in nighttime driver yielding behavior. A 35 percent increase in crosswalk usage by pedestrians was noted, along with no change in pedestrian overconfidence, running, or conflicts. The authors concluded that the high-visibility crosswalk treatments had a positive effect on pedestrian and driver behavior on the relatively narrow low-speed crossings that were studied. The paper indicated that additional work is needed to determine if these treatments will have as desirable an effect on wider, higher speed roadways.
27
TCRP/NCHRP: Improving Pedestrian Safety at Unsignalized Crossings Huang et al. evaluated three innovative pedestrian signing treatments at locations in Seattle, Washington; six sites in New York State; Portland, Oregon; and three sites in Tucson, Arizona (26). The three treatments evaluated were an overhead crosswalk sign, a pedestrian safety cone typically placed in the roadway, and an overhead flashing regulatory sign prompting motorists to stop for pedestrians in the crosswalk. The evaluation used traditional before-andafter data collection for three MOEs: (1) percentage of pedestrians for whom motorists yielded; (2) percent of pedestrians who ran, aborted, or hesitated; and (3) percent of pedestrians crossing in the crosswalk. The results of the study are shown in Table C-4 below. All treatments except the overhead flashing sign in Tucson showed improvements in motorist yielding. The authors indicated that the effectiveness of the flashing regulatory sign may have been limited because it was installed on four- and six-lane arterial streets with speed limits of 40 mph (64.4 km/h) (the other study locations were primarily two-lane streets with speed limits of 25 or 30 mph [40.2 or 48.3 km/h]). TABLE C-4. Effectiveness of Pedestrian Treatments at Unsignalized Locations (26). Study Location Overhead CROSSWALK sign, (1 site in Seattle) In-roadway pedestrian safety cone (6 sites in New York, 1 site in Portland) Overhead flashing crosswalk regulatory sign (3 sites in Tucson)
Percent of pedestrians for whom motorists yielded Before – 46 After – 52
Percent of pedestrians who ran, aborted, or hesitated Before – 58 After – 43
Before – 70 After – 81
Before – 35 After – 33
Before – 79 After – 82
Before – 63 After – 52
Before – 17 After – 10
Before – 94 After – 94
Percent of pedestrians crossing in the crosswalk Before – 100 After – 100
Advance Yield/Stop Line Advance yield/stop lines and signs have been found to be most effective on multilane streets where “multiple-threat” crashes are most likely to occur. The principle behind the advance yield/stop line is that vehicles yielding 49 ft (15 m) back from the crosswalk are less likely to screen views of the crossing pedestrian from motorists in other lanes. Additionally, motorists may be less likely to pass yielding vehicles in the next lane of travel. Several studies by Van Houten and others (27, 28, 29) have demonstrated the effectiveness of advance yield lines (i.e., pavement markings) and “YIELD HERE TO PEDESTRIAN” signs. This research found a marked reduction in motor vehicle-pedestrian conflicts and an increase in motorists yielding to pedestrians at multilane crosswalks with an uncontrolled approach. These results have been documented at crosswalks with and without amber flashing beacons. Van Houten and Malenfant (28) also demonstrated that the markings and sign together were more effective than the sign alone. In a recent study by Van Houten et al., advance yield lines and “YIELD HERE TO PEDESTRIAN” signs were shown to reduce vehicle-pedestrian conflicts by 67 to 87 percent (29). The study also found a large increase in the distance at which motorists yielded to pedestrians. These evaluation results were further replicated at 24 additional study sites.
28
Appendix C: Literature Review of Pedestrian Crossing Treatments at Uncontrolled Locations “Animated Eyes” Display Van Houten and others documented the effectiveness of animated or roving eyes in conjunction with overhead flashing amber beacons and automated pedestrian detection at a single location in St. Petersburg, Florida (30). The evaluation used a traditional before-and-after study approach with alternating treatments. The MOEs included driver yielding, pedestrianvehicle conflicts, and pedestrians stranded in the center of the roadway. The installation of the animated LED eyes increased driver yielding from 15 to 62 percent, whereas the flashing beacon only increased yielding from 15 to 36 percent. Pedestrians stranded decreased from 17 to 6 percent for the flashing beacon and 3 percent for the animated LED eyes. The experimental design with alternating treatments could have produced some residual effects, as the animated LED eyes was tested one day and the flashing beacons could have been tested the very next day. It is not clear whether the authors addressed these residual effects in this study. Crosswalk Pavement Markings Zegeer et al. has performed the most authoritative study to date on the effectiveness of crosswalk pavement markings alone as a pedestrian crossing treatment at uncontrolled locations (31, 32). This study indicated that crosswalk markings are appropriate for crossings with certain street characteristics, such as low traffic volumes and speeds or a limited number of lanes. The study indicates that as traffic volumes, speeds, and street width increase, crosswalk markings alone are associated with a greater crash frequency than no crosswalk markings. The study recommendations indicate that the issue should not be whether or not to provide crosswalk markings on these high-volume, high-speed streets. Instead, the recommendations point to the necessity of providing other treatments in addition to crosswalk markings that will provide a safer street crossing for pedestrians. Koepsell et al. published a study of the effects of crosswalk markings on the risk of vehicle-pedestrian crashes involving older pedestrians (33). The study gathered crash data and other site characteristics (e.g., traffic and pedestrian volumes, traffic speed, signalization characteristics) from six cities in Washington State and California from 1995 to 1999. The study used a case-control design and compared 282 case sites to 564 control sites. After adjusting for the various traffic and pedestrian characteristics, the researchers found that the risk of a pedestrian-vehicle crash was 3.6 times greater at uncontrolled intersections with a marked crosswalk. These findings agree with those earlier findings of Herms in San Diego and of Zegeer et al. (31). Knoblauch and Raymond reported on a study of the effects of pedestrian crosswalk markings on vehicle speeds (34) at six sites in Maryland, Virginia, and Arizona. The study used traditional before-and-after data collection, where the “before” condition was obtained on a resurfaced arterial street (35 mph [56.3 km/h] speed limit) that had centerline and edgeline delineation but no crosswalk markings. Staged pedestrians were used to evaluate reductions in vehicle speeds under three conditions: (1) pedestrian present, (2) pedestrian looking, and (3) pedestrian not looking. As indicated by the authors, the “results of this evaluation are not clear cut.” In combining results from five of the six sites (one site had aberrant data), the crosswalk markings appear to have a very modest effect on vehicle speeds, decreasing them on average 29
TCRP/NCHRP: Improving Pedestrian Safety at Unsignalized Crossings from 0.17 to 2.1 mph (0.28 to 3.32 km/h). However, the largest speed decrease of 2.1 mph (3.32 km/h) was measured when no pedestrians were present, implying that motorists slowed simply because of the presence of crosswalk markings. The other statistically significant speed decrease of 1.62 mph (2.61 km/h) was measured for the condition of pedestrian not looking. This result follows logically, as the authors hypothesized that vehicles would likely slow for pedestrians who appear ready to step onto the roadway without looking for traffic. Jones and Tomcheck reported on a study of vehicle-pedestrian collisions at 104 intersections in Los Angeles, California, where marked crosswalks at uncontrolled intersections were not reinstalled after roadway resurfacing from February 1982 through December 1991 (35). The authors used a post hoc before-and-after study of pedestrian collision histories to document the effects of crosswalk removal. The crash history extended back to January 1979, so all beforeand-after crash histories included at least 3 years of data for each case. In considering crashes at both marked and unmarked legs of the intersections at which the marked leg was removed, the authors found that the number of pedestrian-vehicle crashes declined from 116 to 31 for equivalent time periods, a 61 percent decline. At adjacent intersections where crosswalk markings were reinstalled after resurfacing, pedestrian-vehicle crashes increased slightly from 27 to 30, thus indicating that the reduction in crashes at removed crosswalks was not simply being transferred to adjacent marked crosswalks. The authors performed statistical significance testing and found the crash reductions at the removed crosswalks to be significant. Knoblauch, Nitzburg, and Siefert reported on a study of the effects of pedestrian crosswalk markings on pedestrian and driver behavior (36). The study included 11 unsignalized intersections in four cities: Sacramento, California; Richmond, Virginia; Buffalo, New York; and Stillwater, Minnesota. The researchers considered the following behavior in the crosswalk markings evaluation: Pedestrian compliance to crossing location, Vehicle speeds, Vehicle yielding compliance, and Pedestrian behavior as related to level of caution. The authors presented the following conclusions: Drivers appeared to drive slower when approaching a marked crosswalk. The speed reductions are modest (as shown in the previous Knoblauch study) but evident nonetheless. This finding implies that most motorists are aware of the pedestrian crossing. No changes in driver yielding behavior were observed after the installation of marked crosswalks. This result implies that motorists may be slowing down just in case they are forced to stop by a pedestrian stepping into the roadway. There were no changes in blatantly aggressive pedestrian behavior after installations of marked crosswalks, indicating that pedestrians do not feel overly protected by marked crosswalks.
30
Appendix C: Literature Review of Pedestrian Crossing Treatments at Uncontrolled Locations Overall, crosswalk usage increased after marked crosswalks were installed. The authors found that single pedestrians are more likely to use marked crosswalks than a group of pedestrians traveling together. Gibby et al. analyzed pedestrian-vehicle crash data at 380 intersections on California state highways (37). The study found that crash rates at marked crosswalks were 3.2 to 3.7 percent higher than crash rates at unmarked crosswalks (after accounting for pedestrian exposure). This result corresponded to earlier work by Herms in San Diego, and also correlates to Zegeer’s study in the late 1990s. The implication is that marked crosswalks ALONE are not sufficient on multilane streets with high traffic volumes and speeds. A study by Hauck and Bates in the late 1970s examined pedestrian and motorist compliance with marked and unmarked crosswalks (38). The study concluded that there was a significant increase in pedestrian and motorist observance of crosswalks at 17 locations after these were marked. In the late 1960s, Herms examined 5 years of crash experience at 400 unsignalized intersections in San Diego, California (39, 40). The study found that nearly six times as many crashes occurred in marked crosswalks as in unmarked crosswalks. After accounting for crosswalk usage, the crash ratio was reduced to about three times as many crashes in marked crosswalks. Many have criticized this study as leading to the removal of pedestrian accommodation on city streets. Many now think that crosswalk markings should not be removed in these cases, but rather supplemented with various other types of safety treatments that enable pedestrians to cross busy roadways. Pedestrian Warning Signs and Markings Retting et al. describe the evaluation of pedestrian warning signs and markings at three signalized intersections (41). The warning sign and pavement marking prompted pedestrians to look for potential vehicle conflicts with the message “PEDESTRIANS: LOOK FOR TURNING VEHICLES.” The evaluation used a before-and-after study design at two intersections in Dartmouth, Nova Scotia (Canada), and one intersection in Clearwater, Florida. The study also examined the effects of adding only one treatment initially and then adding the second treatment later. The primary MOEs used in the study were: Percentage of pedestrians that did not look for any threats, Percentage of pedestrians that did look for various threats, and Number of conflicts between pedestrians and turning vehicles. The evaluation results indicated that the combination of a sign and pavement marking was generally more effective than only installing a single warning prompt. There did not appear to be any significant difference in the effectiveness of the treatments, although the pavement markings did yield slightly greater improvements in looking behavior. The results at individual sites are presented in Table C-5.
31
TCRP/NCHRP: Improving Pedestrian Safety at Unsignalized Crossings TABLE C-5. Percentage of Pedestrians Looking for Threats at Signalized Intersections (41). Study Location Boland Ave. and Wyse Road, Nova Scotia
Main Street and Major Street, Nova Scotia
Ft. Harrison Ave. and Pierce St., Clearwater, Florida
Measure of effectiveness Percent of pedestrians not looking for any threat Percent of pedestrians looking for all threats Number of conflicts per 100 pedestrians Percent of pedestrians not looking for any threat Percent of pedestrians looking for all threats Number of conflicts per 100 pedestrians Percent of pedestrians not looking for any threat Percent of pedestrians looking for all threats Number of conflicts per 100 pedestrians
Baseline (Before) Conditions
After Conditions (11 or 12 months after installation)
18
3
15
33
2.7
0
15
5
12
35
3.1
0
15
7
16
31
2.5
0
GENERAL DESIGN There are numerous crossing treatments that can be grouped into the general design category. Oftentimes these design elements are used in combination with one or several other primary treatments to further enhance the safety and effectiveness of pedestrian crossings. The most common examples of general design elements include: Median refuge with angled or staggered pedestrian opening, Landscaped median to discourage crossing at inappropriate location(s), No on-street parking in vicinity of crossing location, Accessible crosswalk ramps, Adequate street lighting, Shortened curb radius for shorter crossing time, and Curbside railing to direct pedestrians to appropriate crossing location(s). Median Refuge Islands Median refuge islands simplify the street crossing task by permitting pedestrians to make vehicle gap judgments for one direction of traffic at a time. Recent refuge island designs incorporate an angled or staggered pedestrian opening, which better aligns pedestrians to face the second direction of oncoming traffic. A study by Bacquie et al. compared median refuge islands and split pedestrian crossovers in an analysis of crash reports at 10 crossing locations in Toronto, Canda (42). The split pedestrian crossover treatment includes a median refuge island with pedestrian-activated signal control. The crash data were not normalized by exposure data, but some indication was given
32
Appendix C: Literature Review of Pedestrian Crossing Treatments at Uncontrolled Locations about pedestrian and vehicle exposure for the two treatments. The study found that pedestrians were seldom struck while standing on the refuge island and were more often struck while crossing due to poor gap judgment or improper driver yielding. Vehicle rear-end collisions were higher at the split pedestrian crossovers, as it is a less common form of traffic control than typical intersection signals. The authors indicated some drivers did not act uniformly when approaching the split pedestrian crossovers, as the drivers may not know when to stop or if other drivers will stop in front or behind them. ENFORCEMENT Although not an engineering treatment, enforcement can be used in conjunction with engineering treatments to improve the safety and effectiveness of pedestrian crossings. This section documents the experience with enforcement of the following: Enforcement of motor vehicle yielding (“crosswalk sting”), and Enforcement of pedestrian crossing (jaywalk enforcement). The Harborview Injury Prevention and Research Center and the Washington State Traffic Safety Commission collaborated on a study of the effects of increased police enforcement on motorist yielding (43). The State of Washington passed a law in 1990 that required motorists to stop for a pedestrian attempting to cross at a marked crosswalk (the previous law required motorists to yield). Thus, these two groups were interested in ascertaining the effects of increased enforcement on motorist yield behavior at marked crosswalks. Over a 4-year period, increased enforcement was carried out in several distinct enforcement efforts. A before-and-after study design was used to assess changes in driver yielding due to increased enforcement. Staged pedestrians were also incorporated as an element of the study design to ascertain changes in yielding behavior. The following results were reported: After the first enforcement campaign, driver yielding was unchanged at 19 percent of drivers yielding to pedestrians. The second enforcement campaign focused on specific neighborhoods and did result in modest improvements in driver yielding. The majority of drivers, however, still did not yield to pedestrians. The last two campaigns had mixed results that varied quite a bit by location. The study’s conclusions indicated that the “authors have been unable to demonstrate that law enforcement efforts directed at motorist violators of crosswalk laws significantly or consistently increase drivers’ willingness to stop for pedestrians. It appears that even with a high degree of commitment on the part of law enforcement, the expectations from such programs should remain modest.”
33
TCRP/NCHRP: Improving Pedestrian Safety at Unsignalized Crossings
APPENDIX D PEDESTRIAN CROSSING TREATMENTS SUMMARY OF ITE INFORMATIONAL REPORT The ITE Pedestrian and Bicycle Task Force prepared an Informational Report (44), which documents studies on crosswalks and warrants used by various entities. The report does not discuss the merits of providing marked crosswalks on multilane higher volume roadways but summarizes various studies on pedestrian crossings. The report also assembles in a single document the various treatments currently in use by local agencies in the United States, Canada, Europe, New Zealand, and Australia to improve crossing safety for pedestrians at locations where marked crosswalks are provided for pedestrians rather than simply removing them. Section 4 on major street crossings at uncontrolled locations and Section 7 on midblock signals are summarized in this Appendix because they directly relate to the research for TCRP D-08 on Improving Pedestrian Safety at Unsignalized Roadway Crossings. Treatments at Major Street Crossings at Uncontrolled Locations Providing marked crosswalks using two white 1-inch (2.54 cm) lines and the warning signs prescribed by various manuals as shown in Figure D-1 were found to result in higher pedestrian collisions compared to not providing marked crosswalks on multilane roads with more than one lane in each direction with average daily volumes of 10,000 vehicles per day by the FHWA study on marked crosswalks at uncontrolled locations (31). On roads with one lane in each direction and average daily volumes of less than 10,000 vehicles per day, the FHWA study found no difference in collisions involving pedestrians at marked and unmarked crosswalks at uncontrolled intersections. To respond to this finding, some agencies removed marked crosswalks on higher volume multilane facilities. Other agencies addressed this issue by experimenting with alternative treatments to improve the safety of pedestrian crossings.
Figure D-1. Pedestrian Crossing Using Traditional Treatments. (Source: Nazir Lalani, Ventura, California, U.S.A.)
34
Appendix D: Pedestrian Crossing Treatments In response to a growing need for better information on pedestrian crossing treatments to be compiled into a single comprehensive document, the ITE Pedestrian and Bicycle Task Force prepared an informational report entitled “Alternative Treatments for At-Grade Pedestrian Crossings” (44). This report summarizes information on alternative treatments at the following types of pedestrian crossings: Major street crossings at uncontrolled locations (ITE Section 4), Residential street crossings (ITE Section 5), Removal of crosswalks (ITE Section 6), Signal-controlled crossings for pedestrians (ITE Section 7), Signalized intersection crossings (ITE Section 8), and School-related crossings (ITE Section 9). For many years, marked crosswalks were installed at unsignalized roadway crossings with the minimum amount of signing and striping (as illustrated in Figure D-1). The FHWA report entitled “Safety Effects of Marked vs. Unmarked Crosswalks at Uncontrolled Crossing Locations (31) clearly identified the safety limitations of providing such crossings on higher volume multilane facilities. Section 4 of the ITE Informational Report specifically discusses 25 treatments to enhance safety at uncontrolled pedestrian crossings, including the following: • • • • • • • • •
• • • • • • • •
Automated detection, Antiskid surfacing, Curb extensions, Curb ramps, Flags, Flashing beacons, In-roadway signs, Lane reductions, Markings/legends,
Overhead signs, Pedestrian railings, Raised markers (with LEDs), Refuge islands, Street lighting, Textures surfacing, Tactile surfaces, and Turn restrictions.
Section 4 of the ITE Information Report (44) provides a summary of treatments being used throughout North America and the rest of the world to enhance pedestrian safety at unsignalized roadway crossings. The information contained in Section 4 of the ITE Informational Report (44) is summarized in this section of the Appendix. Table D-1 summarizes a variety of treatments currently used by agencies to improve safety of marked crosswalks at uncontrolled locations. Evaluation studies are cited where such information was found to be available and listed in the reference section of the Appendix.
35
TCRP/NCHRP: Improving Pedestrian Safety at Unsignalized Crossings TABLE D-1. Summary of Treatments for Major Street Crossings at Uncontrolled Locations. Treatment Type Roadway Signing Description – Special signs are placed in the roadway within or near the crosswalk. • Application – Crossing on higher volume multilane roads • Cost (Including Labor) in U.S. Dollars – $200– $300 per sign • Studies of Effectiveness – Field Evaluation Report (45), Pedestrian Facilities Guidebook (46) • Countries Where Treatment is Used – U.S.A., France, Sweden
Picture of Treatment
New York, U.S.A. High-Visibility Markings Description – This method uses ladder- or “zebra”style crosswalk pavement markings. • Application – Crossings on higher-volume multilane roads • Cost (Including Labor) in U.S. Dollars – $500$1,000 per crossing • Studies of Effectiveness – See section 6.2 of ITE Informational Report (44) • Countries Where Treatment is Used – U.S.A., Europe, Australia, New Zealand Puget Sound Area, Washington, U.S.A. Double-Posted Pedestrian Crossing Signs Description – Standard pedestrian crossing signs are installed on both sides of the approaching roadway at an uncontrolled crosswalk in addition to the near-side pedestrian warning signs posted at and in advance of the crosswalk. • Application – Uncontrolled marked crosswalk • Cost (Including Labor) in U.S. Dollars – $200 per sign • Studies of Effectiveness – None found • Countries Where Treatment is Used – U.S.A., Canada Near Downtown Los Angeles, California, U.S.A.
36
Appendix D: Pedestrian Crossing Treatments
TABLE D-1. Summary of Treatments for Major Street Crossings at Uncontrolled Locations (continued). Treatment Type Advance Placement of Limit Lines Description – Standard white Stop or Yield limit lines are placed typically 20 ft (6 m) in advance of marked, uncontrolled crosswalks. • Application – Crossings on higher volume multilane roads • Cost (Including Labor) in U.S. Dollars – $300$500 per limit line • Studies of Effectiveness – Van Houten and others (27, 47), Innovative Traffic Control Technology (48) • Countries Where Treatment is Used – U.S.A., Canada
Picture of Treatment
Canada Zigzag and Other Approach Restrictions Description – “zigzag” markings are placed in advance of marked crosswalks. The standard pattern is four sets of markings on each approach. One set comprises two strokes (zig and zag), each approximately 6.6 ft (2 m) long. • Application – All marked crossings • Cost (Including Labor) in U.S. Dollars – $1,000$2,000 per crossing; four sets of markings • Studies of Effectiveness – The Highway Code (49) • Countries Where Treatment is Used – U.K., Eire London, England, U.K. Pavement Legends Description – Word legends are placed on the pavement at each end of the crosswalk to be legible to pedestrians as they are waiting to cross. • Application – Marked crosswalks with high turning volumes • Cost (Including Labor) in U.S. Dollars – $500 per crosswalk • Studies of Effectiveness – Habib (50) • Countries Where Treatment is Used – U.K., U.S.A. London, England, U.K.
37
TCRP/NCHRP: Improving Pedestrian Safety at Unsignalized Crossings TABLE D-1. Summary of Treatments for Major Street Crossings at Uncontrolled Locations (continued). Treatment Type Flags Description – Pedestrians select a flag from those posted on each side of the crosswalk, flag traffic to let drivers know they wish to cross, then return the flag to the holder on the opposite side of the street after crossing. • Application – Crossings on higher volume multilane roads • Cost (Including Labor) in U.S. Dollars – $100 including holding racks per crossing • Studies of Effectiveness – None found • Countries Where Treatment is Used – U.S.A.
Picture of Treatment
Kirkland, Washington, U.S.A. Fluorescent Yellow Green Signs Description – Pedestrian signs made of the FHWAapproved fluorescent yellow-green color are posted at crossings. • Application – Pedestrian and bicycle crossings including schools • Cost (Including Labor) in U.S. Dollars – $200$300 per sign • Studies of Effectiveness – Kittle (51) • Countries Where Treatment is Used – U.S.A.
Austin, Texas, U.S.A. Overhead Signs Description – Warning signs are installed using span wire or mast arms. • Application – Crossings on higher volume multilane roads • Cost (Including Labor) in U.S. Dollars – $15,000$25,000 per overhead sign • Studies of Effectiveness – None found • Countries Where Treatment is Used – U.S.A., Canada
Tucson, Arizona, U.S.A.
38
Appendix D: Pedestrian Crossing Treatments TABLE D-1. Summary of Treatments for Major Street Crossings at Uncontrolled Locations (continued). Treatment Type Refuge Islands Description – Raised islands with minimum dimension of 4-6 ft (1.2-1.8 m) wide and 8-12 ft (2.4-3.6 m) long are placed in the center of the roadway, separating opposing lanes of traffic and slotted along the pedestrian path. • Application – Marked and unmarked crossings • Cost (Including Labor) in U.S. Dollars – $20,000$40,000 per island • Studies of Effectiveness – Lalani (52) • Countries Where Treatment is Used – U.S.A., Europe, Australia, Canada, New Zealand
Picture of Treatment
Austin, Texas, U.S.A. Anti -Skid Surfacing Description – Application to pavements of a unique surface treatment improves skid resistance during wet weather. • Application – Any pedestrian crossing • Cost (Including Labor) in U.S. Dollars – $2,000$4,000 for two approaches • Studies of Effectiveness – London Research Centre (53) • Countries Where Treatment is Used –Europe
United Kingdom Pedestrian Railing Description – Railings are placed along the top of the curb; typically they must be 4 ft (1.2 m) high to be effective. • Application – Any pedestrian crossing • Cost (Including Labor) in U.S. Dollars – $100 per linear meter • Studies of Effectiveness – Lalani (54) • Countries Where Treatment is Used – Europe, Australia
United Kingdom
39
TCRP/NCHRP: Improving Pedestrian Safety at Unsignalized Crossings TABLE D-1. Summary of Treatments for Major Street Crossings at Uncontrolled Locations (continued). Treatment Type In-Pavement Raised Markers Description – Both sides of a crosswalk are lined with durable encased raised pavement markers, typically containing amber LED strobe lighting activated either by push buttons or by automatic detection bollards using infrared sensors. • Application – Some agencies have guidelines, see ITE Report (44) • Cost (Including Labor) in U.S. Dollars – $15,000$40,000 per crossing • Studies of Effectiveness – Huang et al. (55), InPavement (56), Godfrey and Mazzella (57) • Countries Where Treatment is Used – U.S.A.
Picture of Treatment
Orlando, Florida, U.S.A. Street Lighting Description – Lights are installed, generally 150-watt bulbs at 100 ft (30 m) spacing, 10 to 11.5 ft (3 to 3.5 m) high, on both sides of the street. • Application – Crossings with high nighttime activity • Cost (Including Labor) in U.S. Dollars – $2,000$3,000 per light • Studies of Effectiveness – Lalani (58) • Countries Where Treatment is Used – All Developed Countries Ventura, California, U.S.A. Flashing Beacons Description – Flashing amber lights are installed on overhead signs, signs in advance of the crosswalk, or signs located at the entrance to the crosswalk on pedestal poles. • Application – Marked uncontrolled crossings • Cost (Including Labor) in U.S. Dollars – $10,000$40,000 per crossing depending on placement • Studies of Effectiveness – Van Houten and Malenfant (59) • Countries Where Treatment is Used – U.K., U.S.A., Australia, Canada, and New Zealand Austin, Texas, U.S.A.
40
Appendix D: Pedestrian Crossing Treatments TABLE D-1. Summary of Treatments for Major Street Crossings at Uncontrolled Locations (continued). Treatment Type Curb Extensions The sidewalk extends across the parking lanes to the edge of the travel lanes to narrow the distance of the road that a pedestrian has to cross. • Application – Any crossing • Cost (Including Labor) in U.S. Dollars – $5,000$25,000 depending on materials used • Studies of Effectiveness – Ewing (60) and Canadian Guide (61) • Countries Where Treatment is Used – U.S.A., U.K., Eire, Australia, Canada
Picture of Treatment
Bozeman, Montana, U.S.A. Lane Reductions Description – The number of travel lanes are reduced by the number of travel lanes by widening the sidewalks, adding bike and parking lanes, converting parallel parking to angled or perpendicular parking, or converting one-way streets to two-way with a center median. • Application – Segments of roadway • Cost (Including Labor) in U.S. Dollars – $50,000$5,000,000 depending on length of project • Studies of Effectiveness – None found • Countries Where Treatment is Used – U.S.A., Canada [Example shown is U.K.] United Kingdom Textured Surfaces Description – Crosswalks are constructed with stamped concrete or asphalt, as well as brick pavers laid in a pattern. • Application – Any crossing • Cost (Including Labor) in U.S. Dollars – $10,000$35,000 per crossing • Studies of Effectiveness – Ewing (60) and Canadian Guide (61) • Countries Where Treatment is Used – U.S.A., Europe, Canada Boulder, Colorado, U.S.A.
41
TCRP/NCHRP: Improving Pedestrian Safety at Unsignalized Crossings TABLE D-1. Summary of Treatments for Major Street Crossings at Uncontrolled Locations (continued). Treatment Type Tactile Ground Surface Indicators Description – Various patterned, tactile ground, or floor surfaces provide directional and hazard warning information to pedestrians who are blind or visually impaired. • Application – Any crossing used by the visually impaired • Cost (Including Labor) in U.S. Dollars – $50$200 per square meter • Studies of Effectiveness – Tactile (62), Guidance (63), Savil et al. (64, 65), Japanese (66), Sawai et al. (67) • Countries Where Treatment is Used U.S.A., Europe/U.K., Australia, Canada Automated Detection Description – Uncontrolled crosswalks are fitted with automated detection devices that activate flashing beacons, in-pavement raised markers with LED strobe lights, or other active warnings to alert drivers when pedestrians are present • Application – Any crossing with active devices • Cost (Including Labor) in U.S. Dollars – $500$1,000 for microwave and infrared, $15,000$20,000 for video cameras • Studies of Effectiveness – Huang et al. (55) • Countries Where Treatment is Used – U.S.A., Europe, Canada, Australia
Picture of Treatment
United Kingdom
Portland, Oregon, U.S.A. Reduced Curb Radii Description – Corner curbs have shorter radii to narrow the distance of the road that a pedestrian has to cross. • Application – Crossings with minimal truck turns • Cost (Including Labor) in U.S. Dollars – $5,000$10,000 per corner • Studies of Effectiveness – Ewing (60) and Canadian Guide (61) • Countries Where Treatment is Used – U.S.A., Europe, Canada, Australia, and most developed countries Ventura, California, U.S.A.
42
Appendix D: Pedestrian Crossing Treatments TABLE D-1. Summary of Treatments for Major Street Crossings at Uncontrolled Locations (continued). Treatment Type Staggered Pedestrian Refuge Islands Description – Raised islands laid out in a staggered configuration at uncontrolled intersections require pedestrians to walk toward traffic to reach the second half of the crosswalk. • Application – Across multilane roads • Cost (Including Labor) in U.S. Dollars – $25,000$75,000 • Studies of Effectiveness – Bacquie et al. (42) • Countries Where Treatment is Used – U.S.A., Europe
Picture of Treatment
San Luis Obispo, California, U.S.A. Detectable Warnings Description – A standardized surface feature composed of raised truncated domes that informs pedestrians who are visually impaired of the hazards immediately ahead. • Application – Ramps and curbs adjacent to crossings • Cost (Including Labor) in U.S. Dollars – $200$2000 per ramp or curb depending on total area • Studies of Effectiveness – Bentzen and others (68, 69, 71, 72), Hauger et al. (69),Hughes (70) • Countries Where Treatment is Used – Europe, U.S.A., Australia Roseville, California, U.S.A. Left-Turn Restrictions Description – Curbed islands that restrict left turns from side street approaches onto the street where marked crosswalks are located. • Application – Uncontrolled intersections with marked crosswalks • Cost (Including Labor) in U.S. Dollars – $25,000$35,000 per crossing island • Studies of Effectiveness – None found • Countries Where Treatment is Used – U.S.A.
U.S.A.
43
TCRP/NCHRP: Improving Pedestrian Safety at Unsignalized Crossings TABLE D-1. Summary of Treatments for Major Street Crossings at Uncontrolled Locations (continued). Treatment Type Setback Crossings Description – Crosswalks at unsignalized intersections are set back by 9.8 ft (3 m) or more from the crossstreet flow line or curb. • Application – Narrow approaches to intersections • Cost (Including Labor) in U.S. Dollars – $100 per linear meter for pedestrian railing needed for this application • Studies of Effectiveness – None found • Countries Where Treatment is Used – U.K.
Picture of Treatment
Edinburgh, Scotland, U.K.
Midblock Signal-Controlled Crossings for Pedestrians Section 7 of the ITE Informational Report (44) summarizes the use of signals that are installed for pedestrian crossings. One of the applications is at intersections, such as in Canada, where the pedestrian crossing is signalized but the intersection side street approaches are controlled by STOP signs. Most of the applications in the U.S.A., Canada, Australia, and the U.K. are at midblock locations. These treatments have been placed in a separate section because they are not at signalized intersections and their operations are significantly different from pedestrian crossings at signalized intersections. The section discusses the following types of crossings: Intersection pedestrian signals, HAWKs, Midblock signals, Pedestrian intersection crossings, Pelican, Puffins, and Toucans. Table D-2 summarizes the information contained in Section 7 of the ITE Informational Report (44).
44
Appendix D: Pedestrian Crossing Treatments TABLE D-2. Summary of Midblock Signal-Controlled Crossings for Pedestrians. Treatment Type Midblock Signal-Controlled Pedestrian Crossings with Flashing Red Description – At a signal-controlled midblock crosswalk, drivers either stop for 12 to 20 seconds during the steady red signal indication displayed during the WALK interval or pause for 4 to 7 seconds during a flashing red indication that signals the DON’T WALK interval. • Application – Midblock locations in high pedestrian activity areas such as downtowns • Cost (Including Labor) in U.S. Dollars – $50,000$100,000 per installation • Studies of Effectiveness – None found • Countries Where Treatment is Used – U.S.A.
Picture of Treatment
Los Angeles, California, U.S.A. Midblock Signal-Controlled Pedestrian Crossings Description – At a signal-controlled midblock crosswalk, drivers stop at the steady red indication – activated by push button – displayed on either WALK or DON’T WALK intervals, and may only proceed once the signal turns green. • Application – Midblock locations in high pedestrian activity areas such as downtowns • Cost (Including Labor) in U.S. Dollars – $50,000$100,000 per installation • Studies of Effectiveness – Glock et al. (4) • Countries Where Treatment is Used – Canada, U.S.A. Tucson, Arizona, U.S.A. Intersection Pedestrian Signals (Half-Signals) Description – Signals installed at intersections control traffic at crosswalks on the major streets. The side street is controlled by STOP signs, while no signal indications are provided for the minor street traffic. • Application – Signalized pedestrian crossings with the side street STOP signs • Cost (Including Labor) in U.S. Dollars – $50,000$100,000 per installation • Studies of Effectiveness – Unpublished study by City of Portland, Oregon • Countries Where Treatment is Used – Canada, U.S.A. Portland, Oregon, U.S.A.
45
TCRP/NCHRP: Improving Pedestrian Safety at Unsignalized Crossings
TABLE D-2. Summary of Midblock Signal-Controlled Crossings for Pedestrians (continued). Treatment Type Pelican Crossings Description – Pedestrian light controlled crossings (Pelican) control vehicular traffic at midblock crosswalks with either a steady red signal (stop), flashing amber indication (proceed if no pedestrians), or steady green signal (proceed). • Application – Midblock locations in high pedestrian activity areas • Cost (Including Labor) in U.S. Dollars – $50,000-$100,000 • Studies of Effectiveness – Lalani (54) and Traffic Advisory Unit (71) • Countries Where Treatment is Used – U.K., Australia, U.S.A., Eire Puffin Crossings Description – Pedestrian user friendly intelligent (Puffin) crossings are similarly constructed as Pelicans, but provide more flexibility in crossing time for pedestrians, use nearside pedestrian signal heads as opposed to farside, and provide an extendable all-red crossing period using microwave, infrared, and other types of overhead detection. • Application – Midblock locations in high pedestrian activity areas • Cost (Including Labor) in U.S. Dollars – $50,000-$100,000 • Studies of Effectiveness – Lalani (54) and Department of Transportation (72) • Countries Where Treatment is Used – U.K., Australia, U.S.A., Eire
Picture of Treatment
Victoria, Australia
Victoria, Australia
46
Appendix D: Pedestrian Crossing Treatments TABLE D-2. Summary of Midblock Signal-Controlled Crossings for Pedestrians (continued). Treatment Type Toucan Crossings Description – Toucan crossings (two can cross) are similar in vehicular detection to the Pelican and Puffin crossings and in pedestrian on-crossing detector to the Puffin crossing, but differ in providing bicycle signals for bicyclists and displaying dark pedestrian/bicycle signals instead of the flashing green walking figure. • Application – Midblock locations in high pedestrian and bicycle activity areas • Cost (Including Labor) in U.S. Dollars – $75,000-$100,000 • Studies of Effectiveness – London (73,74) • Countries Where Treatment is Used – U.K., U.S.A. HAWK Crossings Description – The High-intensity activated crosswalk (HAWK) signaling system in Tucson, Arizona, is a combination of a beacon flasher and a traffic control signaling technique for marked crossings that remains off unless activated by a pedestrian. • Application – In high pedestrian areas • Cost (Including Labor) in U.S. Dollars – $40,000-$60,000 • Studies of Effectiveness – Glock (4) • Countries Where Treatment is Used – Canada, U.S.A.
Picture of Treatment
Tucson, Arizona, U.S.A.
Tucson, Arizona, U.S.A.
47
TCRP/NCHRP: Improving Pedestrian Safety at Unsignalized Crossings NEW CROSSING TREATMENTS Staggered Crosswalks with Speed Monitoring Signs in Phoenix, Arizona The city of Phoenix, Arizona, installed an offset crosswalk in mid-August 2002 prior to the beginning of the school year. The location is at an intersection directly in front of a large high school in North-Central Phoenix. Previously, two marked crosswalks served the school, but one was at a location of concern (directly behind an area where the roadway was raised for a canal). This vertical curve made the crosswalk less visible to traffic approaching from the west. Additionally, the other, primary, crosswalk crossed two westbound lanes, a two-way left-turn lane, and three eastbound lanes. During the morning student drop-off hours, safety concerns centered on vehicular traffic backing up in the two-way left-turn lane through the crosswalk, waiting to turn left into the school parking lot. The parent-teacher group at the high school was well organized and vocal, and they successfully publicized their concerns by holding a large public forum requesting that the city “solve” this problem by installing a signal. The crosswalk location was awkward for signalization, as spacing was poor and a signal could not be made to fit within the current synchronized signal system. Phoenix staff worked with the parent-teacher group, students, and school officials to find ways of improving safety at the primary crosswalk and eliminating the secondary crossing location, prohibiting students from crossing at that location. The primary crosswalk was already eligible for enhancement under a citywide School Safety Improvement Program by which school-related crosswalks would have oversized fluorescent yellow-green crossing signs installed and the word SCHOOL stenciled in each lane. After analyses, Phoenix staff suggested adding a European flavor (staggering the crosswalk), along with further testing of experimental speed monitors that looked promising for use based on experimentation at two other locations in Phoenix. Staggering crosswalks is a practice used selectively in Great Britain. The practice recognizes the simple fact as streets get wider, they become more difficult to successfully navigate across the street. Crossing requires sizable gaps in the traffic stream, which do not appear as frequently as desired, and impatient pedestrians may be tempted to take chances. Additionally, on two-way streets, pedestrians are required to look both ways to assure safe separation exists. Using an offset crosswalk improves both of those situations. For the staggered crosswalk to work effectively, it is essential to have a safe refuge in the center of the street. To accomplish this, Phoenix built a raised island in the middle of what used to be a two-way left-turn lane. To work most effectively, the offset also needs to be designed to direct pedestrians toward the traffic stream they are about to cross. To curtail short-cutting and to force pedestrians to follow the intended path, the city outlined the raised median island with attractive fencing to “corral” the students. Students approach the crosswalk facing traffic going in the direction that they must cross. They cross to the refuge island, where the fencing requires them to turn at a right angle and pause, separately crossing the second half of the street. Again, as they enter that traffic stream they are facing the traffic in which they want to pick a gap. To provide comfortable room for pedestrians and have room for ramp slopes (and to reserve room for fencing), it is desirable that the raised median island be a minimum of 8 ft wide. In this case, the island was built 9 ft (2.7 m) wide, which required narrowing the through lanes past the raised
48
Appendix D: Pedestrian Crossing Treatments island. This has been found to inhibit speeding, in a gentler manner than chicanes accomplish on local residential streets. Additionally, Phoenix added some innovation by installing some experimental speed monitor signs on the approaches to the school. These speed monitors work in the same manner as speed trailers, since they have built-in radars that measure speeds of approaching drivers and depict them on a changeable message sign. Phoenix bought some additional features in the speed monitors: at this offset crosswalk location there is a feature whereby above a certain speed threshold, a white beacon goes off (much the same as with photo enforcement flashes). While drivers are not given citations, the feature is effective in reducing speeds. At other locations where speed monitors are used, they are designed to activate a changeable sign so above certain threshold speeds, the monitors indicate SLOW NOW. Figure D-2 shows pictures of the staggered crosswalk installation in Phoenix. Although this crossing is near a school, this type of design can be used at any crossing location.
Figure D-2. Staggered Crosswalk in Phoenix, Arizona. (Source: James Sparks, Phoenix, Arizona, U.S.A.) Figure D-3 shows a similar installation in the Las Vegas area of Nevada. This location does not include the pedestrian railing on the island, which is a prominent feature of the British design.
49
TCRP/NCHRP: Improving Pedestrian Safety at Unsignalized Crossings
Figure D-3. Staggered Crosswalk in the Las Vegas Area of Nevada. (Source: Rich Romer, Las Vegas, Nevada, U.S.A.) Pedestrian-Activated Beacons and Lights in Salt Lake City, Utah In March 2001, Salt Lake City’s first pedestrian-actuated overhead flashing beacons were installed over a busy four-lane street at a high pedestrian volume crosswalk. This device consists of one beacon over each travel lane on the approach to the crossing and two pedestrian crosswalk signs mounted back to back hung overhead (see Figure D-4). The beacons flash in an alternating pattern once the pedestrian pushes the activation button for a period equivalent to the pedestrian clearance interval plus 10 seconds. A second pedestrian-activated flashing beacon-type crosswalk has been installed and an existing constantly flashing installation has been converted to pedestrian-actuated activation. These installations cost $9000, compared to $25,000 for in-pavement flashing marker-type installations when used with existing utility poles with overhead power in close proximity.
Figure D-4. Pedestrian-Activated Flashing Beacons in Salt Lake City, Utah. (Source: Tim Harpst, Salt Lake City, Utah, U.S.A.)
50
Appendix D: Pedestrian Crossing Treatments A further enhancement of this system is the addition of crosswalk nighttime illumination activated by a pedestrian pushbutton (see Figure D-5). During nighttime hours, street lighting attached to the crosswalk mast arm configured to illuminate the crosswalk area is lit at 30 percent capacity. When the pedestrian pushbutton is activated, the light illuminates the crosswalk at full capacity during the time that the overhead flashers are activated. Salt Lake City uses this only where there are high pedestrian flows during evening hours. These installations were reported in the November –December 2002 ITE District 6 newsletter, the Westernite (75).
Figure D-5. Pedestrian-Activated Beacons with Light Illumination in Salt Lake City, Utah. (Source: Tim Harpst, Salt Lake City, Utah, U.S.A.) Triple-Four High-Visibility Markings in Sacramento, California Triple-four high-visibility markings are used in Sacramento, California, to make unsignalized pedestrian crossings more visible to drivers. This treatment is a variation of the ladder or zebra style of high-visibility markings. The city’s Pedestrian Safety Guidelines (76) indicate that this treatment should be used where: Sufficient demand exists to justify the justify the installation of a crosswalk; The location is 300 ft (91.4 m) or more from a controlled crossing location; The location has sufficient sight distance, or sight distance will be improved prior to crosswalk marking; and Safety considerations do not preclude a crosswalk. Figure D-6 shows an example of such an installation.
51
TCRP/NCHRP: Improving Pedestrian Safety at Unsignalized Crossings
Figure D-6. Triple-Four High-Visibility Markings in Sacramento, California. (Source: Nazir Lalani, Ventura County, California, U.S.A.) Five-Bar Triangle Advance Crosswalk Pavement Markings in Salt Lake City, Utah Salt Lake City staff designed a five-bar triangle advance crosswalk pattern for use at midblock crosswalks on higher speed streets (see Figure D-7). The pattern consists of five rectangular white pavement markings, sized and placed to form triangles on travel lanes in advance of midblock crossings. The markings alert the presence of pedestrians at unsignalized crossings on high-volumes streets. The pattern has been installed at four locations at a cost of $75 per triangle per lane.
Figure D-7. Five-Bar Triangle Advance Crosswalk Pavement Markings in Salt Lake City, Utah. (Source: Tim Harpst, Salt Lake City, Utah, U.S.A.) In-Roadway Signs at Michigan State University, East Lansing, Michigan In response to a series of pedestrian-related collisions at unsignalized pedestrian crossings, Michigan State University re-engineered midblock pedestrian crossings by installing high-visibility markings and yellow triangular “Yield to Pedestrians” signs. These signs were positioned on the leading edge of the high-visibility markings (see Figure D-8). The university staff reported (77) very positive results from this treatment.
52
Appendix D: Pedestrian Crossing Treatments
Figure D-8. In-Roadway Sign Type in East Lansing, Michigan (77). Crosshatched Crosswalk Markings in Arcadia, California Diagonal markings highlight a pedestrian crossing area adjacent to a post office where 4000 pedestrians per day cross after parking across the street (see Figure D-9). The marked section is 110 ft (33.5 m) long and 28 ft (8.5 m) wide. The pavement was raised by 2 inches (5.1 cm) to create an elevated section. The area is bounded by patterned pavement surfacing at each end of the diagonally marked area to ramp traffic up to the elevated section. The patterned paving creates an audible rumble when vehicles travel over it, thereby giving notice to pedestrians that traffic is approaching.
Figure D-9. Crosshatched Crosswalk Markings in Arcadia, California. (Source: Ed Cline, Arcadia, California, U.S.A.) Overhead Animated Eye Display at Midblock Crossings Animated eye display uses an LED pedestrian signal head and adds animated eyes that scan from side to side at signalized intersections (see Figure D-10). The device uses narrow (8 degree) field of view LEDs on a black background. At signalized intersections, the display is 53
TCRP/NCHRP: Improving Pedestrian Safety at Unsignalized Crossings highly visible to pedestrians while limiting pedestrian signal displays to drivers. The blue LEDs present to the pedestrian a display consisting of two blue eyes with blue eyeballs that appear to scan from left to right at the rate of one cycle per second. Animated eyes displays are designed to encourage pedestrians to look for turning vehicles traveling on an intersecting path by including a prompt as part of the pedestrian signal display. In this adaptation in the Puget Sound area of Washington, the animated eyes are displayed to drivers approaching midblock crosswalks to encourage them to look for pedestrians. A beacon also flashes when the pedestrian activates the animated eye display.
Figure D-10. Overhead Animated Eye Display in the Puget Sound Area, Washington. (Source: Julie Mercer-Matlick, Olympia, Washington, U.S.A.) Midblock Crosswalk with Overhead Signs and Pedestrian Refuge Island The treatment shown in Figure D-11 shows a midblock unsignalized pedestrian crossing with overhead signs, high-visibility markings, and a pedestrian refuge island.
Figure D-11. Midblock Crosswalk with Overhead Signs and Pedestrian Refuge Island. (Source: Susie Stephens “Crossing the Street” Presentation at the Probike Prowalk Conference, Minneapolis, St. Paul, Minnesota, U.S.A.)
54
Appendix D: Pedestrian Crossing Treatments
Figure D-12 shows a similar installation on a multilane arterial street which includes curb extensions in the parking lanes to narrow the crosswalk.
Figure D-12. Midblock Crosswalk with Overhead Signs, Pedestrian Refuge Island, and Curb Extensions. (Source: Susie Stephens “Crossing the Street” Presentation at the Probike Prowalk Conference, Minneapolis, St. Paul, Minnesota, U.S.A.) Midblock Crosswalk with High-Visibility Markings, Pedestrian Refuge Island, and InPavement Flashing Markers The treatment shown in Figure D-13 at a midblock crossing includes high-visibility markings, a pedestrian refuge, and in-pavement flashing lights.
Figure D-13. Midblock Crosswalk with Median Refuge Island and In-Pavement Flashing Markers. (Source: Susie Stephens “Crossing the Street” Presentation at the Probike Prowalk Conference, Minneapolis, St. Paul, Minnesota, U.S.A.) 55
TCRP/NCHRP: Improving Pedestrian Safety at Unsignalized Crossings
Crosswalk with Double-Piano Type Markings The double–piano (DP) style markings eliminate marking material from the middle 1/3 of a ladder crosswalk marking (see Figure D-14). The marked portion of the DP crosswalk provides between 5 ft (1.5 m) and 9 ft (2.7 m) of additional sight distance and stopping clearance between pedestrians in the clear zone and approaching motorists. The unmarked “clear zone” reduces the risk of pedestrian slips and falls in wet weather. Separation in longitudinal lines has not been shown to reduce motorist visibility. The DP pattern modifies the ladder design by striping the pattern to avoid wheel track tire wear. The modified striping pattern reduces vehicular skidding and sliding and reduces marking material replacement cost by up to five times less than other markings. It also retains markings in same ratio (1/3 marked, 2/3 unmarked) that has been found to be most visible to motorists from prior FHWA research. The DP pattern minimizes the potential for pedestrian slips, vehicular skids, replacement costs, and sight distance conflicts and better channels high peak hour pedestrian crossing volumes. As with any crosswalks, DP markings are best used in combination with stop lines and signing for unsignalized/uncontrolled midblock crossings. The New York Department of Transportation is creating a proposal that will be submitted to the Federal Highway Administration, as required per Section 1A.10 of the MUTCD, to obtain permission to install and evaluate a DP marking design for midblock pedestrian and shared use path crossings.
Figure D-14. Crosswalk with Double Piano Style Markings in New York State. (Source: James Ercolano, Albany, New York, U.S.A.)
56
Appendix D: Pedestrian Crossing Treatments In-Roadway Signs at Crosswalks in New York State In combination with a change in law (78) to strengthen the requirement for drivers to yield to pedestrians, the State of New York DOT is deploying an in-roadway sign located in the crosswalk to reduce pedestrian-related collisions. Two types of signs used by NYDOT are shown in Figure D-15.
Figure D-15. In-Roadway Signs at Crosswalks in New York State. (Source: James Ercolano, Albany, New York, U.S.A.) TREATMENTS USED IN EUROPE FHWA and AASHTO sponsored a European scanning tour focused on innovative safety practices in the planning, design, operation, and maintenance of signalized intersections or junctions. The scanning tour took place from May 10 through 26, 2002. The scanning team visited Sweden, Germany, the Netherlands, and the United Kingdom. This section of the report presents midblock pedestrian crossing treatments observed during the scan. A summary report was prepared and published by FHWA in July 2002 (79). Midblock Crossing in Frankfurt, Germany Unsignalized midblock crossings are frequently installed in the urbanized areas of Germany where there are large numbers of pedestrians needing to cross the street, especially near transit stops. Many cities have tram lines with station platforms located in the center of major streets at midblock locations. Figure D-16 shows a midblock unsignalized pedestrian crossing with four ground-mounted and overhead standard blue and white Europe pedestrian crossing signs facing each direction of approach traffic, pedestrian-activated flashing beacons, pedestrian refuge island, and high-visibility markings. Transit stops are located on each side of the crossing.
57
TCRP/NCHRP: Improving Pedestrian Safety at Unsignalized Crossings
Figure D-16. Midblock Crossing in Frankfurt, Germany. Painted Midblock Crossing in Stockholm, Sweden Midblock crosswalks at unsignalized locations are painted on the pavement in such a way as to create an optical illusion that there is a raised crosswalk. Multiple colors create the optical illusion. No documentation was provided as to how often the crosswalk has to be repainted or whether there are any pedestrian safety benefits. Figure D-17 shows a typical location in Stockholm.
Figure D-17. Painted Raised Crosswalk in Stockholm, Sweden. Midblock Crossing near Copenhagen, Denmark Midblock crossings in Copenhagen are provided with high-visibility ladder-type markings, curb extensions (sometimes only on one side), and the standard European blue and white pedestrian crossings mounted overhead with flashing yellow beacons that are activated by pedestrians. Low-pressure sodium lighting is present along one side of the street. Figures D-18 and D-19 show typical midblock crossings incorporating these treatments. The second location also includes a raised crosswalk.
58
Appendix D: Pedestrian Crossing Treatments
Figure D-18. Midblock Crossing in Copenhagen, Denmark. (Source: Karen Whitehouse, Ventura, California, U.S.A.)
Figure D-19. Midblock Crossing with Raised Crosswalk in Copenhagen, Denmark. (Source: Karen Whitehouse, Ventura, California, U.S.A.) Midblock Crossing with Refuge Island in the U.K In Figure D-20, the marked midblock crossing with refuge island is provided with internally illuminated bollards to provide nighttime illumination. Standard blue and white signing is present to illustrate to drivers the correct side of the island. Figure D-21 shows the center median striped with diagonal markings and the pavement is colored with a red pigmentation to highlight the median and the center refuge island area.
59
TCRP/NCHRP: Improving Pedestrian Safety at Unsignalized Crossings
Figure D-20. Midblock Crossing with Refuge Island in the U.K. (Source: Nazir Lalani, Ventura County, California, U.S.A.)
Figure D-21. Midblock Crossing with Refuge Island and Color-Treated Median in the U.K. (Source: Nazir Lalani, Ventura County, California, U.S.A.)
60
Appendix D: Pedestrian Crossing Treatments Midblock Crossing with Refuge Island in the Netherlands Figure D-22 shows a midblock crossing that incorporates a raised crosswalk with the standard blue and white European pedestrian crossing signs mounted overhead, high-visibility markings, a pedestrian refuge with internally illuminated bollards, and Keep Right signs. This crossing serves high pedestrian and bicycle traffic during commute times and weekends and is part of a bike path system.
Figure D-22. Midblock Crossing with Refuge Island in the Netherlands. COMMENTS ON UNCONTROLLED CROSSINGS AND MIDBLOCK SIGNAL TREATMENTS The initial section of this Appendix summarizes treatments identified in the ITE Informational Report (44) on major street uncontrolled crossings and midblock signals used mainly in Europe and Australia. The next sections identify additional treatments used at unsignalized crossings that have been recently implemented since the ITE Informational Report was prepared and summarize treatments that were documented during a scanning tour of Europe sponsored by FHWA/AASHTO in May 2002. A review of the treatments in this appendix indicates that the following treatments are well used or gaining in popularity. In-Roadway Signs A variety of in-roadway sign treatments have been used by a variety of agencies. Results from their use seem to indicate an improvement in driver awareness of pedestrians using crosswalks. This treatment may be especially useful on major streets with one travel lane in each direction. In-Pavement Flashing Markers In-pavement flashing markers are being used by public agencies in the western United States, especially in those states where snow removal is not an issue. Treatments that include pedestrian crossing signs with flashing LEDs and also flashing beacons ahead of the crosswalk seem to be the most effective.
61
TCRP/NCHRP: Improving Pedestrian Safety at Unsignalized Crossings Pedestrian Refuge Islands Pedestrian refuge islands have been extensively used in a variety of locations to improve pedestrian safety and mobility. The crossings where such islands are used also incorporate highvisibility markings, overhead and ground-mounted signing, advance signing, and overhead flashing beacons. Canada has its own version of this type of crossing called a split pedestrian crossover. A number of agencies have recently installed staggered pedestrian refuge islands that require pedestrians to walk toward approaching traffic while on the refuge island. These locations should be studied to determine their effectiveness. Smart Crosswalks with Activated Flashing Beacons/Overhead Sign Legends Midblock pedestrian crossings have been implemented by several agencies in the western states of the United States where overhead flashing beacons are installed on mast arms or span wires suspended over the crossing. The beacons are activated by passive detectors when pedestrians enter the detection zone in the vicinity of the wheelchair ramp. Most of these locations also include high-visibility markings and advance signing to supplement the overhead signs and beacons. Some agencies such as Tucson, Arizona, use crossings with overhead activated flashing signs displaying a message to drivers indicating that they should stop for crossing pedestrians. These types of treatments may have wider applicability depending on their effectiveness. Midblock Signals The initial section of this Appendix summarizes the information contained in the ITE Informational Report on the following types of midblock signals: Midblock signals with flashing red, Midblock signals, Intersection pedestrian signals, Pelican, Puffins, Toucans, and HAWKs. Pelican Crossings and Midblock Signals with Flashing Red The city of Los Angeles, California, uses midblock signals with a flashing red indication that is displayed to drivers during the pedestrian clearance interval so that they can proceed if there are no pedestrians in front of them. This type of midblock signal is similar to the Pelican crossing used in the U.K. and Australia, except that the Pelican displays a flashing amber indication to the driver.
62
Appendix D: Pedestrian Crossing Treatments Midblock Signals Midblock pedestrian signals have been in limited use for many years and are most often found in downtown areas of large cities where volumes are sufficiently high to meet the MUTCD pedestrian warrant. Depending on their location, they can have a disruptive effect on platoons of traffic traveling in coordinated signal systems. The city of Tucson, Arizona, developed a split midblock crossing incorporating a staggered pedestrian refuge island that requires pedestrians to cross the street using two separately operated pedestrian signals. Each signal is then coordinated with the nearest upstream signal to minimize disruption of platoons of traffic traveling in a coordinated signal system. This type of operation may have the potential for wider application, especially on larger multilane streets with center raised medians. Intersection Pedestrian Signals (Also Called Half-Signals) Intersection pedestrian signals are installed at intersections to control traffic for crosswalks across major streets and are extensively used in some provinces in Canada as well as the states of Oregon and Washington. The side street is controlled by STOP signs with no signal indications provided for the minor street approach traffic. These are sometimes referred to as half-signals. Recent concerns have been expressed by engineers in Canada as to the relative safety of these signals. These concerns should be investigated if these types of signals are recommended for wider use at non-midblock locations. Puffins and Toucans The Pelican crossing has been superseded in the U.K. by the Puffin crossing, which uses microwave detectors to change the pedestrian crossing timing based on the presence of pedestrians in the crossing. The Puffin could be adapted for use in the United States for use at midblock locations with high pedestrian volumes such as heavily used transit stops. A variation on the Puffin is the Toucan, which has separate indications and signal timing for pedestrians and bicyclists. This type of crossing is already in use in Tucson, Arizona, and could also be adapted for use in other parts of the United States. HAWKS The HAWK crossing display shows dark signal indications to drivers until it is activated by a pedestrian pushing a button. The signal then displays a yellow indication and then a solid red. During the pedestrian clearance interval, the driver sees a wig-wag pattern until the pedestrian clearance interval has ended, when the vehicle indication returns to dark mode. This treatment is extensively used in Tucson, Arizona, but there is ongoing concern with this type of treatment because the vehicle code in most states indicates that drivers should stop at dark signals and treat them as stop signs. The vehicle code would have to be modified to permit signals operating in dark mode at midblock locations without requiring drivers to stop.
63
TCRP/NCHRP: Improving Pedestrian Safety at Unsignalized Crossings CONCLUSIONS Based on the information reviewed and obtained from many different sources during the preparation of this Appendix, the following conclusions were drawn concerning pedestrian safety at unsignalized roadway crossings: Since the publication of the ITE Informational Report (44), a number of agencies have implemented alternative treatments for midblock unsignalized pedestrian crossings. These recently implemented treatments could be studied to determine their effectiveness. Midblock signalized crossings with operational characteristics that minimize delay to vehicular traffic have been implemented successfully in North America, Europe, and Australia. Warrants could be developed to permit the use of these types of crossings at midblock locations where there is pedestrian demand generated by transit facilities. Treatments used at midblock unsignalized locations in Europe could be tested in locations in the United States to determine if they are effective.
64
Appendix E: Summary of Pedestrian Crossing Treatments Evaluations
APPENDIX E
SUMMMARY OF PEDESTRIAN CROSSING TREATMENT EVALUATIONS This Appendix summarizes the major evaluation findings for various pedestrian crossing treatments at uncontrolled locations. The findings are summarized in Table E-1, which gathers information from the full literature review contained in Appendix D. TABLE E-1. Summary of Pedestrian Crossing Treatment Evaluations. Crossing Treatment(s) and Study Site Location
Reported Effectiveness
Experimental Design [Reference or Study]
Traffic Signal and Red Beacons After installation of half-signals, Retrospective beforevehicular crashes remained and-after vehicle and constant (19 before, 19 after), pedestrian crash whereas vehicle-pedestrian analysis (equal time crashes declined from 4 to 0. periods ranging from 7 to 30 months) [Fairfax 1974 (80), as reported in Fairfax 1999 (81)] Matched experimental Flashing yellow signal The study compared this and control sites with with flashing red treatment to full signalization beacon on minor street using numerous MOEs such as time series evaluation vehicle and pedestrian behavior, (1 location each in [Petzold and Nawrocki Memphis, Tennessee, vehicle and pedestrian (82)] and Sioux City, Iowa) compliance, and driver understanding. The authors concluded that this treatment “is equivalent to full signalization, except that full signalization may generate through traffic on minor street approach.” Matched experimental Flashing green signal The study compared this treatment to full signalization and control sites with with STOP sign on minor street using numerous MOEs such as time series evaluation. (1 location each in vehicle and pedestrian behavior, For this experiment Lincoln, Nebraska, and vehicle and pedestrian only, the existing steady Seattle, Washington) compliance, and driver green signals were understanding. The authors changed to flashing concluded that this treatment green signals. “…is more desirable to full signalization.” [Petzold and Nawrocki (82)] Signal that rests in steady green, goes to red ball when activated with STOP sign on minor street (halfsignal) (18 locations in Seattle, Washington)
65
Discussion
Study indicates overall 17 percent reduction in total crashes (vehicle-vehicle and vehicle-pedestrian). Author concludes that pedestrian safety has been significantly improved.
Four treatments were tested for their effectiveness at schoolpedestrian crossings. This design was not considered the most desirable crossing treatment tested.
Four treatments were tested for their effectiveness at schoolpedestrian crossings. This design was not considered the most desirable crossing treatment tested. The Lincoln and Seattle signals had been in operation for 11 and 5 years, respectively.
TCRP/NCHRP: Improving Pedestrian Safety at Unsignalized Crossings
TABLE E-1. Summary of Pedestrian Crossing Treatment Evaluations (continued). Crossing Treatment(s) and Study Site Location Steady green signal with STOP sign on minor street (1 location each in Lincoln, Nebraska, and Seattle, Washington)
Reported Effectiveness
Experimental Design [Reference or Study]
The study compared this treatment to full signalization using numerous MOEs such as vehicle and pedestrian behavior, vehicle and pedestrian compliance, and driver understanding. The authors concluded that this treatment “…is more desirable to full signalization.” Steady green signal After installation of half-signals, with STOP sign on the vehicle-pedestrian crash rate minor street (half(per million vehicles entering signal) intersection) dropped 65 percent (22 locations in Seattle, (49 before, 18 after) and the Washington) vehicle-vehicle crash rate declined by 10 percent (470 before, 425 after).
Matched experimental and control sites with time series evaluation
Discussion
Four treatments were tested for their effectiveness at schoolpedestrian crossings. Along with crossing guards, this [Petzold and Nawrocki design was considered the most (82)] desirable school-pedestrian crossing treatment tested. The Lincoln and Seattle signals had been in operation for 11 and 5 years, respectively. Retrospective before- Rear-end vehicle crashes were and-after vehicle and significantly reduced after pedestrian crash installation of half-signals. The analysis (average of author suggested that the half14.5 years of crash signals “corrected the situation data) where a driver stopped abruptly for a crossing pedestrian…” [Hendrickson (83), as reported in Fairfax 1999 (81)] Retrospective “after” Author suggests that 25-year Crash history of 25 years of Steady green signal half-signal operation yields the vehicle and pedestrian crash history demonstrates that with STOP sign on crash analysis (25 years half-signal “…highly effective following: minor street (halfin providing pedestrian and (a) Major street vehicle-minor of “after” crash data) signal) vehicular safety.” (18 locations in Seattle, street vehicle, 0.33 crashes per [Fairfax 1999 (81)] Washington, same as year per location; (b) Major those evaluated in street vehicle-pedestrian in signalized crosswalk, 0.02 Fairfax 1974) crashes per year per location; (c) Major street vehiclepedestrian in closed crosswalk, 0.009 crashes per year per location; (d) Minor street vehicle-pedestrian in signalized crosswalk, 0.009 crashes per year per location; (e) Minor street vehicle-pedestrian in closed crosswalk, 0 crashes per year per location. Half-signal, advance After installation of the halfBefore-and-after Multiple crossing treatments stop lines, and motorist signal and other treatments, motorist compliance were used at this location. The prompting signs motorists yielding to pedestrians and vehicle-pedestrian improvements in the MOEs (1 location in St. increased from 3 to 100 percent. conflicts study were the most dramatic found in Petersburg, Florida) Vehicle-pedestrian conflicts the study. decreased from 4 to 0 percent. [CUTR 2000 (14)]
66
Appendix E: Summary of Pedestrian Crossing Treatments Evaluations TABLE E-1. Summary of Pedestrian Crossing Treatment Evaluations (continued). Crossing Treatment(s) and Study Site Location HAWK signal or modified half-signal (1 location in Tucson, Arizona)
Flashing green signal with STOP sign on minor street (halfsignal) (12 locations in Greater Vancouver area, British Columbia [Canada]) Pedestrian countdown signal (4 treatment and 2 control intersections in San Jose, California)
Reported Effectiveness
Experimental Design [Reference or Study]
Discussion
After HAWK signal installation, drivers yielding to pedestrians increased from 31 to 93 percent. Pedestrians who ran, hesitated, or aborted their crossing decreased from 24 to 10 percent.
Before-and-after motorist compliance and pedestrian behavior study
Since its introduction, the appearance of the HAWK signal has evolved from a traditional traffic signal to that of an emergency vehicle beacon.
STOP sign compliance rate on side streets ranged from 36 to 100 percent, with 10 of the 12 locations having compliance rates less than 90 percent.
The proportions of pedestrians exiting on DON’T WALK decreased from 4.4 to 2.2 percent (depending upon the location). This was assumed to be due to pedestrians using the information on the timer to adjust their speed so that they finished their crossing before the DON’T WALK phase began. Pedestrian countdown The countdown signals had the signal (2 treatment and positive effect of reducing the 3 control intersections number of pedestrians who in Lake Buena Vista, started running when the Florida) flashing DON’T WALK signal appeared. They had the undesired effect of increasing the number of pedestrians entering on the flashing DON’T WALK phase. Pedestrian countdown Pedestrians felt the new signal (minor leg of 1 pedestrian signals are clearer intersection, Hampton, than conventional displays (88 Virginia) percent) and are an improvement (82 percent). Pedestrian countdown Pedestrians who completed the indication (5 sites crossing before the DON’T within St. Paul and WALK phase increased from 67 Minneapolis, to 75 percent. About 78 percent Minnesota) found the new pedestrian indications easier to understand than the former indications.
67
[Glock, Nassi, Hunt, and Fairfax 2000 (4); Nassi 2001 (3)] Traffic control device compliance [Voss and Parks 2001 (2)] Matched experimental and control sites with time series evaluation, review of crash data [Botha et al. (13) May 2002]
Matched experimental and control sites with time series evaluation [Huang and Zegeer, 2000 (12)]
Design and operational inconsistency among half-signal installations may be contributing to poor STOP sign compliance. Only had 7 months of after crash data (which found that none of the crashes could be attributed to the countdown signal). Suggested educating the public about the meaning of the countdown displays and consideration of also providing a countdown in green for the WALK interval. Study recommended that the countdown signals be tested at other locations and that their use should be accompanied by public educational campaigns.
Survey [Allsbrook (9) 1999]
Requested that the device remains and to install additional countdown devices on major leg of intersection.
Observational data (percent stepping off of curb) and intercept interviews
Based on the positive findings and public input, the Minnesota DOT is moving forward with identifying criteria.
[Farraher (11) 2000]
TCRP/NCHRP: Improving Pedestrian Safety at Unsignalized Crossings TABLE E-1. Summary of Pedestrian Crossing Treatment Evaluations (continued). Crossing Treatment(s) and Study Site Location Flashing red beacon with STOP sign on minor street (1 location each in Atlanta, Georgia, and Buffalo, New York)
Overhead and advance flashing amber beacons (4 locations in Phoenix, Arizona)
Advance overhead flashing amber beacons, pole-mounted flashing beacons at crosswalk, pedestrian activation (1 location in Chattanooga, Tennessee)
Overhead flashing regulatory sign (with message “STOP FOR PEDESTRIAN IN CROSSWALK”), pedestrian activation (3 locations in Tucson, Arizona) Overhead flashing amber beacons, directional scanning eyes, advance stop lines, motorist prompting signs (1 location in St. Petersburg, Florida)
Reported Effectiveness
Experimental Design [Reference or Study]
The study compared this Matched experimental treatment to full signalization and control sites with using numerous MOEs such as time series evaluation vehicle and pedestrian behavior, vehicle and pedestrian [Petzold and Nawrocki compliance, and driver 1977 (82)] understanding. The authors concluded that full signalization “… is more desirable than the sign and STOP sign design.” Flashing Beacons Before-and-after speed The flashing beacons did not decrease speeds or crashes, and and crash data analysis, in some cases traffic speeds or matched experimental and control sites with crashes increased after speed data analysis installation. The authors concluded “that flashers offer [Sparks and Cynecki no benefit for intermittent pedestrian crossings in an urban 1990 (17)] environment. In addition, the longer the flashers operate the more it becomes part of the scenery and loses any effectiveness.” Before-and-after The original 1987 data collection showed that motorist motorist compliance study (also includes an yielding improved from 11 to “after” period 12 years 52 percent in the eastbound direction and 6 to 32 percent in after installation) the westbound direction. [Van Winkle and Neal Motorist yielding has been 2000 (16)] sustained as of 2000, when it was measured to be 55 percent in the eastbound direction and 45 percent in the westbound direction. Motorist yielding declined from Before-and-after 63 to 52 percent. Pedestrians motorist compliance who ran, hesitated, or aborted and pedestrian behavior their crossing decreased from 17 study to 10 percent. [Huang, Zegeer, and Nassi 2000 (26)] After installation of the flashing Before-and-after beacons and other treatments, motorist compliance motorists yielding to pedestrians and vehicle-pedestrian increased from 3 to 30 percent. conflicts study Vehicle-pedestrian conflicts decreased from 2 to 0.5 percent. [CUTR 2000 (14)]
68
Discussion Four treatments were tested for their effectiveness at schoolpedestrian crossings. This design was considered the least desirable crossing treatment tested.
The authors do concede that actuated warning flashers may be beneficial in a high-speed rural environment with unusual geometrics, high pedestrian crossings, and unfamiliar drivers. However, these conditions were not tested in their study.
The authors attribute the success of the flashers to the pedestrian activation.
The authors indicated that the Tucson results may have been affected by the installation on high-volume arterial streets with speeds limits of 30 mph (48 km/h), 35 mph (56 km/h), and 40 mph (64 km/h). Multiple crossing treatments were used at this location. The improvements in the MOEs were the second most dramatic found in the study (half-signals had most improvement).
Appendix E: Summary of Pedestrian Crossing Treatments Evaluations TABLE E-1. Summary of Pedestrian Crossing Treatment Evaluations (continued). Crossing Treatment(s) and Study Site Location Overhead flashing amber beacons, passive pedestrian detection and actuation, advance and crosswalk signing and marking (25 locations in Los Angeles, California)
In-roadway warning lights, pedestrian crossing signs with integral flashing lights (7 locations in California: Fort Bragg, 1; Lafayette, 2; Orinda, 1; Petaluma, 1; Santa Rosa, 1; and Willits, 1)
In-roadway warning lights, median refuge island (2 locations in Kirkland, Washington)
Reported Effectiveness
Experimental Design [Reference or Study]
Informal studies by Los Angeles Informal experimental and control site studies DOT indicate that motorists yielding to pedestrians at sites with overhead flashing beacons [Fisher is in the 72 to 76 percent range. undated (15)] Motorist yielding at other uncontrolled but marked crosswalks are in the 20 to 30 percent range. Limited data indicate that 85th percentile speeds are reduced by 2 to 12 mph (3 to 19 km/h). In-Roadway Warning Lights Before-and-after Considering the effectiveness for all seven locations, average motorist compliance motorists yielding to pedestrians and motorist braking increased from 28 to 53 percent behavior during the daytime and [Whitlock and nighttime yielding increased Weinberger from 13 to 65 percent. The distance at which motorists first Transportation, Inc. begin braking for the crosswalk 1998 (84); also reported in Evans 1999 (85); increased from 133 to 159 ft Katz, Okitsu, and during the daytime, and from Associates 133 to 210 ft during the 2000 (86)] nighttime. Motorists yielding to Before-and-after pedestrians increased from 56 to motorist compliance 91 percent during the daytime and motorist braking and nighttime yielding behavior, measured increased from 39 to 97 percent. during daytime and The distance at which motorists nighttime conditions first begin braking for the crosswalk increased from 218 to [Whitlock and 262 ft during the daytime, and Weinberger from 190 to 264 ft during the Transportation, Inc. nighttime. 1998 (84); also reported in Godfrey and Mazzella 1999 (19); Katz, Okitsu, and Associates 2000 (86)]
69
Discussion This treatment is known locally as the “Smart Pedestrian Warning.” The flashing beacon uses an alternating flash pattern that uses three flash pulses per half-second followed by a halfsecond pause.
This appears to be the first comprehensive study of inroadway warning lights. The authors also provided installation guidelines and criteria.
Kirkland city staff considered the treatment a success, both in terms of increasing driver yielding as well as garnering public support.
TCRP/NCHRP: Improving Pedestrian Safety at Unsignalized Crossings TABLE E-1. Summary of Pedestrian Crossing Treatment Evaluations (continued). Crossing Treatment(s) and Study Site Location In-roadway warning lights, automated pedestrian detection (1 location in Orlando, Florida)
Reported Effectiveness
Experimental Design [Reference or Study]
After installation of the inroadway warning lights, motorist yielding to pedestrians increased slightly from 7 to 11 percent. Upon activation of the flashing lights, average vehicle speeds decreased from 28 to 27 mph (45 to 43 km/h), a difference that was not significant. At the flashing crosswalk, 60 percent of pedestrians experienced a pedestrianvehicle conflict. At other control locations, 87 percent of pedestrians had conflicts. In-roadway warning The authors calculated that lights crosswalks with traditional (32 locations in pavement markings have an California and average crash rate of 1 Washington State) pedestrian crash per 35 million vehicles (184 locations in Santa Ana, California). The comparative crash rate for crosswalks with in-roadway warning lights (32 locations) was 1 pedestrian crash per 214 million vehicles, a crash rate that is 80 percent lower than marked crosswalks. The two locations produced In-roadway warning markedly different results. lights, automated pedestrian detection (1 Driver yielding in Lakeland location each in improved from 18 to 30 percent Lakeland and (though not statistically Gainesville, Florida) significant). Driver yielding in Gainesville decreased from 81 to 75 percent. No significant or practical differences were observed for pedestrian behavior.
Before-and-after study of vehicle speeds and driver yielding; experimental and control for vehiclepedestrian conflicts, pedestrian behavior, and pedestrian perception [Huang, Hughes, Zegeer, and Nitzburg 1999 (55)]
Retrospective experimental and control crash analysis [Katz, Okitsu, and Associates 2000 (86)]
Discussion The location of the study site (adjacent to a 2500 seat theatre) likely had a great deal of influence on the mediocre results. The pedestrian activity is largely event-driven, and pedestrians cross the street en masse at limited times before and after performances. The site could likely benefit from other improvements, such as landscaping or curbside railing to better direct pedestrians to designated street crossings. Insufficient information was presented for this analysis to either dispute or confirm the validity of the findings. The crash analysis used vehicle volumes instead of pedestrians, which may not accurately portray exposure.
Before-and-after study The location of the study sites of driver yielding and likely influenced the study pedestrian behavior results. Many older pedestrians were present at Lakeland; thus, [Huang 2000 (87)] the low driver yielding may be due to passive crossing behavior. College-aged pedestrians at the Gainesville site were likely more aggressive and thus received a much higher driver yielding rate.
70
Appendix E: Summary of Pedestrian Crossing Treatments Evaluations TABLE E-1. Summary of Pedestrian Crossing Treatment Evaluations (continued). Crossing Treatment(s) and Study Site Location In-roadway warning lights, pedestrian crossing signs with integral flashing lights, median refuge island (1 location in Honolulu, Hawaii)
Reported Effectiveness
Experimental Design [Reference or Study]
Discussion
Before-and-after study The author considered the After installation of the inof vehicle speeds, treatment a success both in roadway warning lights and pedestrian crossing terms of quantitative MOEs as accompanying signs, drivers well as favorable motorist and that either slowed or stopped for time, and pedestrian pedestrian perception. The pedestrians increased from 30 to behavior results are notable considering 62 percent. The average speeds the facility where the treatment during flashing light activation [Prevedouros 2001 was installed. Pali Highway is a decreased 26 percent (from 40 (24)] seven-lane arterial with 30,000 to 30 mph [48 km/h]) and the average daily traffic (ADT) and 85th percentile speeds decreased 85th percentile speeds of 45 mph 15 percent (from 45 to 39 mph [72 to 63 km/h]). Average (72 km/h). pedestrian wait time at the curb decreased from 27 to 13 seconds, and the percent of pedestrians who ran during the crossing dropped from 22 to 12 percent. Before-and-after study The authors questioned whether In-roadway warning After installation of the inthe incremental benefits of inwith escalating lights, high-visibility roadway warning lights, the roadway warning lights over crosswalk marking average approach speed initially improvements, (2 separate crosswalks decreased 14 percent but then considers motorist and high-visibility crosswalk pavement marking justified the pedestrian behavior, at 1 location in increased 10 percent above pedestrian perceptions, additional expense. Several Denville, New Jersey) “before” conditions. With factors could have contributed and crosswalk installation of high-visibility to the mediocre results of the crosswalk pavement markings, conspicuity study: (a) complex intersection no vehicle-pedestrian conflicts geometry at the crossing were recorded; however, when [Boyce and Van locations, (b) automated in-roadway warning lights were Derlofske pedestrian detection that 2002 (20)] added to the high-visibility operated poorly, and (c) system crosswalk markings, the design limitations that affected conflicts increased slightly, but pedestrian understanding and to a level that is about one-sixth device visibility. of the “before” condition. Motorist Warning Signs and Pavement Markings Before-and-after study Both locations had flashing “STOP HERE FOR After installation of the signs beacons in place before the with escalating PEDESTRIAN” signs, and pavement markings, the experiment. The authors improvements, advance stop line average pedestrian-vehicle concluded that the signs were (2 locations in conflicts declined from 39 to 18 considers driver equally effective independent of yielding, pedestrianDartmouth, Nova percent. Driver yielding whether the flashing beacons Scotia [Canada]) improving from an average of vehicle conflicts, and driver braking behavior were activated by a pedestrian. 31 percent to 40 percent with Driver yielding was marginally just the sign, and 41 percent [Van Houten and better when the flashing with the sign and pavement Malenfant 1992 (28)] beacons were activated (34 markings. Driver braking percent yielding) than when the behavior also improved, with beacons were not flashing (28 significantly more motorists percent yielding). stopping greater distances from the crossing.
71
TCRP/NCHRP: Improving Pedestrian Safety at Unsignalized Crossings TABLE E-1. Summary of Pedestrian Crossing Treatment Evaluations (continued). Crossing Treatment(s) and Study Site Location Overhead flashing amber beacons, animated LED eyes, automated pedestrian detection (1 location in St. Petersburg, Florida)
Advance stop lines, motorist prompting signs, pedestrian prompting signs (4 locations in St. Petersburg, Florida)
Reported Effectiveness
Experimental Design [Reference or Study]
Discussion
The installation of the animated LED eyes increased driver yielding from 15 to 62 percent, whereas the flashing beacon only increased yielding from 15 to 36 percent. Pedestrians stranded decreased from 17 to 6 percent for the flashing beacon and 3 percent for the animated LED eyes.
Before-and-after study with alternating treatments, considers driver yielding, pedestrian-vehicle conflicts, and pedestrians stranded in the center of the roadway
The experimental design with alternating treatments could have produced some residual effects, as the animated LED eyes was tested one day and the flashing beacons could have been tested the very next day. It is not clear whether the authors addressed these residual effects in this study.
[Van Houten, Malenfant, and Hochstein 1999 (29)] Average driver yielding Before-and-after improved slightly from 2 to 3 motorist compliance percent (likely not statistically and vehicle-pedestrian significant). Pedestrian-vehicle conflicts study conflicts had similar small improvements and, on average, [CUTR 2000 (14)] declined from 3 to 0 percent.
Motorist yielding increased from 46 to 52 percent (statistically significant). Pedestrians who ran, hesitated, or aborted their crossing decreased from 58 to 43 percent. In-roadway pedestrian Average motorist yielding crossing sign (mounted improved from 70 to 81 percent. on cone) Pedestrians who ran, hesitated, (6 locations in New or aborted their crossing York State; 1 location decreased slightly from 35 to 33 in Portland, Oregon) percent. Overhead “CROSSWALK” warning sign (1 location in Seattle, Washington)
Overhead illuminated “CROSSWALK” warning sign, highvisibility crosswalk pavement markings (2 locations in Clearwater, Florida)
Multiple crossing treatments were used at these locations. Although the engineering treatments were part of a multidisciplinary approach, the authors did not isolate the effects of concurrent education or enforcement activities. Before-and-after The sign was installed on a twolane, one-way street posted for motorist compliance and pedestrian behavior 30 mph (48 km/h) speed limit. study
[Huang, Zegeer, and Nassi 2000 (26)] Before-and-after motorist compliance and pedestrian behavior study
[Huang, Zegeer, and Nassi 2000 (26)] Daytime driver yielding Matched experimental averaged 35 percent at and control sites, experimental sites and 3 percent considers driver at control sites. Nighttime yielding, pedestrian yielding was 18 percent at one behavior, and of the experimental sites and 12 pedestrian-vehicle percent at one of the control conflicts sites (difference not statistically significant). [Nitzburg and Knoblauch 2001 (25)]
72
All locations were posted for 30 mph (48 km/h) speed limit. Five of the locations were two-lane streets; one was a three-lane, and the other was a four-lane undivided street. Pedestrian looking behavior and forced right-of-way showed no significant differences between the experimental and control sites, indicating the treatments did not increase the pedestrians’ “false sense of security.”
Appendix E: Summary of Pedestrian Crossing Treatments Evaluations TABLE E-1. Summary of Pedestrian Crossing Treatment Evaluations (continued). Crossing Treatment(s) and Study Site Location Advance yield pavement markings and signs, overhead flashing amber beacons (3 locations in Halifax, Nova Scotia [Canada])
Reported Effectiveness
After installation of the signs and pavement markings, average pedestrian-vehicle conflicts declined from 15 to 3 percent. Driver yielding improved from an average of 85 percent to 92 percent. Driver yielding behavior at greater distances from the crosswalk also improved, with significantly more motorists stopping greater distances from the crossing. Advance yield Pedestrian-vehicle conflicts pavement markings and decreased from 12 to 2 percent, signs, fluorescent while motorist yielding yellow-green crossing increased from 69 to 85 percent. signs Yielding at 10 ft (3 m) before (24 locations in Nova the crossing increased from 37 Scotia, Canada) to 83 percent and yielding at 20 ft (6 m) before the crossing increased from 13 to 54 percent. The use of the yellow-green crossing signs had no significant impacts on the MOEs.
Crosswalk pavement markings (400 locations in San Diego, California)
Crosswalk pavement markings (380 locations in California)
Experimental Design [Reference or Study] Before-and-after study with multiple “after” scenarios, considers driver yielding, pedestrian-vehicle conflicts, and driver braking behavior
73
The authors did not evaluate the individual contribution of the flashing beacons to the treatment effectiveness, but seemed to indicate that the advance yield markings and signs were largely responsible for any improvements.
[Van Houten, Malenfant, and MCusker 2001 (29)] Before-and-after study with three different treatment groups plus a control group; considers driver yielding, pedestrian-vehicle conflicts, and driver braking behavior [Van Houten, McCusker, Huybers, Malenfant, and RiceSmith 2002 (88)]
Crosswalk Pavement Markings Retrospective matched Nearly six times as many experimental and crashes occurred in marked control crash analysis crosswalks as in unmarked crosswalks. After accounting for (5 years of crash data pedestrian usage, the crash ratio for marked and was reduced to about 2 to 3 unmarked crosswalks) times as many crashes in marked crosswalks as in [Herms 1970 (39); unmarked crosswalks. Herms 1972 (40)] After accounting for pedestrian exposure, Crash rates at marked crosswalks were 3.2 to 3.7 times higher than crash rates at unmarked crosswalks for the unsignalized intersections.
Discussion
Retrospective experimental and control crash analysis (5 years of crash data) [Gibby, Stites, Thurgood, and Ferrara 1994 (37)]
All streets in the study were posted at 30 mph (48 km/h), and the authors cautioned the use of these treatments on streets posted 40 mph (64 km/h) or greater. Pedestrian-activated flashing beacons were already in place at 19 of the 24 locations, and 3 additional locations had flashing beacons installed during the “after” period. The authors indicated that the flashing beacons may have contributed to the driver yielding rate. Many have criticized this study as leading to the removal of pedestrian accommodation on city streets. Many now think that crosswalk markings should not be removed in these cases, but supplemented with various other types of safety treatments that enable pedestrians to cross busy roadways.
TCRP/NCHRP: Improving Pedestrian Safety at Unsignalized Crossings TABLE E-1. Summary of Pedestrian Crossing Treatment Evaluations (continued). Crossing Treatment(s) and Study Site Location Removal of crosswalk pavement markings (104 locations in Los Angeles, California)
Reported Effectiveness
Experimental Design [Reference or Study]
Retrospective beforeConsidering crashes at both marked and unmarked legs of and-after crash analysis (before and after the intersections at which the marked crosswalk was removed, periods were matched for length and ranged the number of pedestrianvehicle crashes declined from from 36 to 111 months) 116 to 31 for equivalent time periods, a 61 percent decline. At [Jones and Tomcheck 2000 (35)] adjacent intersections where crosswalk markings were reinstalled after pavement resurfacing, the pedestrianvehicle crashes increased slightly from 27 to 30, thus indicating that the reduction in crashes at removed crosswalks was not simply being transferred to adjacent marked crosswalks. Crosswalk pavement The crosswalk markings had a Before-and-after study of vehicle speeds for markings very modest effect on vehicle different staged (6 locations in Arizona, speeds, which decreased on Maryland, and average by 0.2 to 2 mph (0.3 to pedestrian behaviors Virginia) 3.2 km/h). However, the largest [Knoblauch and speed decrease (2 mph [3.2 km/h]) was measured when no Raymond 2000 (34)] pedestrians were present, implying that motorists slowed simply because of the presence of crosswalk markings. The other statistically significant speed decrease (1.5 mph [2.4 km/h]) was measured for the condition of pedestrian not looking. Before-and-after study Crosswalk pavement Speed reductions were very of vehicle speeds for markings modest at the study locations staged pedestrian (11 locations: 3 in (on average, less than 1 mph behaviors, driver Sacramento, California; [1.6 km/h]). No significant changes were noted for driver yielding behavior, and 3 in Richmond, Virginia; 3 in Buffalo, yielding . Similarly, there were pedestrian behavior no changes in blatantly New York; and 2 in Stillwater, Minnesota) aggressive pedestrian behavior. [Knoblauch, Nitzburg, and Seifert 2001 (36)]
74
Discussion The authors performed statistical significance testing and found the crash reductions at the removed crosswalks to be significant.
The study results are counterintuitive, in that the largest speed reduction was obtained when no staged pedestrians were present. Additionally, the implications of a 2 mph (3.2 km/h) speed reduction near crosswalks are most likely negligible for pedestrian safety.
The authors suggested that very modest speed reductions indicated that motorists were aware of the marked crosswalks.
Appendix E: Summary of Pedestrian Crossing Treatments Evaluations TABLE E-1. Summary of Pedestrian Crossing Treatment Evaluations (continued). Crossing Treatment(s) and Study Site Location Crosswalk pavement markings (1000 locations in 16 states)
Crosswalk pavement markings (282 locations in California and Washington State)
Median refuge islands (10 locations in Toronto, Canada)
Reported Effectiveness Crash rates at marked crosswalks were not significantly different than unmarked crosswalks on twolane roads. On multilane roads with high traffic volumes, the pedestrian crash rate in marked crosswalks was 4 to 5 times higher than in unmarked crosswalks. Median refuge islands were associated with a lower crash rate than similar multilane divided roadways. After adjusting for the various traffic and pedestrian characteristics, the risk of a pedestrian-vehicle crash was 3.6 times greater at uncontrolled intersections with a marked crosswalk.
Experimental Design [Reference or Study] Retrospective matched experimental and control site crash analysis [Zegeer, Stewart, and Huang 2002 (31)]
The authors’ recommendations include a matrix that indicates under what conditions (i.e., geometry, speed, traffic volume) marked crosswalks ALONE are insufficient and other pedestrian crossing improvements are needed.
Retrospective matched These study results generally experimental and agree with those of Herms 1970 control site crash and Zegeer 2002. analysis
[Koepsell, McCloskey, Wolf, Moudon, Buchner, Kraus, and Patterson 2002 (33)] Design Elements The crash rate was significantly Retrospective experimental and higher for split pedestrian control site crash crossovers (i.e., refuge island analysis with signal control) than for pedestrian refuge islands with no signal control. The authors [Bacquie, Egan, and Ing 2001 (42)] found significantly more vehicle-vehicle crashes at the split crossovers, but more vehicle-island and vehiclepedestrian crashes at pedestrian refuge islands.
75
Discussion
TCRP/NCHRP: Improving Pedestrian Safety at Unsignalized Crossings
APPENDIX F PEDESTRIAN CROSSING INSTALLATION GUIDELINES This Appendix summarizes pedestrian crossing installation criteria used by entities from several countries. These criteria are used to determine where and what type of pedestrian crossings are to be installed on various types of facilities. Some entities have developed formal “warrants,” whereas others have identified guidelines. In addition, some countries list the factors that should be taken into consideration when considering installation of pedestrian crossings. UNITED STATES OF AMERICA Guidelines from Recent Publications De Robertis and Ridgway (89) summarized where marked crosswalks are generally used: At signalized intersections with pedestrian signal indications or substantial pedestrian crossings; Where marked crosswalks can concentrate or channelize multiple pedestrian crossings to a single location; Where there is a need to delineate the optimal crossing location when it is unclear because of unusual geometric layout, sight distance, or traffic operations; At approved school crossings or for crossings on suggested safe routes to school; and At other locations with significant pedestrian crossings and potential for pedestrianvehicle conflicts. Marked crosswalks potentially suffer from the following drawbacks if minimal treatments are used to mark and sign the crosswalk: May make pedestrians feel overconfident, May cause a greater number of rear-end collisions, May cause an increase in the number of fatal or serious-injury collisions, or May result in costly maintenance. Installation of midblock crosswalks is considered when: Protected intersection crossings are more than 590 ft (180 m) apart, 328 ft (100 m) in high-pedestrian volume locations, Adequate sight distance is available, and The combination of traffic and pedestrian volumes justify the installation. Figure F-1 was developed as a guide to be used for installing crosswalks at uncontrolled and midblock crossing and is included in the ITE Recommended Practice on Design and Safety of Pedestrian Facilities (90).
76
Appendix F: Pedestrian Crossing Installation Guidelines
1 mi = 1.61 km Figure F-1. Guidelines for Installing Crosswalks at Uncontrolled and Midblock Crossings (90). MUTCD Discussions The MUTCD (1) provides warrants for installing traffic control signals based on the volume of pedestrians. The pedestrian volume signal warrant is intended for application where the traffic volume on a major street is so heavy that pedestrians experience excessive delay in crossing the major street. Although the MUTCD 2001 Edition (91) addresses the installation of accessible pedestrian signals (APS) for people with visual impairments, it should be noted that unsignalized crossing locations are difficult or impossible for pedestrians who are blind or visually impaired to utilize safely, especially in areas where there are significant through movements. Current methods of gap determination do not consider the needs of pedestrians who use hearing, rather than vision, to determine gaps in traffic. Preliminary research yet to be published indicates that auditory gap detection may require gaps in traffic that are 3 or more seconds longer than visual gap detection. Uncontrolled 77
TCRP/NCHRP: Improving Pedestrian Safety at Unsignalized Crossings crossings having gaps sufficient to allow sighted pedestrians time to cross may not permit blind pedestrians to do so. This is especially the case if other sounds mask the noise of vehicles stopping for pedestrians in the crosswalk, making it impossible for blind pedestrians to ascertain if all vehicles have stopped to permit a safe crossing. This is particularly so for crosswalks across multilane facilities. Federal Highway Administration Study (31) The objective of an FHWA study, conducted by the University of North Carolina, was to compare pedestrian collision occurrence at marked versus unmarked crosswalks at uncontrolled intersections throughout the United States. Data studied were summarized to provide the following information: Study Sites 1000 marked and 1000 unmarked crossings were selected from 30 cities across the country. School crossings were excluded. Midblock locations were excluded. Data Collection Data included collision history (5 years), pedestrian volume estimates, traffic volumes, number of lanes, speed limit, median and crosswalk types for each location. Pedestrian-related collision data included 229 pedestrian collisions in the sample. Key findings are listed below. Guidelines were developed based on these findings and are shown in Table F-1. Two-lane roads: no significant difference between marked and unmarked crosswalks. Multilane roads with ADT below 12,000: no significant difference between marked and unmarked crosswalks. Multilane roads with ADT above 12,000 and no raised median: marked crosswalks had significantly higher pedestrian collision rates than unmarked crosswalks. Multilane roads with ADT above 15,000 and with raised median: marked crosswalks had significantly higher pedestrian collision rates than unmarked crosswalks. Regional effects: higher pedestrian collision rates were found in western U.S. cities compared to eastern U.S. cities. Variables having no effect: area type, speed limit, one-way versus two-way, crosswalk condition, and marking pattern had no effect on the occurrence of pedestrian collisions. Pedestrian volumes were not measured. Multiple-threat collisions: 17.6 percent of the collisions in marked crosswalks were multiple-threat collisions (i.e., one vehicle stops for the pedestrian but the driver in the adjacent lane does not see the pedestrian). None occurred in unmarked crosswalks. Collision severity: six fatalities occurred in marked crosswalks and zero in unmarked crosswalks (out of 229 total collisions in the sample).
78
Appendix F: Pedestrian Crossing Installation Guidelines TABLE F-1. Guidelines for Marked Crosswalk Installation (for Uncontrolled Intersections) (31). ≤9,000 ADT
>9,000 to >12,000 to > 15,000 ADT ≤12,000 ADT ≤15,000 ADT 35 35 35 35 ≥40 ≥40 ≥40 ≥40 ≤30 ≤30 ≤30 ≤30 mph mphb mph mph mphb mph mph mphb mph mph mphb mph (56 (56 (56 (56 (48 (64 (48 (64 (48 (64 (48 (64 km/h) km/h) km/h) km/h) km/h) km/h) km/h) km/h) km/h) km/h) km/h) km/h) 2 Lanes
3 Lanes
++4 Lanes, raised medianc ++4++ Lanes, no median Key Candidate sites for marked crosswalks alone.
Probable candidate sites for marked crosswalks. The use of other pedestrian facility enhancements should be evaluated. These locations should be closely monitored and may be considered for enhancements as feasible. Marked crosswalks alone are insufficient. The use of other pedestrian facility enhancements is recommended. These locations should be considered for marking only after the appropriate enhancements are determined. a. These guidelines include intersection and midblock locations without traffic signals, beacons, or STOP or YIELD signs on the approach to the crossing. They do not apply to school crossings. These are general recommendations; good engineering judgment should be used in individual cases for deciding when to install a marked crosswalk. It is recommended that a minimum of 20 pedestrian crossings per vehicular peak hour (or 15 or more pedestrians in special population groups, e.g., elderly and/or child pedestrians) exist at a location before considering the installation of a marked crosswalk. b. Where the posted speed limit exceeds 40 mph (64 km/h), marked crosswalks should not be used at locations not controlled by a signal, beacon, STOP or YIELD sign, and/or other enhancements. c. The raised median or refuge island must be approximately 5 ft (1.2 m) wide and 6 ft (1.8 m) long in the direction of pedestrian travel to adequately serve as a refuge area for pedestrians.
79
TCRP/NCHRP: Improving Pedestrian Safety at Unsignalized Crossings Local Agencies The city of San Luis Obispo, California, has adopted a formal policy on where marked pedestrian crossings are to be provided. The completed policy is provided in Table F-2. The inpavement flashing markers installation criteria could be adapted for the development of national guidelines. TABLE F-2. Guidelines for the Installation of Marked Crosswalks Used in San Luis Obispo, California. To establish formal procedures where pedestrian crosswalks, pedestrian traffic control warning devices, and other miscellaneous pedestrian control devices other than traffic signals are installed, a number of agencies, such as San Luis Obispo, California, U.S.A., have developed the following guidelines: a.
General
A crosswalk is a unique traffic control device. It can be marked or unmarked. Crosswalk markings should not be used indiscriminately because it has been shown that pedestrians may develop a false sense of security regarding their use of a marked location. However, a marked crosswalk should be installed where an engineering study is performed that determines if marked crosswalks are appropriate at locations that are not controlled by traffic signals, flashing beacons or stop signs. b. Installation of Marked Crosswalks on Uncontrolled Approaches of Intersections Based on industry standards in both the ‘Manual of Uniform Traffic Control Devices’ and criteria that have been successful in other similar jurisdictions, the following guidelines should be used to determine appropriateness of marked crosswalks on public streets. Marked crosswalks may be considered for installation at uncontrolled locations if the following requirements are met: • • • • •
The pedestrian volume is 40 or more per hour during the peak hour of pedestrian usage, or There are 30 groupings of two or more pedestrians for a continuous 2-hour period twice a day, and The 85th percentile approach speed is below 40 mph (64 km/h), and The roadway has less than three travel lanes in one direction, and The proposed crosswalk has adequate lighting for nighttime visibility (if the location satisfies all other criteria the City shall install street lighting as part of the crosswalk installation), and • There is an unrestricted visibility of the crosswalk for a minimum distance as listed below. • If residential, the roadway conducts 2,700 ADT or more, and • There is no controlled crosswalk (by a traffic signal or stop sign) within one block (660 ft [201 m]) of the proposed crosswalk.
Design Speed, mph (km/h) 20 (32) 25 (40) 30 (48) 35 (56) 40 (64)
Minimum Sight Distance for the Placement of Crosswalks. Minimum Sight Design Speed, Distance, ft (m) mph (km/h) 125 (38) 45 (72) 150 (46) 50 (81) 200 (61) 55 (89) 250 (76) 60 (97) 300 (92) 65 (105)
80
Minimum Sight Distance, ft (m) 360 (110) 430 (131) 500 (153) 580 (177) 660 (201)
Appendix F: Pedestrian Crossing Installation Guidelines
TABLE F-2. Guidelines for the Installation of Marked Crosswalks Used in San Luis Obispo, California (continued). Installation of a marked crosswalk(s) may be authorized that does not satisfy all of the criteria in Section B if it is deemed that, based on analysis, other unique circumstances warrant the installation of the marked crosswalk. The circumstances include but are not limited to: school pedestrian crosswalks on an approved ‘Safe Route to School Map,’ channelization of pedestrians to a single point of crossing, or otherwise clarify the appropriate place for a safer crossing. All marked crosswalks installed at uncontrolled locations should be ‘high-visibility’ ladder type crosswalks. c.
Installation of Marked Crosswalks Between Intersections (Midblock)
A midblock marked crosswalk may be installed if it meets the requirements of Section B, and all of the following: • The length of the block between intersections is greater than 660ft; and • There is reasonable demand by pedestrians, as demonstrated by an engineering survey, to cross within a concentrated area that is 200 ft (61 m)or greater from the nearest signal or stop sign controlled intersection; and • There is a high pedestrian volume generator nearby. Installation of a marked crosswalk(s) may be authorized that does not satisfy all of the criteria in this section if it is deemed that, based on analysis, other unique circumstances warrant the installation of the marked crosswalk. (see Section b for examples) d. Reinstallation of Marked Crosswalks Covered by Roadway Surfacing The reinstallation of marked crosswalks should be evaluated as part of all roadway surface treatment projects that cover up pavement markings (slurry seal, chip seal, and overlay). All marked crosswalks that do not meet the criteria should be considered for removal to alternative treatments described in this report. e.
Marked Crosswalk Removal
Subject to the completion of an engineering study, existing crosswalk markings may be removed if one or more of the requirements of Section b or c are not met. f.
High-Visibility Crosswalks
High-visibility ladder type crosswalks should be marked at uncontrolled marked crosswalks or where it is determined that their use will benefit marked crosswalk effectiveness at crosswalks controlled by traffic signals or stop signs. g.
Marked Crosswalks at Traffic Signal Locations
Marked crosswalks should be installed at all designated crosswalks at intersections controlled by traffic signals. These crosswalk markings should be 12 inches (35 cm) white or yellow markings and spaced a minimum of 10 inches (25 cm) apart. Crosswalks shall not be marked at locations where pedestrian crossings are prohibited for safety or operational reasons. In these instances, appropriate signage prohibiting the crossing and instructing pedestrians to the appropriate crossing locations should be erected. h. School Crosswalks School crosswalks are to be established at appropriate crossing locations on the approved ‘Suggested Route to School’ map. Warrants and locations of the school crosswalks shall be based on recommended guidelines as contained in the Manual of Uniform Traffic Control Devices (MUTCD).
81
TCRP/NCHRP: Improving Pedestrian Safety at Unsignalized Crossings TABLE F-2. Guidelines for the Installation of Marked Crosswalks Used in San Luis Obispo, California (continued). i.
Traffic Control Devices for Crosswalks
Traffic control devices for crosswalks should be installed per the MUTCD. Where discrepancies exist for the proper installation of advanced traffic control devices, appropriate signing and warning combinations, on a caseby-case basis should handle these. j.
In-Road Pavement Lighting for Crosswalks
In-road crosswalk lighting incorporates the use of lights that are imbedded in the pavement, similar to lights used in the runways of airports. Their use has been proven effective in certain locations particularly for multilane majors that have limited visibility of pedestrians. However, their use should be limited to only those where inground pavement lighting will promote visibility of pedestrians more effectively than other warning devices that have proven ineffective in advising motorists of crosswalk occupation. In-road pavement lighting may be considered at uncontrolled locations if the following requirements are met: 1. The pedestrian volume is 100 or more per hour for a period of any four hours of the day, or there are 100 groupings of two or more pedestrians for a continuous 2-hour period twice a day, and 2. The pedestrian volume after dark is 75 or more for any one hour, or 25 or more for a period of any four hours during the night-time, and 3. The roadway conducts 10,000 ADT or more, and 4. The 85th percentile approach speed is 35 mph (56 km/h) or less, and 5. The roadway has two or more vehicular travel lanes in one direction but not more than four through lanes in both directions, and 6. The crosswalk is not controlled by a traffic signal, stop or yield sign. Specifications for the installation of in-road pavement lighting shall be in accordance with established industry standards. The specifications should consider the following: automatic Activation (passive detection), adjustable light orientation and levels of illumination, accompaniment of appropriate advance warning signage that could include the use of ‘smart’ signs alerting motorists of pedestrian activity, and ability to be easily maintained.
The city of Sacramento, California, has developed a set of Pedestrian Safety Guidelines (92) which includes charts summarizing the type of crossing treatments appropriate on different streets. The charts are provided in Tables F-3 through F-6.
82
Appendix F: Pedestrian Crossing Installation Guidelines TABLE F-3. Guidelines for the Installation of Pedestrian Crossing Treatments for Sacramento, California – Two-Lane Streets. Number of Cars (average daily traffic) Up to 15,000 cars per day
30 mph (48 km/h) or less Triple-four
15,000 cars or more per day
Posted Speed 35 mph (56 km/h) Triple-four
Triple-four plus a pedestrian refuge, overhead flashing beacons, or other Level 1 and 2 devices
40 mph (64 km/h) or more Triple-four plus a pedestrian refuge, overhead flashing beacons, or other Level 1 and 2 devices Pedestrian signal or bridge
TABLE F-4. Guidelines for the Installation of Pedestrian Crossing Treatments for Sacramento, California – Three-Lane Streets. Number of Cars (average daily traffic) 9,000 cars or fewer per day
30 mph (48 km/h) or less Triple-four
15,000 cars or more per day
Triple-four
40 mph (64 km/h) or more Triple-four plus a pedestrian refuge, overhead flashing beacons, or other Level 1 and 2 devices
Triple-four plus a pedestrian refuge, overhead flashing beacons, or other Level 1 Pedestrian signal or and 2 devices bridge
9,000-12,000 cars per day 12,000-15,000 cars per day
Posted Speed 35 mph (56 km/h)
Triple-four plus a pedestrian refuge, overhead flashing beacons, or other Level 1 Pedestrian signal or and 2 devices bridge
83
TCRP/NCHRP: Improving Pedestrian Safety at Unsignalized Crossings TABLE F-5. Guidelines for the Installation of Pedestrian Crossing Treatments for Sacramento, California – Four or More Lanes with a Raised Median. Number of Cars (average daily traffic) 9,000 cars or fewer per day
30 mph (48 km/h) or less Triple-four
9,000-12,000 cars per day 12,000-15,000 cars per day
15,000 cars or more per day
Posted Speed 35 mph (56 km/h) Triple-four
Triple-four plus a pedestrian refuge, overhead flashing beacons, or other Level 1 and 2 devices
40 mph (64 km/h) or more Triple-four plus a pedestrian refuge, overhead flashing beacons, or other Level 1 and 2 devices Pedestrian signal or bridge
Triple-four plus a pedestrian refuge, overhead flashing beacons, or other Level 1 and 2 devices Pedestrian signal or Pedestrian signal or bridge bridge
TABLE F-6. Guidelines for the Installation of Pedestrian Crossing Treatments for Sacramento, California – Four or More Lanes without a Raised Median. Number of Cars (average daily traffic) 9,000 cars or fewer per day 9,000-12,000 cars per day 12,000-15,000 cars per day
15,000 cars or more per day
30 mph (48 km/h) or less Triple-four
Posted Speed 35 mph (56 km/h)
40 mph (64 km/h) or more Triple-four plus a Triple-four plus a pedestrian refuge or other pedestrian refuge, overhead flashing Level 1 device beacons, or other Level 1 Triple-four plus a Triple-four plus a and 2 devices pedestrian refuge or other pedestrian refuge, overhead flashing Level 1 device beacons, or other Level 1 Pedestrian signal or Triple-four plus a and 2 devices bridge pedestrian refuge, overhead flashing beacons, or other Level 1 and 2 devices Pedestrian signal or Pedestrian signal or bridge bridge
84
Appendix F: Pedestrian Crossing Installation Guidelines CANADA Transportation Association of Canada The Transportation Association of Canada has published a Pedestrian Crossing Control Manual (93) that includes a flow chart for selecting pedestrian treatments (see Figure F-2). The manual lays out warrants for various types of pedestrian crossing control, which are summarized below.
REQUEST RECEIVED
SITE CONDITIONS SATISFIED?
YES
- No. OF LANES - SSD - PROXIMITY TO
COLLECT PEDESTRIAN AND TRAFFIC COUNT DATA
ALTERNATE CROSSING
APPLY PEDESTRIAN ABILITY ADJUSTMENTS
MEET MINIMUM PEDESTRIAN VOLUME FOR POPULATION LEVEL?
- GRADIENT NO
YES
CROSSING OPPORTUNITY CURVES
NO MEET MINIMUM PEDESTRIAN VOLUME?
POST-MOUNTED SIGNS AND MARKINGS
NO REQUEST DENIED
OVERHEAD SIGNS AND MARKINGS
YES
SPECIAL CROSSWALK
SPECIAL STUDY
PEDESTRIAN SIGNAL
Figure F-2. Warrant Model Flow Chart (adapted from 93). Determine Pedestrian Volumes Pedestrian volumes are converted into equivalent adult units (EAUs) where children, seniors, and disabled are given preferential treatment to account for their higher vulnerability (see Table F-7). TABLE F-7. Equivalent Adult Units (93). Number
Factor
Children __________ Seniors __________ Disabled __________ Adults __________
x 2.0 x 1.5 x 2.0 x 1.0
Total EAUs in the 1-hour assessment period =
85
EAUs = = = =
TCRP/NCHRP: Improving Pedestrian Safety at Unsignalized Crossings Calculate Crossing Opportunities. Consider the following points in calculating crossing opportunities (COs): 1. If available, the actual number of COs counted in the 1-hour assessment period should be used. 2. If gap data are not available, estimate COs using traffic counts as follows: a. Determine traffic volume in the 1-hour assessment period. b. Determine traffic arrival pattern. This pattern is a function of the coordination of the traffic signals on either side of the study location. Below are three patterns that can be determined through the use of a time-space diagram: Pattern A: Choose curve A if there are no signals within 0.6 mi (1 km) of the study location. Pattern B: Choose curve B if signals are uncoordinated, or if the total time occupied by the green bands at the crossing location is more than 50 percent of the cycle length. Pattern C: Choose curve C if the total time occupied by the green bands at the crossing location is less than 50 percent of the cycle length. c. Refer to Figures F-3 to F-6. Adjustment Factor – Community Size. The concentration of pedestrians at a particular crossing is a function of the adjacent land uses and, hence, community sizes. In large urban centers, a high concentration of pedestrians is frequently found, while, in comparison, concentrations of pedestrians in villages and towns could be considerably lower. To reflect this situation, the pedestrian volume base threshold level is decreased for smaller communities so that a traffic control device is recommended sooner than would otherwise be considered. The adjustment of the EAU threshold must be based on the metropolitan population rather than the municipality population (see Table F-8). TABLE F-8. Community Size Adjustment Factor (93). Community Size Threshold < 10,000 10,000-250,000 > 250,000
Adjustment to EAU -10.0 -5.0 0.0
86
Appendix F: Pedestrian Crossing Installation Guidelines
1 ft = 0.305 m Figure F-3. Estimated Crossing Opportunities for a Two-Lane Cross Section (93).
1 ft = 0.305 m Figure F-4. Estimated Crossing Opportunities for a Four-Lane Cross Section (93).
87
TCRP/NCHRP: Improving Pedestrian Safety at Unsignalized Crossings
1 ft = 0.305 m Figure F-5. Estimated Crossing Opportunities for a Six-Lane Cross Section (93).
1 ft = 0.305 m Figure F-6. Estimated Crossing Opportunities for a Three-Lane One-way Cross Section (93).
88
Appendix F: Pedestrian Crossing Installation Guidelines Select Warranted Device. Select the appropriate traffic control device from the warrant chart using COs and EAUs in Figure F-7.
Figure F-7. Pedestrian Crossing Control Warrant Chart (93). Accident History. While pedestrian accidents are not included as a direct component of the warrant model, the analyst should include a review of the accident history as part of the study of pedestrian crossing needs at the study location. Province of Ontario The Ontario Manual on Uniform Traffic Control Devices (94) provides a specific warrant for midblock pedestrian signals. Under free-flow conditions, the warrant requires an average of 120 pedestrian crossings per hour over the heaviest 8 hours of the day and an average of 290 vehicles per hour (veh/h) entering the crossing over the same 8 hours. Under restricted flow conditions, the warrant values are 240 pedestrians per hour (ped/h) and 575 veh/h. The vehicular volume thresholds are increased by 25 percent for streets with more than one lane per direction. UNITED KINGDOM OF GREAT BRITAIN (U.K.) Local Transport Note 1/95 (95) entitled “The Assessment of Pedestrian Crossings” identifies the process used in the United Kingdom for when the following types of pedestrian crossing treatments are used: • • •
Pedestrian refuge islands, Zebra crossings (marked uncontrolled crosswalks with high-visibility ladder-style markings), and Signal-controlled crossings—Pelican, Puffin, and Toucan. Pelicans and Puffins are pedestrian crossings used at midblock locations primarily in the U.K. and Australia. Pelicans minimize delay to the driver by displaying a flashing amber vehicular indication 89
TCRP/NCHRP: Improving Pedestrian Safety at Unsignalized Crossings during the pedestrian clearance interval, and drivers may proceed if there is no pedestrian in front of them in the crossing. Puffins use detectors to minimize delay to drivers while providing a controlled pedestrian crossing. Toucans provide separated indications for pedestrians and bicyclists. The bicycle indications are actuated when appropriate. The following checklist is used to analyze sites. Site Characteristics. Site assessment methodology takes into account the following: o Number of lanes/one way or two way, o Roadway width, o Sidewalk width, o Street lighting, o Sight distance, o Parking restrictions, o Bus stops, o Distance to nearest intersection, o Distance to nearest adjacent crossing and type of crossing, Skid Resistance of Pavement, and Surrounding Pedestrian Generating Land Uses. Crossing Traffic Information: o Flow and composition of pedestrians (elderly, strollers or prams, young children, visually impaired, bicyclists, equestrians, wheelchairs), o Time to cross road (elderly, able, or disabled), o Difficulty of crossing (elderly, able, or disabled), and o Latent crossing demand. Vehicle Traffic Information: o Vehicle count, o Cyclists, o Trucks, o Buses, and o Vehicle speeds (limit and 85th percentile). Road Collisions: o Number per year, and o Average at similar local sites. Local Transport Note 1/95 (95) provides sample assessment frameworks to show how the checklist information should be used to determine the type of treatment that is appropriate for a particular location. The U.K. methodology avoids use of warrants in its methodology, preferring to lay out a site assessment process that leads to the selection of the most appropriate crossing treatment.
90
Appendix F: Pedestrian Crossing Installation Guidelines NEW ZEALAND A pedestrian crossing is warranted if during a normal weekday, the flows taken over any 1-hour period meet the following criteria: The product of the number of pedestrians and the number of vehicles should exceed 45,000, and The number of vehicles is not less than 300. However, many authorities in New Zealand make use of AUSTROADS (Australian) standard AS 1742.10, in which the following criteria should be met: Pedestrian flows > 60 ped/h, vehicle flows > 600 veh/h, and the product of the two > 90,000. The Christchurch City Council uses an intermediate set of values in which pedestrian flows > 60 ped/h, vehicles >1,000 veh/h, and the product >60,000. AUSTRALIA Chapter 4 of the 3rd Edition of the VicRoads (State of Victoria Transportation Department in Australia) Traffic Engineering Manual (96) provides the following pedestrian crossing guidelines (this chapter should be read in conjunction with AUSTROADS Guide to Traffic Engineering Practice, 1995, Part 13 - Pedestrians): Major Traffic Control Items The following pedestrian facilities are major traffic control items (MTCI) and may only be installed, removed, or altered with written approval from VicRoads: Pedestrian crossing signs, and Traffic signals. This means that pedestrian crossings (with or without flashing lights) and pedestrian operated signals (including those for school children and other pedestrians) such as Pelican crossings and Puffin crossings are covered by the requirements of the MTCI. Minor Traffic Control Items Other pedestrian devices are not MTCIs but also give improved safety and mobility to pedestrians. Pedestrian refuges are devices that provide protection for the pedestrian in the center of the road, enabling them to cross a single direction of traffic at a time. They can be used in conjunction with other devices where road width is sufficient. Traffic islands, medians, and safety zones are all forms of pedestrian refuges. A pedestrian overpass/underpass may be appropriate where two generators of pedestrian traffic are on opposite sides of a highway. 91
TCRP/NCHRP: Improving Pedestrian Safety at Unsignalized Crossings
In addition to the more specific guidelines given in the remainder of Chapter 4 of the VicRoads Traffic Engineering Manual Volume 1, its table (shown below as Table F-9) will assist in the selection of the most appropriate pedestrian device, according to the classification of the road. Neither this table nor the more specific guidelines which follow should be taken as the sole criteria by which the need for a particular facility is assessed. Matters such as capacity, safety, and the level of service (LOS) for all road users must be considered. The following sections outline the numerical guidelines for determining whether a particular pedestrian facility is appropriate. It must be noted that these are guidelines and the numerical values are not the only factors to consider for determining the need or appropriateness of a pedestrian device. Other factors requiring consideration include speed zones, pedestrian needs/desire lines, neighboring facilities, types of pedestrians, road geometry, accident history, abutting land use, proximity of alternative pedestrian devices, and other site-specific conditions. TABLE F-9. Guidelines for the Selection of Appropriate Midblock Pedestrian Facilities According to Road Classification (96).
Primary Major Secondary Major Collector
Overpass or Underpass
Pedestrian Operated Signals
Pedestrian Crossing (with flashing lights)
Pedestrian Crossing (without flashing lights)
Flagged School Crossing
Pedestrian Refuge
†o
•
x
x
o+
o
o
•
o
x
o
o
x
o
o
o
•
•
Local • o x * + = †
o= o= o o * * Most likely to be appropriate May be an appropriate element Inappropriate element Pedestrian devices should not be needed Flagged school crossings are sometimes used on low volume primary majors especially in rural areas Pedestrian crossings (zebra crossings) may be appropriate in a local shopping centre If the primary major is a freeway, an overpass or underpass must be used
Pedestrian Crossings without Flashing Lights It is acceptable to install pedestrian crossings without twin diagonal flashing lights. However, these devices should only be used under certain circumstances, which are indicated in the guidelines shown in Table F-10.
92
Appendix F: Pedestrian Crossing Installation Guidelines
TABLE F-10. Guidelines for the Installation of Pedestrian Crossings without Flashing Lights.
•
•
• • •
•
Acceptable locations for Pedestrian Crossings without flashing lights: - Collector and local roads on which traffic speeds are low, - Left-turn slip or turn lanes at signalized intersections where VicRoads Regions consider these lanes to be necessary, - Car parks or parking lots, - Other off-road situations, e.g., caravan parks, reserves, - Where a children’s crossing is justified and a significant number of pedestrians cross at other (nonschool) times of the day, - Service roads where pedestrian operated signals or intersection signals operate on the main carriageway or highway, and - Across major roads. Unacceptable locations: - Left- turn slip or turn lanes at unsignalized intersections (unless considered necessary for pedestrian safety), and - Where there is poor visibility on the approach to the proposed site of the crossing, or where conspicuity of the device may be less than optimal. General Guidelines: - Pedestrian volumes of 20 or more per hour, - Vehicle volumes of 200 or more per hour for the same hour, and Maximum speeds of 37 mph (60 km/h) (85th percentile). Pedestrian Operated Signals. Pedestrian operated signals may be provided where the following guidelines are met (for any hour on an average weekday): - The number of pedestrians (P) crossing within 65.5 ft (20 m) of proposed site exceeds 100, and - The number of vehicles (V) which pedestrians have to cross exceeds 500 on an undivided road or 1,000 where there is a median or refuge, or - A pedestrian crossing (zebra) would normally be justified but the operation of the crossing would interfere with the progression of vehicles to and/or from a nearby traffic signal installation and it would be practicable for the operation of pedestrian operated signals at or near the proposed site to be coordinated with the nearby signals, or - A pedestrian crossing (zebra) would normally be justified but would be hazardous for pedestrians due to conditions at the site (e.g., disabled or elderly pedestrians, high vehicle approach speeds, high traffic volume, poor visibility, etc.), or Where accident records indicate that two or more pedestrian casualty accidents have occurred in the last 3 years.
93
TCRP/NCHRP: Improving Pedestrian Safety at Unsignalized Crossings
TABLE F-10. Guidelines for the Installation of Pedestrian Crossings without Flashing Lights (continued). •
Appropriate locations for Pelican Crossings - Where the posted speed limit is 31 mph (50 km/h) or less and vehicle operating speeds are generally 40 mph (65 km/h) or less, and - Where pedestrian operated signals are installed and the pedestrians often cross the road so quickly, or in such small numbers, that delays to traffic after the last person has crossed are excessive, and - Where it is important to minimize the delays to traffic flow caused by pedestrians crossing a major road, and - The site has public lighting to AS (Australia Standard)/NZS (New Zealand Standard) 1158 standard or to AS/NZS 1158 standard – flood lighting at pedestrian crossings, and At locations with medians, there is good sight distance across the median. • Appropriate Locations for Puffin Crossings - Wherever normal pedestrian operated signals are installed or warranted, and - Where there is a known daily significant usage by slower moving (i.e., disabled or elderly) pedestrians, or - Where large numbers of pedestrians cross the road during certain periods of the day, and - Where it is important to minimize the delays to traffic flow caused by pedestrians crossing a major road. -
Note: Descriptions of zebra crossings, Pelicans, Puffins, and Toucan crossings are described in the ITE Informational Report entitled “Alternative Treatments for At-Grade Pedestrian Crossings (44).”
SUMMARY Following is a brief review of each set of guidelines: United States: The information summarized in this contains very specific guidelines based on research (31) relating to the placement of marked crosswalks at uncontrolled locations on various types of streets. This information could be used to develop warrants for the MUTCD. Canada: The Transportation Association of Canada has established guidelines (93) for the placement of pedestrian crossings that are both signalized and unsignalized. The province of Ontario has its own set of warrants. These guidelines and warrants could also be utilized to develop warrants for the MUTCD. United Kingdom: The U.K.’s guidelines for assessing pedestrian crossing (95) facilities requires the user to take into account a variety of factors for installing pedestrian crossings but does not provide specific warrants, criteria, or benchmarks. The staff at DLTR (Department of Local Government Transport and the Regions) indicated on the European Scanning Tour (97) that they have specifically avoided using numerical values in their guidelines, and they want the guideline users to employ engineering judgment in the final decision on whether to install a particular type of crossing. Australia: Very specific guidance is provided in the VicRoads (96) traffic manual about the placement of various types of pedestrian crossing facilities. These standards are rigidly applied and seldom ignored. They are quite detailed and would not readily be applicable to the 94
Appendix F: Pedestrian Crossing Installation Guidelines practice in the United States because Pelican and Puffin midblock signals are not used. However, if the research indicates that these types of midblock signals would be beneficial, the VicRoads manual would provide a good starting point for developing warrants in the MUTCD. Local agencies in the United States: The guidelines developed by the cities of San Luis Obispo and Sacramento in California contain specific guidance on the use of various types of midblock unsignalized crossings. These could be used to develop warrants in the MUTCD specifically relating to these types of facilities. PEDESTRIAN CROSSING INSTALLATION CRITERIA A summary of criteria identified during this TCRP/NCHRP project for pedestrian crossing installation criteria is summarized in the following tables. Table F-11 lists the criteria for signals, Table F-12 lists the criteria for marked crosswalks, and Table F-13 lists the criteria for other types of treatments.
95
TCRP/NCHRP: Improving Pedestrian Safety at Unsignalized Crossings TABLE F-11. Summary of Pedestrian Treatment Guidelines – Signals. Volume Pedestrian MUTCD (Signal) 100 ped/h for 4 hr or 190 ped/h for 1 hr
Vehicle
Source (Treatment) Distance to next crossing/signal
Fewer than 60 gaps/hr
Reductions allowed or Miscellaneous
>300 ft (91.4 m) 50 percent if crossing speed is 300 ft (91.4 m) • 50 percent if crossing speed is 40 mph (64.4 km/h), the main street volume can be reduced to 400 veh/h (80 percent of original)
• For streets with > 30 mph (48.3 km/h) speed limits, the required disabled or senior citizen pedestrian volume shall be reduced to 80 percent of the requirement • Pedestrian volumes may be increased if information indicates that an immediate increase in actual volume can be anticipated
Los Angeles, California (Traffic Signal – Midblock) 300 ft (91.4 m) Used for the purpose of Pedestrian volume consolidating midblock crossings to (street to be crossed guidelines of Manual is at least 50 ft [15.2 a single, preferred point of Policies and Procedures Section m] wide) 344 (see marked crosswalk, uncontrolled) is satisfied Traffic Control Devices Handbook (HAWK, flashing warning beacon, in-roadway lights and signs) Approximately ½ of No other crossing pedestrian signal controlled by signal warrant volumes or stop sign within Meets guidelines for 600 ft (182.9 m) marked crosswalk
97
TCRP/NCHRP: Improving Pedestrian Safety at Unsignalized Crossings TABLE F-12. Summary of Pedestrian Treatment Guidelines – Marked Crosswalk. Source (Treatment) Distance to next Reductions allowed or Miscellaneous crossing/signal Ped Vehicle 2002 FHWA UNC report (Marked Crosswalks) Min 20 ped/peak Ranges of 15,000 vpd speed limit, and vehicle ADT ITE RP Design and Safety of Pedestrian Facilities (Marked Crosswalk) Graph of ADT and hourly pedestrian 600 ft (182.9 m) volume by number of lanes Arizona (Marked Midblock Crosswalk) 1000 ft (304.8 m) Point system (max 33) that considers: High pedestrian between intersections volume generator • Average gaps/5 min (10 pts for 100 crossings and 0 pts for 45 mph [72.4 km/h]) • General conditions, max 8 pts (2 pts each for: clarify pedestrian routes, channelize pedestrian into shorter path, position pedestrian to be seen, position pedestrian to expose to few vehicles) Redmond, Washington 5/5/03 Crosswalk Marking Practice (Marked Crosswalks) 20 ped/peak hour At all-way stop-controlled intersections (or 15 or more and signalized intersections older or child ped) – high priority on the installation Redmond, Washington 5/5/03 Crosswalk Marking Practice (Marked Crosswalk, Unsignalized Intersection) 20 ped/peak hour Matrix from the 600 ft (182.9 m) Additional factors to be considered: (or 15 or more 2002 FHWA study stopping sight distance (SSD), older or child ped) (also known as UNC illumination, geometrics, heavy trucks, – high priority on study) attention demands, risk factors the installation San Luis Obispo (Marked crosswalks – Intersection) 40 ped/h for peak 2700 ADT or more Minimum of 600 ft • 85th percentile speed is below 40 mph hour for residential street (182.9 m) to nearest (64.4 km/h) 30 groupings of 2 controlled crossing • Less than three travel lanes in one or more pedestrian direction for a continuous 2• Minimum sight distance available hr period twice a day Volume
98
Appendix F: Pedestrian Crossing Installation Guidelines TABLE F-12. Summary of Pedestrian Treatment Guidelines – Marked Crosswalk (continued). Source (Treatment) Distance to next Reductions allowed or Miscellaneous crossing/signal Ped Vehicle San Luis Obispo, California (Marked Crosswalk – Midblock) High pedestrian Distance between volume generator intersection is 660 ft nearby (201.2 m) Reasonable demand to Reasonable cross within a demand concentrated area that is 200 ft (61 m) from nearest controlled intersection Sacramento, California, Jan 2003 (Various : triple-four, pedestrian refuge, overhead flashing beacons, Level 1, Level 2, pedestrian signal, pedestrian bridge) Yes • Recommendations provided by numbers of cars, posted speed, and number of lanes (2, 3, 4, 5 lanes) Canada (Special Crosswalk) When crossing opportunities/hour are 90 or • Consider accident history less and EAU (ped/h) = 30 (250,000 pop) 2X, seniors 1.5X, disabled 2X, adults 1X) Canada (Signed and marked crosswalk) • Smaller communities allow reduction When crossing opportunities/hour are 120 to EAU (-10 for 250,000 pop) • Provides graphs that converts traffic volume to crossing opportunities for different traffic patterns New Zealand (Pedestrian crossing) Product of number of pedestrian and vehicles exceed 45,000 and Number of vehicles is not less than 300 AUSTROADS (Pedestrian crossing) 60 ped/h, 600 veh/h, and product of ped and veh > 90,000 Seattle, Washington (Marked crosswalk) Matrix from 2002 200 ft (61 m) (to nearest • Include engineering evaluation that FHWA study existing signal (with considers other factors (e.g., some exceptions) pedestrian volumes, etc.) Volume
99
TCRP/NCHRP: Improving Pedestrian Safety at Unsignalized Crossings TABLE F-12. Summary of Pedestrian Treatment Guidelines – Marked Crosswalk (continued). Source (Treatment) Distance to next Reductions allowed or Miscellaneous crossing/signal Ped Vehicle Los Angeles, California (Marked Crosswalk: uncontrolled – MPP 344) 20 pedestrian 300 ft (91.4 m) to nearest • 85th percentile speed does not exceed units/hr controlled or marked 45 mph (75.2 km/h) (or posted does (minimum) crossing (minimum) not exceed 40 mph [64.4 km/h]), minimum • Must satisfy all minimums and one of the following three guidelines: o Pedestrian volume: 40 or more/hr during peak hour or 30 or more/hr during each of any 2 hr (children under 13, older over 64, and disabled counts as 2 ped) o Pedestrian route definition o Special facility (e.g., transit stop, school crossing, etc.) • Pedestrian crashes: 2 during 12 months or 3 during 2 years of most recent 4 years, consider prohibition of crossing, signal, smart ped warning, or marked crosswalk Eugene, Oregon, Design Standards, Nov 99 (Midblock crossing) 25 ped/h for peak 4 hr with ADT >10,000 Intersection crossings are • Reduce pedestrians to 10 ped/h (peak and speeds are 40 mph (64.4 km/h) or less spaced greater than 600 4 hr) when significant numbers of ft (182.9 m), or so that children, elderly, or disabled are crosswalks are located present more than 400 ft (121.9 • Consider curb extensions and/or raised m) (apart in high median islands pedestrian volume locations Florida, Pedestrian Planning & Design Handbook (Marked Crosswalk) At channelized Can concentrate or • Included the islands: number of channelize multiple ped curves ped X num of veh crossings to single developed by exceeds 800/hr location Smith and Knoblauch • High numbers of ped crossings (>25 ped/h) Volume
100
Appendix F: Pedestrian Crossing Installation Guidelines TABLE F-13. Summary of Pedestrian Treatment Guidelines – Other Treatment Types. Source (Treatment) Distance to next Miscellaneous Volume crossing/signal Ped Vehicle Redmond, Washington, 5/5/03 Crosswalk Marking Practice (In-pavement lighting system) 100 ped/day Average weekday Over 250 ft (76.2 m) to • Max of two travel lanes to cross (considering a daily traffic volume nearest crosswalk or (considering a revision to no more revision to 40 between 5,000 and traffic control device than three lanes or four lanes with a ped/h for 2 hr) 30,000 veh/day (considering revised raised pedestrian refuge median) value of 300 ft [91.4 m] • 85th percentile speed of 45 mph (72.4 and adding statement km/h) or less about considering • SD = 400 ft (121.9 m) (< 35 mph location and traffic [56.3 km/h]) or 600 ft (182.9 m) (35 to volume of driveways 45 mph [56.3 to 75.2 km/h]) impacting the crosswalk) MUTCD (In-pavement lighting system) • Marked crosswalk • Not at a stop, yield, or signalcontrolled location San Luis Obispo, California (In-road pavement lighting) 100 veh/h for any 4 10,000 veh/day • 85th percentile speed is 35 mph (56.3 hr, or 100 groups km/h) or less of 2 or more • Two or more travel lanes in one pedestrians for a direction but not more than four continuous 2-hr through lanes in both direction period twice a day • Not controlled by signal, stop, or yield sign • AFTER DARK: ped volume is 75 ped/h for 1 hr or 25 ped/h for any 4 hr during nighttime Sacramento, California, Jan 2003 (Various : triple-four, ped refuge, overhead flashing beacons, Level 1, Level 2, ped signal, ped bridge Yes • Recommendations provided by numbers of cars, posted speed, and number of lanes (2, 3, 4, 5 lanes) Canada (Post-mounted signs and markings, overhead signs and markings, special crosswalk, ped signal) Crossing Ped volume • Consider accident history converted into opportunities in 1 hr • Smaller communities allow reduction equivalent adult to EAU (-10 for 250,000) seniors 1.5X, disabled 2X, adults 1X)
101
TCRP/NCHRP: Improving Pedestrian Safety at Unsignalized Crossings TABLE F-13. Summary of Pedestrian Treatment Guidelines – Other Treatment Types (continued). Source (Treatment) Distance to next crossing/signal Ped Vehicle Los Angeles, California (Smart Pedestrian Warning) 10,000 veh/day 300 ft (91.4 m) of a controlled crossing, 200 ft (61 m) of a railroad crossing, or 300 ft (91.4 m) of any other flashing yellow warning beacon Roadway to be crossed is 50 ft (15.2 m) or more Volume
Florida Traffic Engineering Manual Feb 03 (In-roadway lights) References MUTCD
102
Miscellaneous • Point system o Ped volume – up to 8 pts for 136 ped/h peak hour, 91 or more for 2 hr, 51 or more for each of any 4 hr. Note that 2001 veh/h total of both directions o Speed – up to 6 pts for 40.1 mph (64.5 km/h) or faster 85th percentile speed o Up to 6 pts for 7 lanes or more o Up to 10 pts for crashes o Up to 4 pts for special facilities o Up to 4 pts for restricted visibility • Only at marked midblock crosswalks with ped heads • Not on: four lanes, posted speed above 45 mph (72.4 km/h), where yield, stop, or signal control present
Appendix G: International Signal Warranting Practices
APPENDIX G INTERNATIONAL SIGNAL WARRANTING PRACTICES This Appendix summarizes a sample of international practices related to pedestrian signal warranting criteria. It was based on international practices as identified through literature searches and world wide web searches. In the United States, the Manual on Uniform Traffic Control Devices (MUTCD) governs the applications of traffic control devices for all 50 states. While supplements can be developed to address local or regional concerns, there is little deviance from the national MUTCD. Therefore, the purpose of this Appendix is to provide a flavor of various warranting criteria that international transportation agencies use to consider the need for a traffic signal based on pedestrians. Table G-1 compares the U.S. pedestrian warranting considerations to those international pedestrian warranting considerations that have been reviewed. TABLE G-1. Pedestrian Warranting Factors. Warranting Factors
USA
United Kingdom
Pedestrian Volume Vehicle Gap Availability Vehicle Speed Nearest Traffic Signal Vehicle Progression Nearest Crosswalk Adjacent Land Use Crash Experience Roadway Cross Section Roadway Class Walking Speed Peak Hour Delay Pedestrian Composition Vehicle Delay Vehicle Volume Latent Demand (Vehicle)
103
Canada
Australia
South Africa
TCRP/NCHRP: Improving Pedestrian Safety at Unsignalized Crossings UNITED KINGDOM (98, 99, 100) Official guidance on whether a pedestrian crossing should be provided and, if so, what sort of crossing is most suitable, is contained in Local Transport Note (LTN) 1/95 and LTN 2/95. These documents recommend use of an assessment framework. The site should be surveyed approximately 164 ft (50 m) either side of the proposed crossing point and all relevant information recorded, including: Carriageway and footway type and width, Surroundings, Vehicular/pedestrian flow and composition, Average crossing time and difficulty of crossing, and Road accidents. The crossing options should then be assessed against the relevant factors which are likely to include: Difficulty in crossing, Peak hour vehicle delay, Carriageway capacity, Vehicle speeds, Local representations, and Cost. LTN 1/95 introduced a more comprehensive and flexible assessment procedure than was previously required. It replaces the PV2 criterion where P = pedestrian flow and V = vehicle flow: the general rule was that a Pelican crossing should only be installed if PV2 > 1 x 10⁸ (although other factors, such as proximity to a school or hospital, could be taken into account if the PV2 criterion was not met). Although now officially superseded, PV2 remains in day-to-day use and comparison of the methods is interesting. The planning, design, and installation of pedestrian crossings are prescribed in LTN 2/95. This covers all types of at-grade crossings, including pedestrian refuges, zebra crossings, and various types of signal-controlled crossings. Advice is given in relation to the proximity of junctions, school crossing patrols, visibility, crossing width, guard railing, crossing approach, surfaces, disabled pedestrians, lighting, signing, bus stops, and street furniture. Under the Road Traffic Regulation Act of 1984, it is no longer necessary for local highway authorities to obtain approval from the government for installation or removal of a pedestrian crossing. However, they should consult locally and inform the Department of the Environment, Transport, and the Regions (DETR). CANADA (101) The Canadian MUTCD is generally very similar to the U.S. MUTCD. However, at least one significant difference is in the way in which traffic signal warranting criteria are established and used. The following pages show how the Canadian MUTCD addresses traffic signal warrants
104
Appendix G: International Signal Warranting Practices (pedestrian consideration is integrated into the overall process). The process is much more involved than in the United States and is more akin to the Highway Capacity Manual (HCM) procedures.
105
TCRP/NCHRP: Improving Pedestrian Safety at Unsignalized Crossings
106
Appendix G: International Signal Warranting Practices
107
TCRP/NCHRP: Improving Pedestrian Safety at Unsignalized Crossings
108
Appendix G: International Signal Warranting Practices
109
TCRP/NCHRP: Improving Pedestrian Safety at Unsignalized Crossings
110
Appendix G: International Signal Warranting Practices
111
TCRP/NCHRP: Improving Pedestrian Safety at Unsignalized Crossings
112
Appendix G: International Signal Warranting Practices
113
TCRP/NCHRP: Improving Pedestrian Safety at Unsignalized Crossings
114
Appendix G: International Signal Warranting Practices
115
TCRP/NCHRP: Improving Pedestrian Safety at Unsignalized Crossings
116
Appendix G: International Signal Warranting Practices
117
TCRP/NCHRP: Improving Pedestrian Safety at Unsignalized Crossings
118
Appendix G: International Signal Warranting Practices
119
TCRP/NCHRP: Improving Pedestrian Safety at Unsignalized Crossings SOUTH AFRICA (102) In recent years, the warrants for the provision of pedestrian signal heads have undergone a major change in the sense that the conditions under which these facilities are provided are based on engineering judgment of an intersection instead of a fixed volume warrant. The following are typical conditions under which pedestrian signal heads are now considered in South Africa: When traffic volumes or turning traffic are so high as to require a leading pedestrian phase, When advance or extended green vehicular phases permit turning movements across a pedestrian crossing, When no signal heads for vehicles are provided opposite pedestrian crossings (e.g., at one-way streets), and When pedestrians are confused at large or complicated intersections. An analysis of road accident statistics showed that more than half of all pedestrians involved in road accidents crossed the road at points where no pedestrian crossings existed. A study to investigate the effectiveness of the existing midblock pedestrian crossing system found the following deficiencies: Lack of uniformity in the provision of unsignalized and signalized midblock pedestrian crossings contributed to the inconsistent provision of facilities. Poor conspicuity of these crossings contributed to an unsafe situation at these crossings. To address the problem of the inconsistent provision of pedestrian crossings, warrants were developed for the provision of yield sign-controlled (type of unsignalized crossing) and traffic signal-controlled midblock pedestrian crossings. These warrants consider a number of traffic and pedestrian characteristics such as one- versus two-way roads, roadway width to be crossed, speed limit, and pedestrian walking speed for different age groups. To test the warrants, they were applied to a number of high accident frequency spots where no pedestrian crossings existed. They were also applied to crossings where large numbers of pedestrians were crossing roads. It was shown that pedestrian crossings were needed at several of the sites without crossings and several of the existing crossings were in need of upgrades. AUSTRALIA (103, 104, 105) The Australian Standard Manual of Uniform Traffic Control Devices and the Austroads Guide to Traffic Engineering Practice provide a set of guidelines for the control and protection of pedestrians. In practice they are used as guidelines and are not legally enforceable. The draft Australian Road Rules has a number of sections relating to pedestrians. The Australian Road Rules will not be enforceable until legislated by Federal Parliament. It is expected that the rules will then become an Australia-wide standard, replacing current traffic regulations in each of the states.
120
Appendix G: International Signal Warranting Practices The Australian Standard (AS) 1742.10-1990 Manual of Uniform Traffic Control Devices, Part 10: Pedestrian Control and Protection, sets out requirements for traffic control devices to be used in the control and protection of pedestrian traffic on roads. It specifies the way in which these are used to achieve pedestrian control. The manual includes definitions, installation details, clause references, and references to other applicable standards. Requirements for the illumination and reflectorization of signs, their installation, location, and size are outlined in the appendixes. Details are also included on model instructions for adult supervisors and child monitors at children’s crossings, pedestrian-actuated traffic signals, and pedestrian treatments at railway level crossings. The relevant material of AS1742.10 is shown in Table G-2.
121
TCRP/NCHRP: Improving Pedestrian Safety at Unsignalized Crossings TABLE G-2. Portions of Material from Australian Standard (AS) 1742.10-1990. 6.3 6.3.1
Children’s Crossings Installation The distinctive feature of a children’s crossing is its part-time nature, being designed to operate as a crossing only at such times as when one or more CHILDREN’S CROSSING flags (R3-3) (see Clause 10.1.5) are displayed to vehicular traffic. This type of crossing, which includes use of posts painted in red and white alternate bands, is usually installed near school locations where the requirements for such a facility arise only during specific and limited times of the school day. A children’s crossing may be supplemented by twin alternating flashing yellow signals at or in advance of the crossing. A children’s crossing may be supervised during the times when it is operational, in which case, subject to State regulations, the hand STOP Banner (R6-7) may be used (see Clause 10.1.10).
6.3.2
Guidelines for installation The children’s crossing may be installed where there is a demand for children to cross the road during daylight hours and an undertaking can be obtained to display the CHILDREN CROSSING flags (R3-3) during, and only during, the specified period of operation (see Clause 10.1.5).
Before installing a children’s crossing on an arterial road, the matter should be carefully considered. 6.4 6.4.1
Pedestrian actuated traffic signals (mid-block) Installation Pedestrian actuated traffic signals (mid-block) shall comply with AS 2144 and pedestrian push buttons with AS 2353. The line marking and sign arrangement for a mid-block pedestrian actuated traffic signal installation is shown in Figure 3. The absence of the usual intersection cues in relation to mid-block signals necessitates a particularly high standard of signaling. Mast-arm or median island signals may need to be installed on carriageways with more than three lanes in one direction. The principles for installation of the signals are given in AS 1742.2. A signalized crossing may be supervised during the times when it is used by significant numbers of school children. The hand STOP Banner is NOT used at traffic signals.
122
Appendix G: International Signal Warranting Practices TABLE G-2. Material from Australian Standard (AS) 1742.10-1990 (continued). 6.4.2
Guidelines for installation Pedestrian-actuated traffic signals (midblock) may be provided if any of the following conditions exist: (a) The pedestrian volume exceeds 350 persons per hour for each of 3 hr on an average day, and during each of the same 3 hr the traffic volume exceeds 600 veh/h (total both directions), or 1000 veh/h (total both directions) where there is a central pedestrian refuge. (b) For each of 8 hr of an average day – (i) the traffic volume on the road exceeds 600 veh/h (total both directions), or 1000 veh/h (total both direction) where there is a central pedestrian refuge; and (ii) during the same 8 hr the pedestrian volume is 175 or more persons per hour; and (iii) there is no other pedestrian crossing, footbridge or subway within a reasonable distance. (c) At a school where, in two separate 1 h periods of a typical school day, there are no fewer than 50 persons crossing the roadway and at least 600 vehicles pass the site subject to the product of the number of pedestrians per hour and vehicles in the same hour exceeding 40,000. (d) The pedestrian and traffic volume is sufficient to justify a pedestrian crossing but pedestrians would be in danger on an “unprotected” pedestrian crossing. This could be due to the width of carriageway, traffic speed, or traffic volume (e) A pedestrian crossing exists and two or more pedestrian accidents of a type susceptible to correction have occurred on or near the crossing within the past three years. (f) A pedestrian crossing is justified and pedestrian volumes are very heavy and coincide with high traffic volumes to the extent that excessive delays to road traffic are likely.
In addition to the above, if the guidelines for the provision of a pedestrian crossing (zebra) are met and the site is either adjacent to a railway level crossing, close to a signalized intersection on an arterial road, or within a coordinated traffic signal system, consideration should be given to the use of pedestrian actuated signals instead of the pedestrian crossing (zebra). For signals which cater mainly for persons with particular disabilities, e.g., aged, blind, deaf, or disabled persons, the above warrants may be modified to make allowance for the different characteristics of the pedestrian traffic. Where appropriate, pedestrian-actuated traffic signals (midblock) should be coordinated with intersections signals or railway level crossing signals. If it is necessary to install midblock signals in such close proximity to an intersection or railway level crossing that queuing is likely to occur across the intersection or railway level crossing, the signal controls at the two points should be coordinated to obviate such queuing. The need to keep pedestrian delays to a minimum should also be considered.
123
TCRP/NCHRP: Improving Pedestrian Safety at Unsignalized Crossings TABLE G-2. Material from Australian Standard (AS) 1742.10-1990 (continued). Intersection traffic signals should be considered if a pedestrian-actuated signal meeting the above requirements is to be located at or close to an intersection. However, account should be taken of the possible traffic impacts of such intersection signals on local streets within the adjacent area. 6.5
Pelican crossings
6.5.1
Installation The requirements for the installation of a pelican crossing are the same as for pedestrian-actuated traffic signals (midblock) as given in Clause 6.4.1. The line marking and sign arrangements are the same as those shown in Figure 3.
6.5.2
Guidelines for installation The main advantage of Pelican crossings is the reduced delay to vehicles. Studies have shown that vehicle delays at Pelican crossings are approximately half those at conventional pedestrian-actuated signals. Pelican crossings may therefore be provided if – (a) pedestrian-actuated traffic signals (midblock) are justified; (b) the site would benefit from reduced vehicle delays; and (c) the site is in an area where the 85th percentile speeds are less than 49.7 mph (80 km/h).
124
Appendix H: Adequacy of Pedestrian Signal Warrant
APPENDIX H ADEQUACY OF PEDESTRIAN SIGNAL WARRANT As part of Phase I, the research team evaluated the adequacy of the pedestrian signal warrant. This Appendix provides the history of the pedestrian traffic signal warrant and an analysis of the adequacy of the pedestrian signal warrant contained in the Millennium Edition (91) and the 2003 Edition (1) of the MUTCD. BASIS OF THE PEDESTRIAN SIGNAL WARRANT A form of the pedestrian signal warrant has been included in every version of MUTCD dating back to the first Manual in 1935. Table H-1 summarizes the warranting criteria needed to satisfy the pedestrian signal warrant as it has evolved in the past 70 years. Figure H-1 shows the current language. Starting at the inception of the warrant in 1935, the warranting criteria were becoming increasingly difficult to satisfy up to a maximum difficulty level in 1961. For the next 27 years the warranting criteria remained unchanged while the Manual underwent significant updates. The 1988 Manual included a major shift in the pedestrian warranting criteria. It is probably no coincidence that the majority of the published research related to the pedestrian signal warrant was conducted during the 1970s and early 1980s. A detailed review of these studies is included in TxDOT Report 2136-1 (106). In 1988, the signal warrant criteria were amended to make them more responsive to the needs of pedestrians, the elderly, and the handicapped. The changes were based in part on two FHWA-sponsored research studies (107, 108) but also included modifications from the National Committee on Uniform Traffic Control Devices (NCUTCD) because it was felt that the research recommendations did not adequately reflect the negative tradeoffs of installing pedestrian signals (from: FHWA Official Ruling IV-60 [Change], 1988). The main problem with the pre-1988 pedestrian warrant was the requirement to have 150 or more pedestrians on the highest volume crosswalk crossing the major street for an 8-hr period. Converting this requirement to daily pedestrian volumes yields approximately 7600 pedestrians crossing four legs of a typical intersection or 2700 pedestrians per day crossing a midblock location. Another philosophy of the time was that pedestrians desiring to cross the major roadway faced a similar situation as vehicles on the minor approach waiting to cross the major. In fact, the lack of any relationship to the number of adequate gaps was cited in Official Ruling IV-60(c) as one of the key reasons for change the pedestrian warrant criteria in 1988. Gap-based warrants were also the focus of one of the earlier pedestrian warrant studies (108).
125
TCRP/NCHRP: Improving Pedestrian Safety at Unsignalized Crossings TABLE H-1. Evolution of the Pedestrian Warrant Criteria. MUTCD Warranting Conditions Year The minimum pedestrian and vehicular volumes ... are as follows: 1935, < Pedestrian volume crossing the major street must average at least 300 ped/h for at least 6 hr per day, 1939
1942
1948
1961, 1971, 1978
1988, 2000, 2003
< Vehicular traffic entering the intersection from the major street must average at least 750 veh/h for the same 6 hr, and < Vehicular speeds during the 6 hr must frequently exceed 15 mph (24 km/h). The minimum pedestrian and vehicular volumes ... are as follows: < Pedestrian volume crossing the major street must average at least 300 ped/h for at least 6 hr per day and < Vehicular traffic entering the intersection from the major street must average at least 750 veh/h for the same 6 hr. In urban areas: < Pedestrian volume crossing the major street must average at least 250 ped/h for any 8 hr of an average day, and < Vehicular traffic entering from the major street must average at least 600 veh/h for the same 8 hr, and < The average vehicle speed must exceed 15 mph (24 km/h) on the approaches to the intersection. In rural areas: < Pedestrian volume crossing the major street must average at least 125 ped/h for any 8 hr of an average day, and < Vehicular traffic entering from the major street must average at least 300 veh/h for the same 8 hr, and < The average vehicle speed must exceed 30 mph (48 km/h) on the approaches to the intersection. This warrant is satisfied when for each of any 8 hr of an average day, the following volumes exist: < On the major street, 600 veh/h or more enter the intersection (total of both approaches); or 1000 veh/h or more (total of both approaches) enter the intersection on the major street where there is a raised median island 4 ft or more in width; and < During the same 8 hr as in paragraph 1, there are 150 ped/h or more on the highest volume crosswalk crossing the major street. When the 85th percentile of major street traffic exceeds 40 mph (64 km/h), or when the intersection lies within the built-up area of an isolated community having a population of less than 10,000, the minimum pedestrian volume warrant is 70 percent of the requirements above, in recognition of the differences in the nature and operational characteristics of traffic in urban and rural environments and smaller municipalities. A traffic signal may be warranted where the pedestrian volume crossing the major street at an intersection or midblock location during an average day is: < 100 or more for each of any 4 hr, or < 190 or more during any 1 hr. The pedestrian volume crossing the major street may be reduced as much as 50 percent of the values given above when the predominant pedestrian crossing speed is below 4.0 ft/sec. In addition to the volumes stated above, there shall be less than 60 gaps/hr in the traffic stream of adequate length for pedestrians to cross during the same period when the pedestrian volume criterion is satisfied.
126
Appendix H: Adequacy of Pedestrian Signal Warrant
Section 4C.05 Warrant 4, Pedestrian Volume Support: The Pedestrian Volume signal warrant is intended for application where the traffic volume on a major street is so heavy that pedestrians experience excessive delay in crossing the major street. Standard: The need for a traffic control signal at an intersection or midblock crossing shall be considered if an engineering study finds that both of the following criteria are met: A. The pedestrian volume crossing the major street at an intersection or midblock location during an average day is 100 or more for each of any 4 hours or 190 or more during any 1 hour; and B. There are fewer than 60 gaps per hour in the traffic stream of adequate length to allow pedestrians to cross during the same period when the pedestrian volume criterion is satisfied. Where there is a divided street having a median of sufficient width for pedestrians to wait, the requirement applies separately to each direction of vehicular traffic. The Pedestrian Volume signal warrant shall not be applied at locations where the distance to the nearest traffic control signal along the major street is less than 300 ft (90 m), unless the proposed traffic control signal will not restrict the progressive movement of traffic. If this warrant is met and a traffic control signal is justified by an engineering study, the traffic control signal shall be equipped with pedestrian signal heads conforming to requirements set forth in Chapter 4E. Guidance: If this warrant is met and a traffic control signal is justified by an engineering study, then: A. If at an intersection, the traffic control signal should be traffic-actuated and should include pedestrian detectors. B. If at a nonintersection crossings, the traffic control signal should be pedestrian-actuated, parking and other sight obstructions should be prohibited for at least 100 ft (30 m) in advance of and at least 20 ft (6.1 m) beyond the crosswalk, and the installation should include suitable standard signs and pavement markings. C. Furthermore, if installed within a signal system, the traffic control signal should be coordinated. Option: The criterion for the pedestrian volume crossing the major roadway may be reduced as much as 50 percent if the average crossing speed of pedestrians is less than 4 ft/s (1.2 m/s). A traffic control signal may not be needed at the study location if adjacent coordinated traffic control signals consistently provide gaps of adequate length for pedestrians to cross the street, even if the rate of gap occurrence is less than 1 per minute. Figure H-1. Current Pedestrian Signal Warrant (1). 127
TCRP/NCHRP: Improving Pedestrian Safety at Unsignalized Crossings The gap concept is based on the hypothesis that a pedestrian must wait for an adequately sized gap and, as the number of adequate gaps decreases, pedestrians experience more delay. If the waiting time becomes excessive, the pedestrian may become impatient and may even step off the curb onto the road to force a gap. This behavior would obviously be undesirable and unsafe. It was reasoned that there is a point when the pedestrian waiting time become intolerable. This was termed acceptable pedestrian delay and a value of 60 seconds was more or less arbitrarily chosen. The minimum pedestrian volume threshold was maintained to reflect the negative tradeoffs associated with the installation of a traffic signal (such as vehicle delay on the major road). Previous research had recommended values ranging from equivalent daily pedestrian volumes of 1200 at an intersection and 760 at midblock locations (107). The NCUTCD reviewed these recommendations and decided that they would result in an excessive number of traffic signals. They recommended, and the FHWA adopted, equivalent daily pedestrian volumes of 2000 at an intersection and 1250 at a midblock crossing. These criteria are derived from the current criteria of 100 pedestrians or more for each of any 4 hours of an average day and 190 or more pedestrians crossing the major street. In an attempt to accommodate the elderly and handicapped, Zeeger et al. (107) recommended a new warrant separate of the pedestrian warrant. The NCUTCD reviewed the proposed warrant and ultimately decided to work it into the revised pedestrian warrant of 1988 by including a pedestrian volume reduction factor based on walking speed. The FHWA adopted their recommendation rather than developing a new warrant for a specific class of pedestrians. The vehicle gap, pedestrian volume, and walking speed criteria discussed in the immediate paragraphs were introduced into the MUTCD in 1988. The pedestrian warranting criteria did not change with the release of the Millennium Edition of the MUTCD or the 2003 Edition. CRITIQUE OF THE PEDESTRIAN SIGNAL WARRANT The current pedestrian warrant has many factors that are to be considered when evaluating whether a signal is warranted. For this TCRP/NCHRP project, these factors were split into three levels: primary factors, secondary factors, and not related to current research study. These levels are based on the type of requirement as indicated in the language of the MUTCD and the relevance to the issue being studied. Primary factors are those factors that must be considered and they include available vehicular gaps (based on critical gap), pedestrian volume, and distance to the nearest traffic signal. A secondary factor is the adjustments to pedestrian volumes based on the average walking speed. Other factors in the current pedestrian signal warrant considered not relevant to this research project include type of pedestrian signal heads, coordination, actuation, detection, parking, signing, and markings. Despite the wide range of factors included in the current pedestrian signal warrant, there are other factors that could be considered. For example, it seems reasonable to expect a correlation between acceptable gap criteria and factors such as pedestrian age, pedestrian vision (and walking) abilities, vehicle speed, and roadway cross section. There is also no mention of
128
Appendix H: Adequacy of Pedestrian Signal Warrant safety considerations within the warrant. Particularly critical to the TCRP/NCHRP project, there is no consideration of pedestrian generators such as transit stops within the warranting criteria. There are also no allowances for induced pedestrian volumes that could result from the installation of such a pedestrian-friendly treatment. Pedestrian delay is the measure used in the Highway Capacity Manual to determine level of service for pedestrians. Delay is not directly considered in the signal warrant; however, it is related to other variables such as pedestrian volume and gaps. Other needed attributes of the warrant could be a reference to alternative traffic control and how to determine the size of the adequate gap length. The guidance section could be expanded to note that if a signal is not warranted then less restrictive controls may be appropriate, for example, in-roadway warning lights. Information on how to calculate critical gaps would provide the user with the preferred method for determining the value. It would also show sensitivity to number of lanes and walking speed. The HCM (109) contains a method to calculate critical gap for a single pedestrian or a group critical gap in Chapter 18 and could be referenced. The following discusses and critique the key factors introduced above. Primary and Secondary Factors Vehicular Gap The introduction of the gap criterion in 1988 was a significant change in philosophy. Because of variations in traffic signal timing plans, platooning, and platoon decay, a roadway with the same traffic volume can have different gap distributions. By using the gap criterion, local conditions are considered. However, the current 60-second criterion is derived from ITE’s school crossing guidelines (going back to 1962). The guidelines were based on an old but common traffic signal timing scheme of fixed 60-second cycles. The 1962 ITE guidelines state that traffic control is needed when the number of adequate gaps is less than the number of minutes in the same period of time. In other words, it was assumed that gaps less frequent than one per minute represent an unsatisfactory situation. This assumption has not been tested or documented. It is important to note that in today’s downtown areas (or other areas normally associated with pedestrian activity) it is very difficult to maintain 60-second cycle lengths because of pedestrian phasing and left-turn phasing. It is also important to note that the HCM indicates that the likelihood of risk-taking behavior by pedestrians is very high when pedestrian delay is at 45 seconds. The gap criterion needs to be investigated. Adjustments to the gap criterion may be needed based on factors such as difficulties in judging gap because of pedestrian age, pedestrian disabilities, relationship of number of acceptable gaps to risk-taking behavior, vehicle speed, number of lanes being crossed, etc. A part of the investigation should be to examine whether vehicular volume rather than gaps could be appropriate for use in the warrant.
129
TCRP/NCHRP: Improving Pedestrian Safety at Unsignalized Crossings Pedestrian Volume There are certainly countless locations where adequate gaps occur in the major street less frequently than one per minute. To account for the negative safety and operations impacts of installing too many traffic signals, a lower bound was set using pedestrian volume as the criterion. The current pedestrian volumes are higher than most of the previous research recommendations, which were developed based on different factors. In general, however, two sets of recommendations have been based on pedestrian delay. • •
NCHRP 3-20 and King: 100 ped/h for 4 hr Box: 60 ped/h for two 30-min periods.
Two more sets of recommendations have been based on pedestrian crash analyses: • •
Zeeger: 60 ped/h for 4 hr, 90 ped/h for 2 hr, and 110 ped/h for 1 hr Neudorff: 60 ped/h for 4 hr, 90 ped/h for 2 hr, and 110 ped/h for 1 hr
Comparing the pedestrian volumes included in Warrant 4 with the vehicular volumes in other warrants reveals some interesting trends. Warrant 2 considers minor road traffic volume for 4 hr while Warrant 3 considers minor road traffic volume for the peak hour. Warrant 4, which uses pedestrian values, also includes peak hour and 4-hour criteria. One difference between the two approaches is that only one “minor approach” value is provided in Warrant 4 rather than the sliding scale present in Warrants 2 and 3. In other words, as the major street volume increases in Warrants 2 and 3, the needed minor street volume to warrant a signal decreases. For the pedestrian warrant, a single “minor approach” value is provided. A comparison of the lower threshold volumes is shown in Table H-2. For example, an intersection with only 100 vehicles for the peak hour would warrant a signal before a midblock location with 190 ped/h. When the 70 percent factor is used, the difference becomes even more pronounced, an intersection could warrant a signal with only 75 veh/h while 190 ped/h would still be required. This comparison assumes a quite high number of vehicles on the major road; however, it does demonstrate a difference between vehicles and pedestrians. The 190 ped/h represents a single pedestrian every 19 seconds. In this condition the pedestrians would probably cross in groups, which could be a better comparison to vehicles. Perhaps the warrant should consider pedestrian groups rather than individual pedestrians. In summary, the vehicle warrants use a sliding scale while the pedestrian warrant uses absolute values. The absolute values are higher than the lower threshold values assumed for vehicles. The vehicle warrants also include a reduction factor for population and major roadway speed which is not present in the pedestrian warrant.
130
Appendix H: Adequacy of Pedestrian Signal Warrant TABLE H-2. Comparison of Vehicle and Pedestrians Threshold Values. Lower Threshold Volume (Pedestrian or Vehicle on Minor Approach) Number of Lanes Peak Hour Four Hour Condition on Minor Road b c Warrant 3 Warrant 4 Warrant 2 Warrant 4 Approach Vehicular Pedestrian Vehicular Pedestrian (veh/h) (ped/h) (veh/h) (ped/h) 2 or more 150 115 Warrant 190 100 1 100 80 2 or more 100 80 190 100 70% Factor a 1 75 60 a For communities 40 mph (64 km/h) on major street. Only applies to Warrants 2 and 3. b The minimum minor road volume occurs when the major street volume is approximately 1450 veh/h. c The minimum minor road volume occurs when the major street volume is approximately 1100 veh/h or more or at 800 veh/h when the community is 40 mph (64 km/h).
Distance to Nearest Traffic Signal The current warrant includes a provision that a signal shall not be considered at locations within 300 ft (91 m) of another signal. This is believed to be based on the distance a pedestrian will walk in order to cross the major street. The researchers did not identify data that support this distance or other distances of how far beyond the desired path a pedestrian would be willing to walk. The U.S. Department of Transportation’s 1995 Nationwide Personal Transportation Survey (110) did find that the majority of pedestrian trips (73 percent) are 0.5 mi (0.81 km) or less. With most trips being about 2600 ft (793 m), one could suspect that many pedestrians would be unwilling to increase their trip length by more than 10 percent in order to walk to a different crossing location. As part of on-street pedestrian surveys (see Appendix I), those interviewed were asked “if this crossing was not here, would you walk to the next intersection (point to intersection of interest)?” For three of the sites, only about 25 percent of the respondents would walk to a signalized intersection that was located at 550 ft (168 m), 950 ft (290 m), or 1000 ft (305 m). For the site with a signalized intersection about 200 ft (61 m) from the crossing, about half of those interviewed would walk to that crossing. The remaining site where this question was appropriate did not follow similar findings. A much higher percentage indicated that they would be willing to walk to another crossing. Over 65 percent of the respondents indicated that they would walk 600 ft (183 m) to cross at a signalized crossing. The greater number of individuals willing to walk such a distance was influenced by the number of lanes at the site (six lanes), speed and volume of traffic (high), and existing treatment (marked crosswalk only). Several of the respondents selected “yes” to the question and then commented that they walk to the nearby crossing “most of the time” or “sometimes” depending upon the weather or other factors. Reduction Criteria Based on Walking Speeds In the current warrant, the only reduction factor for the warranting criteria is based on walking speed and it only affects the pedestrian volume criterion. This concept was introduced in order to accommodate the elderly and handicapped. Specifically, if the average walking speed is less than 4 ft/s (1.22 m/s) then a reduction on the pedestrian volume of up to 50 percent can be implemented. 131
TCRP/NCHRP: Improving Pedestrian Safety at Unsignalized Crossings
Pedestrians have a wide range of needs and abilities. The MUTCD includes a comment that where pedestrians who walk slower than normal, or pedestrians who use wheelchairs, routinely use the crosswalk, a walking speed of less than 4.0 ft/s (1.22 m/s) should be considered in determining the pedestrian clearance times. Other research studies have identified pedestrian walking speeds ranging from 2.0 ft/s (0.6 m/s) to 4.3 ft/s (1.3 m/s). The HCM states that pedestrian walking speed depends on the proportion of elderly pedestrians (65 years of age and older) in the walking population. They provide the following for determining walking speed: Walking Speed % elderly pedestrians 4 ft/s 0 to 20 3.3 ft/s >20 to 30 3.0 ft/s >30 to 40 Decrease walking speed by 0.3 ft/s (0.1 m/s) for every addition 10 percent increase in elderly pedestrian population. It is reasonable to question the walking speeds in the MUTCD, especially considering disabled pedestrians, child pedestrians, and elderly pedestrians (all frequent users of transit). It is also reasonable to consider how crossing speed may be correlated to such factors as type of traffic control (several previous studies were at signalized rather than unsignalized intersections), type of pedestrian generator (e.g., transit, senior citizen home, etc.), vehicle speed, roadway cross section, number of pedestrians, pedestrian age, etc. POTENTIAL FACTORS Pedestrian Generators (Transit Stops) The closeness of a pedestrian generator is not considered within the current pedestrian signal warrant. Examples of pedestrian generators include schools of all levels, senior citizen homes, and transit stops. There is obviously a periodic generation of pedestrian at a transit stop and although the volumes may not be steady, they may be significant for short burst of time. School Warrant The school signal warrant has a unique feature that may possibly lend itself quite nicely to the handling of all pedestrian crossing treatments. In the school warrant, the main consideration is the ratio between the number of adequate gaps to the number of minutes the crossing is being used. This ratio could be used to set thresholds for various crossing treatments. For instance, when fewer adequate gaps exist than are needed, a system could be developed that uses the level of deficiency to select the crossing treatment. The crossing treatments and deficiency scores would be ranked in a less to more restrictive order with the traffic signal being the most restrictive.
132
Appendix H: Adequacy of Pedestrian Signal Warrant Crash Experience Other countries use crash experience to justify the installation of a traffic signal. The MUTCD includes a crash experience warrant but it is focused on vehicular crashes. It may be reasonable to include a factor within the warranting criteria that considers safety in terms of pedestrian-related crashes, especially because of the vulnerability associated with pedestrian crashes. Pedestrians are involved in less than 1 percent of all crashes, but yet they account for 18 percent of highway fatalities (Minnesota). Counting Pedestrians on the Minor Approach with Vehicular and Bicycle Volumes Other research (106) has recommended more global changes to the way pedestrians are handled in the signal warranting criteria. The recommendations include counting pedestrians on the minor approaches as vehicles and bicycles are counted now. This would change the vehicular-based warrants to all mode, intersection-based warrants. It would also allow the pedestrian warrant to focus on just the midblock crossing, which would make the warrant more straightforward. The largest issue that needs to be considered is how to count pedestrians versus vehicles. The pedestrians are exposed to inclement weather conditions, they have slower acceleration and speed rates resulting in longer crossing times, and they are at considerably more risk than occupants of vehicles, especially as the major street speeds increase. Therefore, it seems reasonable to develop an equivalency factor for pedestrians at intersections. This concept could be simply where one pedestrian might count as three vehicles, or it could be more complex, depending on the age or walking speed of the pedestrian. Critical gaps for vehicles and pedestrians are provided in the Highway Capacity Manual (109) and the AASHTO Green Book (111). Table H-3 lists the critical gaps to cross a sample roadway. A pedestrian requires more time to cross an intersection than a vehicle. To cross a two-lane roadway, a pedestrian needs 39 percent more time (potential factor of 1.4). At a four-lane street, a pedestrian needs twice as much time, or a potential factor of 2.0. Canada’s pedestrian signal procedure includes equivalent adult units with children and disabled counting as 2.0 adults and seniors counting as 1.5 adults. TABLE H-3. Critical Gaps for Vehicle and Pedestrian at an Unsignalized Intersection. Through
Critical Gaps
Two lane Four lane
Vehicle (sec) 6.5 7.5
Source
Green Book Exhibit 9-57, assume passenger car
Pedestrians (sec) 9 15 HCM Equation 18-17, assume 12 ft (4 m) lanes, 4 ft/s (1.22 m/s) walking speed, and 3 sec start up
It is important to note that the concept of counting all road users on the minor street approach is not novel to the MUTCD. The current MUTCD multiway Stop warrant has a criterion that includes the summation of vehicles, bicycles, and pedestrians on the minor street approach. There is not an equivalency factor considered for pedestrians in the multiway Stop 133
TCRP/NCHRP: Improving Pedestrian Safety at Unsignalized Crossings warrant, in other words, one pedestrian counts similar as one car. Also, there is not a reduction of the number of pedestrians or bicycles to account for when a pedestrian or bike crosses at the same time as a car. Vehicle Speed Most of the current vehicular-based traffic signal warrants include a reduction factor based on the speed of the vehicles on the major street. As shown in Table H-1, the pedestrian signal warrant also included the same reduction factor until the 1988 revision. It should be noted that there is not a discussion in FHWA Final Rule IV-60 (Change) 1988 that describes the reasons that the vehicle speed reduction factor was dropped. Increased vehicle speeds represent additional challenges for pedestrians. Pedestrian fatality rates and injury rates increase as vehicle speed increases. Pedestrians also have a harder time judging adequate gaps as vehicle speeds increase. Pedestrian Delay The Highway Capacity Manual includes a procedure to estimate pedestrian delay for unsignalized intersection. It begins with calculating critical gap, which is defined as the time in seconds below which a pedestrian will not attempt to begin crossing the street. Critical gap is a function of average pedestrian walking speed, crosswalk length, and pedestrian start-up time and end clearance time. If platooning is observed in the field, the HCM provides the needed equations for determining the group critical gap. The average delay of pedestrians at an unsignalized intersection crossing depends on the critical gap, the vehicular flow rate of the subject crossing, and the mean vehicle headway. HCM Exhibit 18-13 (reproduced as Table H-4) is then used to determine the LOS of the crossing. A signal warrant could be developed based on a function of the pedestrian delay. For example, if a pedestrian is experiencing LOS F conditions, then a signal could be considered. Other measures could be a total pedestrian delay value or the warrant could require a minimum number of pedestrians at the site. For ease of use and based on user preference for only counting vehicles or pedestrians, pedestrian and vehicle volumes would need to be identified to represent the selected delay threshold(s). Warrant 3 (Peak Hour) also includes delay criteria for traffic on one minor-street approach (one direction only). Total stopped time delay is to exceed 4 vehicle-hours for a onelane approach or 5 veh-h for a two-lane approach. The volume on the same minor-street approach is to equal or exceed 100 veh/h for one moving lane of traffic or 150 veh/h for two moving lanes. (There is also a total entering criteria.) The minor road numbers represents average delays of 2.4 and 2.0 minute for a vehicle for one- and two-lane approaches, respectively. These delay values are much higher than what is assumed that pedestrians would tolerate; however, this concept represents another feasible approach for warranting a pedestrian signal.
134
Appendix H: Adequacy of Pedestrian Signal Warrant TABLE H-4. Reproduction of HCM Exhibit 18-13: LOS Criteria for Pedestrians at Unsignalized Intersections. LOS A B C D E F a Likelihood of acceptance of short gaps.
Average Delay/Pedestrian(s) 10 to 20 >20 to 30 >30 to 45 >45
Likelihood of Risk-Taking Behavior a Low Moderate High Very High
USAGE OF THE PEDESTRIAN SIGNAL WARRANT Before the pedestrian signal warrant was significantly revised in 1988, a study documented its relative use (112). Only 1.3 percent of 12,780 traffic signal installations surveyed were justified using the 1961 version of the pedestrian warrant. Another more recent survey (106) assessed the relative usage of the 1988 version (which reflects the current version) of the pedestrian signal warrant. This survey only asked about the previous 3 years worth of traffic signal installations. The survey was sent to state agencies and local agencies. No state agency had used the pedestrian signal warrant as the primary warrant to justify the installation of a signal (32 states responded). Of the 50 local agencies reporting, only 2 percent of the signal installations were based primarily on the pedestrian signal warrant. Combined, these data represent over 3500 signal installations. These data indicate that the usage of the pedestrian signal warrant has remained low despite significant changes in 1988. While the data were not collected or reported in a similar fashion between the two studies, the findings appear reasonable. Only a few candidate traffic signals are evaluated solely on the basis of pedestrian needs because the majority of intersections with heavy pedestrian activity, such as downtown areas, already satisfy one or more of the vehicular signal warrants. However, it is important to note that the need for traffic signals at midblock crossings would not consider side vehicle traffic only pedestrian needs. CONCLUSIONS Several elements with respect to the pedestrian signal warrant could benefit from additional investigation. This paper presented background information and a critique of the various factors associated with the pedestrian signal warrant. Following is a summary of those issues that could warrant additional research. Vehicular gap: Is the current gap criterion reasonable? What is the relationship between the number of acceptable gaps and risk-taking behavior? Should adjustments to the criterion be made for pedestrian capabilities (e.g., judging ability, disabilities, etc.) vehicle speed, number of lanes being crossed, or others? Pedestrian Volume: The current pedestrian volumes are higher than most of the previous research recommendations. They can also be higher than vehicle volumes in other signal warrants in certain scenarios. The vehicle warrants also use a sliding 135
TCRP/NCHRP: Improving Pedestrian Safety at Unsignalized Crossings scale (minor road and major road volumes change), while the pedestrian warrant has only one set value regardless of the volume on the major road. Should the pedestrian volume values be lower? Should it be on a sliding scale? Reduction Factor: The vehicle warrant includes a reduction factor for communities with less than 10,000 population or speeds above 40 mph (64 km/h) on the major street. Should this reduction factor also be present in the pedestrian signal warrant? Pedestrian Groups: Should the warrant consider pedestrian groups rather than individual pedestrians? As the number of pedestrians crossing increases, they would begin to cross in groups rather than as individuals. Distance to Nearest Traffic Signal: What is a reasonable distance that pedestrians can be expected to walk to cross at a controlled location? Walking Speed: What is a reasonable walking speed for unsignalized crossings for different user groups? How does the walking speed vary by major roadway speed, number of lanes being crossed, number of pedestrians, type of traffic control, pedestrian age, etc.? Ratio of adequate gaps to minutes crossing is used: Is the approach used in the school warrant appropriate for any pedestrian crossing? Pedestrian Generators: How should selected pedestrian generators, such as schools, transit stops, or senior citizen homes, be considered within the warranting process? Accidents: Should the pedestrian signal warrant include consideration of pedestrian accidents? Pedestrians on Minor Road Approach: Should pedestrians be included in determining the minor road demand as vehicles and bicycles are now? Pedestrian Equivalency: Should the warrants include a pedestrian equivalency factor? Pedestrians are exposed to inclement weather conditions, have slower acceleration and speed rates resulting in longer crossing times, need longer critical gaps, and are at considerably more risk than occupants of vehicles, especially as the major street speeds increase. Pedestrian Delay: Should the pedestrian warrant be more directly based on pedestrian delay? If so, is 60 seconds appropriate or should it be changed to 45 seconds, which is used to determine LOS F in the HCM? Or is another value more appropriate? What is the relationship between delay and risk behavior, street width, and other variables? Excessive Number of Signals: A concern with any change to the signal warrants is whether it will result in an excessive number of signals or in signals that are very disruptive to the effective flow of all traffic. How can those issues be investigated?
136
Appendix I: Suggested Issues to Consider
APPENDIX I SUGGESTED ISSUES TO CONSIDER WHEN REVISING THE PEDESTRIAN SIGNAL WARRANT The MUTCD (1) is the national standard for traffic control devices on all public roads. It states that the selection and use of traffic control signals should be based on an engineering study of roadway, pedestrian, bicyclist, and other conditions. This engineering study would include consideration of the traffic signal warrants present in the MUTCD. The traffic signal warrants were developed with “a careful analysis of traffic operations, pedestrian and bicyclist needs, and other factors at a large number of signalized and unsignalized intersections, coupled with engineering judgment.” Research projects are periodically conducted to ensure that the traffic signal warrants reflect current operational and safety needs for the different user groups. In addition to researching operational and safety needs, periodic reviews of engineer’s judgment toward the traffic signal warrants (or toward proposed revisions to the traffic signal warrants) are needed. One such approach to reviewing engineer’s judgment would identify potential sites to be considered in an evaluation. The characteristics of the sites would be provided to traffic engineers who have agreed to participate in the study. They would be asked to visit the sites and provide their engineering judgment as to whether a traffic signal is needed. They would also be asked to provide their opinions on other treatments that could be appropriate for the site. The unique requirements of the study approach include: (a) being in an area where a large number of traffic engineers will be congregating, (b) having a sufficient number of potential sites (i.e., sites that have qualities where a signal would be considered), and (c) having the potential study sites be within a reasonable driving distance (since the participants would need to visit each site). The TCRP/NCHRP D-08/3-71 study on Improving Pedestrian Safety at Unsignalized Intersection has as an objective to recommend modifications to the MUTCD pedestrian traffic signal warrant. Using an assessment of the criteria considered when determining whether a traffic signal should be installed was one of the approaches used in the TCRP/NCHRP study to identify potential changes to the traffic signal warrant. PREVIOUS EFFORT A Texas study (106) recruited six department of transportation, seven city, and one consultant representatives (all from Texas) to assess the appropriateness of installing a traffic signal due to pedestrian concerns at five locations. The goal of the effort was to include the possibility of any and all criteria as being part of the pedestrian signal warrant. Most of the responses, however, were focused on the MUTCD pedestrian signal warrant criteria and few variations resulted. The research team for this study suggested that these findings were the result of the current methodology being so ingrained in the profession’s signal warrant analysis activities rather than indicating that the current pedestrian signal warrant was appropriate. They also noted that the participants’ comments indicated a need for additional guidelines on pedestrian crossing treatments. 137
TCRP/NCHRP: Improving Pedestrian Safety at Unsignalized Crossings CURRENT EFFORT The Texas study provided interesting findings; however, there was a concern with only using engineers from one state. For the TCRP/NCHRP study, the timing and location of the 2004 Institute of Transportation Engineers (ITE) Spring Conference provided an opportunity to host a workshop on engineering judgment evaluations of pedestrian signal warrants that could include a more diverse geographic representation. The workshop was planned for March 28, 2004, in southern California. ITE worked with Texas Transportation Institute (TTI) to advertise the workshop to attendees of the ITE Spring Conference and to members of the Southern California Section of ITE. The workshop’s objective was to obtain opinions on the traffic signal warrants; on how they related to specific locations; and on potential treatments, including signalization, for the selected intersections. SITE SELECTION Several cities in southern California were contacted to identify potential sites. The cities were asked to suggest crossing locations that were midblock or at an intersection where (a) there have been requests by members of the public to install traffic signals based on pedestrian needs or (b) where there have been higher than average pedestrian collisions. Two cities, Santa Ana and Anaheim, provided several locations. These locations were visited by a member of the research team to determine their appropriateness for inclusion in the study. The sites needed to have sufficient pedestrian activity, needed to not currently have a traffic signal, and needed to be within a reasonable driving distance of the conference hotel. Four locations within each city were included in the workshop. After site selection, the following information was gathered at the eight sites: • • •
Roadway characteristics (e.g., number of lanes, distance to transit stop, etc.), Photographs of existing conditions, and Pedestrian and traffic data (hourly basis).
WORKSHOP The Signal Warrant Engineering Judgment Evaluation Workshop was held on March 28, 2004, just prior to the ITE Spring Meeting. Two tours were conducted as part of the workshop. In the first tour seven engineers participated, while six participated in the second workshop. Each tour included an engineer who was very familiar with the area and was able to answer questions regarding local practices. Of the 13 participants, the regional representation included: 9 west coast, 1 northwest, 1 east coast, and 2 midwest. Each participant was provided with traffic/pedestrian data, photographs, and a sketch for the eight pedestrian crossing locations. Figure I-1 shows examples of the photographs provided for Site 7. The traffic volumes were provided both in numeric format and plotted on a chart with the relevant curves for Signal Warrant 2 (4-hr vehicular volume) and Warrant 3 (peak hour). Figure I-2 illustrates the chart provided for Site 7. Tables were also provided listing the pedestrian volume (per hour and per street), intersection characteristics, and preliminary results
138
Appendix I: Suggested Issues to Consider from an analysis using the eight warrants. Table I-1 summarizes the data provided on intersection characteristics and results from warrant analysis for the eight sites.
Pedestrian Looking East from North Side
Southbound
Eastbound
Northbound Figure I-1. Photographs of Site 7.
500
Minor Road - High Volume Approach (vph)
450 400 350 300 250 200 150 100 50 0 0
200
400
600
800
1000
1200
1400
Major Road - Total of Both Approaches (vph) Data
Warrant 2
Warrant 3
Figure I-2. Warrant 2 and 3 Plot for Site 7.
139
1600
1800
TCRP/NCHRP: Improving Pedestrian Safety at Unsignalized Crossings The group then drove to each site and reviewed the site in the field. While in the field, the participants completed a questionnaire (see Figure I-3). After visiting the eight sites, the tour concluded at the original hotel with a 1-hr discussion. Items covered during the discussion included comments on specific sites along with general discussion on the pedestrian signal warrant. The participants were also asked to complete a general questionnaire on the pedestrian signal warrant (see Figure I-4). TABLE I-1. Intersection Characteristics and Warrant Analysis Results. Element Number of lanes on major Number of lanes on minor Critical speed of major road (posted speed limit, mph) Distance to the east of nearest signal (ft) Distance to the west of nearest signal (ft) Distance to cross street (crosswalk length) (ft) Calculated gap needed to cross street based on 4 fps + 3 sec startup time (sec) Calculated gap needed to cross street based on 3 fps + 3 sec startup time (sec) Number of crashes susceptible to correction in past 12 months School crosswalk? (Yes or No) Warrant Analysis Result* 1A, 8-hr vehicular volume 1B, 8-hr vehicular volume 1A&B (80%), 8-hr vehicular volume 2, 4-hr vehicular volume 3, peak hour 4, pedestrian volume 4, pedestrian volume (reduced due to slower walking speed) 5, school crossing 6, coordinated signal system 7, crash experience 8, roadway network *abbreviations: unk = unknown due to unavailable data NA = not applicable may = may meet warrant
Site 1 2 1
Site 2 2 1
Site 3 2 1
Site 4 2 1
Site 5 2 1
Site 6 2 1
Site 7 2 1
Site 8 2 1
30
35
35
45
40
35
35
35
1735 860
1300 1500
1450 1130
1600 950
1320 1320
1030 1600
650 475
1100 1500
75
64
66
74
92
64
71
56
22
19
20
22
26
19
21
17
28
24
25
28
34
24
27
22
0
2
0
1
unk
unk
unk
0
yes
yes
yes
yes
yes
yes
no
yes
no no no no no no
no no no no no no
no no no no no no
no no no no no no
no yes no yes yes no
no no no no no no
no no no no no may
no no no no no no
NA
NA
likely
NA
NA
yes
NA
NA
may may no no
no may no may
likely may no may
likely may no may
likely may unk may
likely may unk may
no may unk may
no may no no
140
Appendix I: Suggested Issues to Consider
TCRP/NCHRP: Improving Pedestrian Safety at Unsignalized Roadway Crossings Pedestrian Crossing Workshop, Site Reviews California, March 2004 Site:_______________________________ Reviewer:______________________________ Using the data provided, observations made during your site visit, and your expert opinion, do you think a traffic signal should be installed here (please disregard the warrant analysis results when making this decision)? Yes No Please provide the reasons and/or factors that influenced your decision.___________________ ____________________________________________________________________________ ____________________________________________________________________________ Attached are preliminary results from a signal warrant analysis. Do you agree with the results that a signal is (or is not) warranted based on the Pedestrian Traffic Signal Warrant? Yes No Do you agree with the results for the other warrants? Yes No Please explain why for the above two questions. What factors affected your decision? Should other factors be considered when working with the signal warrants?______________________
_____________________________________________________________________________ ____________________________________________________________________________ Is a form of less restrictive traffic control needed here? Yes No What traffic control devices would you suggest?______________________________________ ____________________________________________________________________________ ____________________________________________________________________________ Please provide the reasons and/or factors that influenced your decision on the less restrictive traffic control._________________________________________________________________ ____________________________________________________________________________ ____________________________________________________________________________ Other comments or observations on the site:_________________________________________ ____________________________________________________________________________ ____________________________________________________________________________
Figure I-3. Site Questionnaire.
141
TCRP/NCHRP: Improving Pedestrian Safety at Unsignalized Crossings
TCRP/NCHRP: Improving Pedestrian Safety at Unsignalized Roadway Crossings Pedestrian Crossing Workshop, Wrap-up Questions California, March 2004 Reviewer: ___________________________ Which factors played the biggest role in your treatment suggestions for the eight sites (select top three): Traffic Volume Pedestrian Volume Presence Of School Vehicle Gaps Available Average Crossing Speed Of Pedestrians (Assumed) Distance To Nearest Signal Intersection Vs. Midblock Speed (Operating Or Posted) On Major Number Of Lanes On Major Number Of Lanes On Minor Nearby Lane Uses Crash History Presence Of Median On Major Other: ________________________ Currently the MUTCD considers the following factors in the Pedestrian Signal Warrant: pedestrian volume, gaps, distance to nearest signal, and average crossing speed of pedestrian. What other factors do you think should be included in a revised signal warrant?____________________________________ Do you think the MUTCD should include warrants for less restrictive traffic control devices (i.e., warning flashers, in-pavement lights, etc.) at uncontrolled pedestrian crossings? Yes No What factors do you think should be included in a warrant or guidelines for other types of pedestrian treatments (e.g., in-roadway warning lights, etc.)? ____________________________________________ Should guidelines for less restrictive control reflect a percentage of the signal warrant criteria (e.g., consider in-roadway lights when ped volume is 50% of signal warrant)? Yes No What percent of the pedestrian signal warrant would you think appropriate for guidelines on when to install….: static signs and markings ____________ yellow flashing devices _____________ red flashing devices _____________ Approximately how many signals does your jurisdiction maintain? _______________________________ A suggestion has been made to revise the pedestrian volume in the pedestrian signal warrant from 190 ped/h in the peak hour to 75 ped/h (or 60 ped/h for any 4 hours). If the pedestrian signal warrant was modified to reflect lower pedestrian volumes, please give your best estimate of how many additional signals would likely be installed in your jurisdiction (number or percent):___________________________ Do you think this is too many? Yes No Please provide the reasons that influenced your above response.________________________________ If traffic signals could be installed based on your engineering judgment of pedestrian needs, as you have used during the site evaluations today, approximately how many additional signals would be installed in your jurisdiction? ______________________________________________________________________
Figure I-4. Wrap-Up Questionnaire.
142
Appendix I: Suggested Issues to Consider FINDINGS Site 1 Site 1 has four lanes on the major road and two lanes on the minor road. Major road volumes range between 200 and 700 veh/h. The minor road has less than 100 veh/h. The pedestrian volumes crossing the major street range between 10 and 75 ped/h. In the warrant analysis, only the school crossing warrant may be met at the site. None of the participants supported the consideration of a signal at this location. They emphasized the need to try other alternatives before installing a signal (crossing guard if not already used, flashing beacons that operate either on demand or only during school hours, narrowing crossing distance through curb extensions or median refuge, etc.) Site 2 Site 2 has four lanes on the major road and two lanes on the minor road. Major road volumes range between 700 and 1700 veh/h. The minor road has less than 100 veh/h. The pedestrian volumes crossing the major street range between 10 and 90 ped/h. In the warrant analysis, only the coordinated signal system or roadway network warrants may be met at the site. The two participants who felt a signal should be considered at this location focused on the large number of pedestrians in the morning peak hour, the traffic speed on the major roadway, the distance to the nearest signal (over 1300 ft [396 m]), and the observation that the crossing guard is frequently ignored. Other treatments suggested for this location include: narrowing roadway, median refuge, curb extensions, repainting of markings, and warning devices. Site 3 Site 3 has four lanes on the major road and two lanes on the minor road. Major road volumes range between 600 and 1600 veh/h. The minor road has less than 100 veh/h. The pedestrian volumes crossing the major street range between 0 and 130 ped/h. In the warrant analysis, the reduced pedestrian signal warrant was met, while the school crossing, coordinated signal system, or roadway network warrants may be met at the site. The four participants (31 percent) that supported a signal were influenced by the high pedestrian volumes (2 hours had over 80 ped/h), the high vehicle volumes (11 hours were over 600 veh/h on the major), the presence of a school, and the absence of pedestrian refuge. The participants that did not support a signal observed that the cross traffic was very low and that a crossing guard would be a better solution. Treatments suggested included flashing beacon or in-pavement warning lights with passive detection and median refuge. Site 4 Site 4 has four lanes on the major road and two lanes on the minor road. The major road speed limit is posted at 45 mph (72 km/h) and the width of the street to be crossed is 74 ft (23 m). Major road volumes range between 400 and 900 veh/h. The minor road has less than 100 veh/h. The pedestrian volume crossing the major street has 2 hours where the volume exceeds 50 ped/h and 3 hours where it exceeds 20 ped/h. In the warrant analysis, the school crossing, 143
TCRP/NCHRP: Improving Pedestrian Safety at Unsignalized Crossings coordinated signal system, or roadway network warrants may be met at the site. The four participants that supported a signal (31 percent) were influenced by the high pedestrian volumes (2 hours had about 80 ped/h), the presence of a school, the high major road vehicle speeds, and sight obstructions. The participants that did not support a signal observed that the heavy pedestrian use is limited to school hours and that a crossing guard or flashing beacons would be the better solution. Site 5 Site 5 has four lanes on the major road and two lanes on the minor road. The major road speed limit is posted at 40 mph (64 km/h) and the width of the street to be crossed is 92 ft (28 m). Major road volumes range between 1000 and 2000 veh/h. The minor road has between 50 and 140 veh/h. The pedestrian volume crossing the major street had 5 hours where it exceeds 20 ped/h. In the warrant analysis, the school crossing, coordinated signal system, or roadway network warrants may be met at the site. Warrants 1 (8-hr vehicular volume), 4 (4-hr vehicular volume), and 3 (peak hour) were met at the site. Most of the participants (85 percent) supported the consideration of a signal at this site. The two participants that did not support a signal felt that the pedestrian volumes were low compared to the major street vehicular volumes and that there is adequate warning and markings provided. The rest of the participants felt the high volumes (major road volumes over 1000 veh/h for each of 11 hours), high speeds (40 mph [64 km/h] posted speed limit), and difficult in crossing such a facility supports the consideration of a signal. One participant thought that the pedestrian numbers were low because “it is a scary intersection to cross.” Site 6 Site 6 has four lanes on the major road and two lanes on the minor road. Major road volumes range between 450 and 1350 veh/h while the minor road volume ranges between 80 and 160 veh/h. The pedestrian volume crossing the major street had 6 hours with more than 20 ped/h, 2 hours with more than 50 ped/h, and 1 hour with more than 100 ped/h. In the warrant analysis, the pedestrian signal warrant was met when the average walking speed was assumed to be less than 4 ft/s (1.22 m/s), while the school crossing, coordinated signal system, or roadway network warrants may be met at the site. The participants were about evenly split between supporting or not supporting a signal. Participants noted that the pattern of pedestrian volumes matched the school hours and therefore, less restrictive controls (e.g., crossing guard or on-demand flashers) should be used prior to a traffic signal. Others felt that the distance to the nearest signal, the presence of 10 to 20 ped/h (present even during nonpeak school hours), high speeds, and long crossing distance support the consideration of a signal. During the traditional school day, the morning and afternoon peaks have between 85 and 102 ped/h. One participant felt that even though the pedestrian signal warrant was not met when average walking speed was greater than 4 ft/s (1.22 m/s), a signal should be considered because the high volumes would result in a difficult crossing for the students.
144
Appendix I: Suggested Issues to Consider Site 7 Site 7 has four lanes on the major and two lanes on the minor. Major road volumes range between 850 and 1500 veh/h while the minor road volume ranges between 50 and 110 veh/h. The pedestrian volume crossing the major street had 10 hours with more than 100 ped/h. In the warrant analysis, the pedestrian signal warrant was met, while the coordinated signal system or roadway network warrants may be met at the site. A slight majority of the participants felt that a signal should be considered at this location due to the high number of pedestrians (over 120 ped/h for 10 hours). Others felt that sufficient gaps exist and that drivers are aware of the multiple pedestrian crossings in the area. Several noted that a refuge island should be installed to improve the condition for pedestrians and that if a signal is installed it needs to be coordinated with the nearby signals. Site 8 Site 8 has four lanes on the major road and two lanes on the minor road. Major road volumes range between 450 and 700 veh/h while the minor road volume ranges between 15 and 50 veh/h. The pedestrian volume crossing the major street had less than 10 ped/h. In the warrant analysis, none of the warrants were met. The low traffic and pedestrian volumes factored into the participants unanimously agreeing that a signal should not be considered at this location. Several participants noted that this location may be a candidate for a “road diet.” The four-lane undivided facility may perform better being restriped to include two through lanes, a two-way left-turn lane, and a pedestrian refuge area at the intersection. Follow-On Discussion After the participants visited the eight sites, they met to complete the surveys and to provide observations and discussion. When asked which factors played the biggest role in their treatment suggestions for the eight sites, they responded with the following (the percentage value shown in parentheses represent the number of responses divided by 13, for example, 12 of the 13 participants selected pedestrian volume): Pedestrian volume (92 percent), Traffic volume (77 percent), Speed (operating or posted) on major (46 percent), Number of lanes on major (23 percent), Other: opportunity for median refuge, crossing distance, other possible treatment (23 percent), Crash history (8 percent), Intersection versus midblock (8 percent), Distance to nearest signal (8 percent), and Vehicular gaps available (8 percent). The participants listed the following when asked what factors that are not currently included in the MUTCD should be considered in a pedestrian signal warrant (the MUTCD
145
TCRP/NCHRP: Improving Pedestrian Safety at Unsignalized Crossings currently includes pedestrian volume, gaps, distance to nearest signal, average crossing speed of pedestrian): Operating speed, Crossing distance/width of street , Presence of refuge islands, Sight distance (including the effects of on-street parking), Combination of pedestrian and vehicle volumes, perhaps with different level of criteria during non-peak school crossing times, and Crash history. Also explored during the discussion was whether the MUTCD should include warrants for less restrictive traffic control devices (e.g., warning flashers, in-pavement lights, etc.). Most of the participants said that the MUTCD should include warrants (8 of the 13 participants); however, they noted that the preference is to include “guidelines” rather than “warrants.” They would also like information on the effectiveness of the devices. When asked if the guidelines for less restrictive control reflect a percentage of the signal warrant criteria what should that percentage be, the participants responded with values between 25 and 75 percent. In other words, the participants felt that a yellow flashing beacon should be considered at about 50 percent of the volumes being used to warrant a traffic signal. For those responsible for a signal system, they were asked to estimate how many additional signals would be warranted if the peak hour in the pedestrian signal warrant was reduced from 190 to 75 ped/h. The estimates ranged from 2 to 20 percent. Five of the seven participants who have responsibility for a signal system indicated that they did not think this was too many additional signals. Reasons for their answers included: “we need to provide better pedestrian access on arterials,” “pedestrian safety should be just as important as vehicle safety,” and “not sure if warranting pedestrian signals with lower volumes will decrease or increase safety versus more warning devices that are passively activated (and that are cheaper).” CONCLUSIONS Research projects are periodically conducted to ensure that the traffic signal warrants reflect current operational and safety needs for the different user groups. In addition to researching operational and safety needs, periodic reviews of engineer’s judgment toward the traffic signal warrants (or toward proposed revisions to the traffic signal warrants) are needed. The Signal Warrant Engineering Judgment Evaluation Workshop was held on March 28, 2004, just prior to the ITE Spring Meeting. Two tours were conducted as part of the workshop. In the first tour seven engineers participated, while six participated in the second workshop. Of the 13 participants, the regional representation included: 9 west coast, 1 northwest, 1 east coast, and 2 midwest. Observations from the Workshop include the following: The revised pedestrian signal warrant should include consideration of the width of roadway being crossed. The width could either be number of lanes or width of roadway; however, if number of lanes is being used, then a method to factor in the presence of bike lanes, parking lanes, and/or center turn lane needs to be included
146
Appendix I: Suggested Issues to Consider (since all represent extra distance that a pedestrian must consider and cross). The judgment decision and gap determination become more difficult when a pedestrian is crossing a wider street. The pedestrian signal warrant needs to consider the number of vehicles on the roadway along with the number of pedestrians. When there are many pedestrians and few cars, the pedestrians can “control” the crossing by becoming a steady stream of pedestrians with insufficient gaps for vehicles to enter (example given was at a site where there was heavy pedestrian movement between a parking garage and a municipal building in the morning and afternoon). In this situation, a signal is not needed for the pedestrian (although one participant noted that a signal may be needed for the vehicles – i.e., the signal needs to stop the pedestrians to allow the cars to move through the crossing). The comments from the participants indicated a preference to having the vehicle data expressed in number of vehicles rather than gaps. The revised warrant should consider the operating or posted speed on the major roadway. Several participants made comments with respect to equally treating pedestrians and vehicles. One participant noted a safety concern with crosswalks on streets with four or more lanes. These crosswalks have the potential for a “multiple-threat” conflict, where a pedestrian begins to cross in front of a vehicle that is stopped in the near lane, but has to avoid a vehicle in a subsequent lane that has not stopped. The participant advocated a different set of criteria for pedestrian signals on multilane streets. The participants considered the following factors during the evaluation of the eight intersections: o Pedestrian volume (92 percent), o Traffic volume (77 percent), o Speed (operating or posted) on major (46 percent), o Number of lanes on major (23 percent), o Other: opportunity for median refuge, crossing distance, other possible treatment (23 percent), o Crash history (8 percent), o Intersection versus midblock (8 percent), o Distance to nearest signal (8 percent), and o Vehicular gaps available (8 percent). When asked what other factors should be included in the MUTCD that are not currently present the only factor they listed that was not listed as being used in the evaluation of the eight sites (see previous bullet) was sight distance. There were several comments at individual sites where the adequacy of the available site distance was questionable, especially when on-street parking was present.
147
TCRP/NCHRP: Improving Pedestrian Safety at Unsignalized Crossings
APPENDIX J SURVEY OF PROVIDERS METHODOLOGY Several survey techniques were used to obtain information on pedestrian treatments and on the challenges of identifying and providing pedestrian treatments. These techniques included the following: Focus groups of providers, Phone meetings with providers, On-site interviews, and Focus group of bus drivers. Typical questions used for the focus groups of the providers and the on-site interviews are listed in Table J-1. Following is a summary of the methods used and the findings by survey. FOCUS GROUPS OF PROVIDERS The research team conducted two focus group sessions to discuss intersection and midblock treatment preferences. The focus group sessions occurred in Ft. Lauderdale, Florida, prior to the ITE Spring Meeting, which allowed participants from a range of geographical locations to be present. An initial invitation was distributed to all ITE members who were members of the Traffic Engineering, Transit, or the Pedestrian & Bicycle Council in early February 2003. A supplemental invitation was distributed in March 2003 to those ITE members who were local (i.e., are more likely to attend because the driving time is minimal) and work for a transit agency, city, or county but had not already received an invitation. We wanted to add a few more participants so that we would have a higher percentage of local government representation during the focus group sessions. The two focus groups were held on March 23, 2003, in Ft. Lauderdale, Florida. One was from 4 to 6 p.m. and the other from 7 to 9 p.m. The 4 to 6 p.m. focus group included six in attendance plus the two research team members, while the 7 to 9 p.m. focus group included eight participants along with the two research team members. Participant’s employer types are listed in Table J-2, with local government having the greatest representation of the groups (8 of 14 members had worked for a local government). The homes of the participants ranged from Florida to Washington D.C. to the west coast with nine being from the east coast, one from a central state, and four from the west coast. Their work experience with pedestrian treatments ranged from 10 to 40 years. Two of the participants were blind and provided insight into pedestrian treatments from the point of view of not being able to see them.
148
Appendix J: Survey of Providers TABLE J-1. Typical Questions Used in Focus Groups of Providers and On-Site Interviews. Treatments Used at Unsignalized Intersections • What is your preferred pedestrian treatment(s) for unsignalized intersections? Do you consider it very effective? If so, by what criteria? Are the treatments well liked? Other reasons for using it? • What other treatments have you used at unsignalized? Are they effective? What is limiting their use? • How do you decide which treatment to use at a crossing? Treatments Used at Midblock Locations • What is your preferred pedestrian treatment(s) for midblock locations? Do you consider it very effective? Well liked? Other reasons for using it? • What other treatments have you used at midblock locations? Are they effective? Are they costly? What is limiting their use? • How do you decide which treatment to use at a crossing? • Are your decisions affected by the presence of a bus stop? Program for Pedestrian Treatments • When do you consider installing a pedestrian crossing treatment at an unsignalized intersection? (complaints, ADT, existing crosswalk, crashes, etc.) • What studies or research are used to determine the type of pedestrian treatment? (speed, vehicle volume, pedestrian volume, neighboring developments, type of pedestrian [old, young, disabled]) • Who do you typically work with when addressing a pedestrian concern (residents, businesses, transit agencies, planners, community economic development, Public Works, other professionals, etc.) Signals at Midblock Locations • What are your thoughts regarding the use of signals at midblock crossings? • When are they appropriate (or not appropriate)? • Do you use supplemental signing for a midblock crossing? • When should midblock signals be considered? • What other treatments are typically considered or used before using a midblock signal? Signal Warrants • Do you have specific concerns regarding the pedestrian warrants? (e.g., ped volumes too high, gap criteria too difficult to measure, no regard for vehicle speed or roadway classification, no regard for safety, etc.) • What criteria do you think should be addressed in a signal warrant that considers pedestrians? (e.g., gaps, pedestrian volume, vehicle speed, vehicle volume, etc.) • Should the criteria used in a signal warrant that consider pedestrian also include a reduction factors for when speeds are in excess of 40 mph (64 km/h)? Are there other conditions where a reduction factor should be considered? • What if the traditional “vehicular-based volume” signal warrants, which are clearly designed for unsignalized intersections, included both pedestrians and bicyclists in the minor street approach count? (There is a new statement in the manual that allows bicyclists to be counted.) This minor change to the signal warrants would cover the unsignalized intersections and allow for the pedestrian warrant to focus exclusively at midblock locations. • Should a new pedestrian signal warrant consider a presence of a bus stop? If so, how should the bus stop be considered (presence, distance to nearest existing crossing, pedestrian volumes in peak periods, etc.)
149
TCRP/NCHRP: Improving Pedestrian Safety at Unsignalized Crossings TABLE J-2. Focus Group Participants. Number of Participants 1 5 3 4 1 14
Employer State Local Government Mix of Local Government and Consultant Experience Consultant Federal Agency Total Participants
A pre-survey was distributed to the participants as they entered the room. This provided an opportunity for the participants to begin thinking of the issues that would be discussed and to provide the research team with the full name and address of the participant. A question on the survey requested the participant’s preference for treatments at unsignalized intersections and at midblock crossings. The participants could check more than one treatment. Their responses are shown in Figures J-1 and J-2 for unsignalized and midblock crossings, respectively. Refuge islands and high-visibility markings received the highest preference with over 70 percent. Roadway pedestrian signing also received over 70 percent for midblock location only.
None Refuge island with pedestrain railings Roving eyes Flags Street lighting Pavement markings/ legends Treatments
In-street pedestrain crossing sign Flashing beacons (only when pedestrian is detected) Other Roadway pedestrian signing Overhead signs In-roadway warning lights Curb extensions Advance placement of stop or yield lines Flashing beacons (continuous) Refuge islands High visibility markings 0%
10%
20%
30%
40%
50%
60%
70%
80%
90%
Preference
Figure J-1. Preference of Focus Group Participants for Pedestrian Crossing Treatments at Unsignalized Intersections.
150
Appendix J: Survey of Providers
Roving eyes Refuge island with pedestrain railings None In-street pedestrian crossing signs Flags Pavement markings/ legends
Treatments
In-roadway warning lights Flashing beacons (only when pedestrian is detected) Advance placement of stop or yield lines Other Street lighting Overhead signs Flashing beacons (continuous) Curb extensions Refuge islands High visibility markings Roadway pedestrian signing 0%
10%
20%
30%
40%
50%
60%
70%
80%
90%
Preference
Figure J-2. Preference of Focus Group Participants for Pedestrian Crossing Treatments at Midblock Locations. Key Findings The questions developed for use in the focus group are listed in Table J-1. The questions actually used depended upon how the discussions proceeded during the focus group. If the group had greater interest in discussing treatments as opposed to signal warrants, then greater time was spent on the treatment questions. Following are the key findings from the focus groups by major discussion area. Treatments Used at Unsignalized Intersections Several treatments were mentioned including high-visibility markings, bulb outs, refuge islands, and others. Participants indicated the following: o Continuous flashing beacons have less than desired impact on driver behavior. o Pedestrians have a reluctance to use the pedestrian flags; however, they are an unusual treatment which is positive. o Should the profession consider a sign that says “flashing when pedestrian is present” to indicate that the flashing beacon is only active due the presence of a pedestrian? o Landscaping or other guidance strips could help direct the pedestrian across the curb extension. Participant noted that pyramids or large pebbles embedded in the concrete are used in Europe. The blind pedestrian needs guidance on when a treatment is activated (e.g., lights at an in-roadway warning light installation). Valuable crossing time is lost when the pedestrian is trying to determine if the treatment is active. A tone would also help 151
TCRP/NCHRP: Improving Pedestrian Safety at Unsignalized Crossings inattentive sighted pedestrians know when the treatment is activated. Blind pedestrians also need a location device to know where to activate the treatment. Several participants commented on the in-street pedestrian crossing signs. This is a relatively new treatment that has caught the attention of several communities. There is a desire to know more about their effectiveness. One participant felt they are more effective with a regulatory message than a warning message. Concerns were expressed over whether pedestrians would trip over the sign. Treatments Used at Midblock Locations Characteristics of a preferred midblock crossing include: median refuge area if on a multilane facility (especially when high speeds or high volumes are present), curb extensions, and advance warning system that is activated by a pedestrian. Another treatment mentioned for midblock crossings was the in-roadway warning lights. For blind users, an indication that the crossing is present is really important. One suggestion is to use changes in pavement surface to indicate the presence of a midblock crossing. Corners are not available to assist in locating the crossing. Bus stops have been considered in selecting a treatment at a midblock location; however, it was noted that it should be one of several factors to be considered. Other factors include intersection spacing, land use (that creates the demand), pedestrian characteristics (e.g., senior citizens), schools, churches, presence of sidewalks, and distance of generator to next signalized intersection. Program for Pedestrian Treatments Issues considered when selecting pedestrian treatments include: roadway volumes (major versus minor street), turning movement volumes, pedestrian characteristics at the site, available right-of-way, and crashes. Signals at Midblock Locations The profession needs to investigate techniques that minimize delay to motorists while giving pedestrians access to cross the street so as to minimize the impacts of signals at midblock locations. Need a quick response to the pedestrian activation to encourage its use. Consider two-stage crossing so that a midblock signal can be split and coordinated with upstream signals. Preference is to use supplemental signing at a midblock crossing. The sign, however, can block the view of the pedestrian, so placement is critical. Consider using an activated device because a sign is frequently ignored by drivers. Good to have signs that remind the motorists that they need to yield to pedestrians in crosswalks. Treatments used prior to installing a midblock signal include: pedestrian flags, inroadway warning lights, advance warning, pavement markings, curb extension, and lighting.
152
Appendix J: Survey of Providers Signal Warrants The participants felt that the signal warrant is too geared to vehicles and that it only considers existing pedestrians and not what could be present if a signal was installed. The warrant should include reduction factors for operating speed on roadway, absence of median, and number of lanes. Several participants noted that the warrant should consider nearby pedestrian generators (which could include a bus stop). One participant noted that the system warrant was used to justify signals to achieve a 28 mph (45 km/h) operating speed. This resulted in platoons along the corridor that made it easier for pedestrians to cross at other locations. Suggestions for improvement include the following: o consideration of land use (type of generator), o consideration of sidewalk network and is it a key bike/pedestrian link, o characteristics of pedestrians (number of older, very young, disabled, and blind users), o geometrics at the site (number of lanes, presence of median), o proximity of other crossings, and o sensitivity to the type of signal technology that would be used (if the device will have minimal impact on operations, then it should be easier to warrant). PHONE MEETINGS Several agencies were contacted early in the project to identify potential pedestrian treatments and to identify which regions should be visited as part of the on-site interviews. These contacts also provided insight into how treatments are selected. Table J-3 lists the agencies contacted by phone. TABLE J-3. Cities and Agencies Contacted. Atlanta, GA Austin, TX Bellevue, WA College Station, TX Dallas, TX FHWA Florida DOT Irving, TX Kirkland, WA Lane Transit District (Eugene, OR) Las Vegas, NV Los Angeles, CA Montgomery County, MD Portland, OR
Cities or Agencies Redmond, WA Salem, OR Salt Lake City, UT San Antonio, TX Metropolitan Planning Organization San Diego, CA San Francisco, CA San Jose, CA Seattle, WA Spokane, WA MPO Texas DOT TriMet Transit (Portland, OR) Tucson, AZ Vancouver, WA Washington State DOT
ON-SITE INTERVIEWS On-site interviews were conducted in several cities. During those interviews the research team met with numerous city and state transportation departments and transit agencies on their 153
TCRP/NCHRP: Improving Pedestrian Safety at Unsignalized Crossings practices regarding pedestrian crossing treatments, use of traffic signal warrants, and transit stop provisions along major arterial streets. Table J-4 lists the agencies that were involved in these interviews. Table J-1 contains the list of questions that were used to guide the discussions with these agency representatives. In addition to the meetings, the research team visited sites with pedestrian treatments. Following is a brief overview on pedestrian treatments observed during some of the site visits and general comments made during the interviews. TABLE J-4. Agency Interviews. Date and Location of Interview March 12, 2003 Salt Lake City, Utah April 7, 2003 Tucson, Arizona April 8, 2003 Phoenix, Arizona
April 9, 2003 Santa Monica, California April 10, 2003 Los Angeles, California June 2, 2003 Seattle area and Olympia, Washington June 3, 2003 Seattle, Washington June 4, 2003 Kirkland, Washington
Agency City of Salt Lake, Utah
Representatives Dan Bergenthal, P.E.
City of Tucson, Arizona
Richard Nassi, Ph.D., P.E. Shellie Ginn George Caria Michael Cynecki, P.E. Thomas Godbee, P.E. Ron Robinson Chuck Italiano
Sun Tran City of Phoenix, Arizona – Street Transportation Dept. City of Phoenix, Arizona – Public Transit Dept. City of Santa Monica, California City of Los Angeles, California Washington State DOT City of University Place, Washington City of Olympia, Washington City of Seattle, Washington King County METRO City of Kirkland, Washington City of Bellevue, Washington City of Redmond, Washington
June 5, 2003 Portland, Oregon
City of Portland, Oregon Oregon DOT
Lucy Dyke, P.E. Beth Rolandson Wayne Tanda, P.E. John Fisher, P.E. Julie Mercer-Matlick Paula Reeves Pat O’Neill, P.E. Randy Wesselman, P.E. Robert Spillar, P.E. Brian Kemper, P.E. Megan Hoyt Ross Hudson David Godfrey, P.E. Mark Poch, P.E., P.T.O.E. Kurt Latt, P.E., P.T.O.E. Jeff Palmer, P.E. Susan Byszeski Bill Kloos, P.E. Jamie Jeffreys, P.E. Jean Senechal, A.S.L.A. Basil Christopher, P.E.
Portland, Oregon Typical treatments used in Portland include intersection pedestrian signals (also known as half-signals) and pedestrian median refuge islands. Other treatments that have been installed are in-roadway warning lights and overhead or side beacons activated by passive detection. Figure J3a is an example of a pedestrian signal with advance stop bar and STOP HERE ON RED sign. Figure J-3b is an example of a pedestrian median refuge island, and Figure J-3c is an example of an intersection pedestrian signal (half-signal). Comments made during the meeting with agency representatives are:
154
Appendix J: Survey of Providers Intersection pedestrian signals (half-signals) were installed many years previously (over 15 years); however, have not installed any recently. Suggested that if the intersection pedestrian signals were to be installed elsewhere to use them where there are light traffic volumes on the side street and there is a reasonable distance to a signalized intersection. Benefits of intersection pedestrian signals include that they do not attract additional side street volume since the control on the side street is a STOP sign rather than a signal indication. Oregon will now have a law which requires drivers to stop and remain stopped until the pedestrian either reaches the other side of the street or is at least one lane away from the car in a multilane street. The bill was signed into law on June 17, 2003, and goes into effect January 1, 2004.
(a) Pedestrian Signal with Advance Stop Bar
(b) Pedestrian Median Refuge Island
(c) (Half-Signal) Figure J-3. Examples of Treatments in Portland. Kirkland, Washington Typical treatments used in Kirkland include pedestrian flags and pedestrian median refuge islands. Other treatments that have been installed are in-roadway warning lights and midblock pedestrian signals. Figure J-4a is an example of the instructions for the flag treatment (see Figure J-4b). Figure J-4c is an example of pedestrian median refuge island. Comments made during the meeting with agency representatives are:
155
TCRP/NCHRP: Improving Pedestrian Safety at Unsignalized Crossings Pedestrian median refuge islands are important as a first step for sites needing a pedestrian treatment (along with median curb extensions). They have had positive experience with pedestrian flags and have them at about 20 locations in the city. The city maintains those in the downtown area and is willing to install in other locations if the community is willing to restock the flags as needed. Many pedestrians like the in-pavement warning lights; however, complaints about drivers not stopping for the pedestrians are still received.
(a) Instructions for Pedestrian Flags
(b) Pedestrian Flags and Crossing Signs
(c) Overhead Signs, Pedestrian Refuge Island at Marked Crosswalk Figure J-4. Example of Treatments in Kirkland.
156
Appendix J: Survey of Providers Redmond, Washington Typical treatments used in Redmond include in-street pedestrian crossing signs, which are being evaluated at nine locations. Other treatments that have been installed are in-roadway warning lights, midblock pedestrian signal (recent installation at Microsoft), and intersection pedestrian signals. Figure J-5a is an example of a midblock pedestrian signal, and Figure J-5b is an example of a marked crossing where in-roadway warning lights will be installed. Figure J-5c and J-5d are examples of crossing signals; Figure J-5c is an in-street pedestrian crossing sign, and Figure J-5d is a roadside pedestrian crossing sign. Comments made during the meeting with agency representatives are: General comment Have proposed criteria for (a) in-roadway warning lights at crosswalks and (b) signals. In-street pedestrian crossing signs Are currently 6 months into a 12-month evaluation. Started with 14 sites; about 9 sites are currently in the study (lost some due to construction trucks). Installed on sites with three travel lanes or less and speeds of 30 mph (48 km/h) or less. Acceptance by drivers is increasing with familiarity with the signs.
(a) New Midblock Pedestrian Signal at Microsoft
(b) Marked Crosswalk
(c) In-Street Pedestrian Crossing Sign (d) Pedestrian Crossing Sign Figure J-5. Examples of Treatments in Redmond. 157
TCRP/NCHRP: Improving Pedestrian Safety at Unsignalized Crossings Bellveue, Washington Typical treatments used in Bellveue include pedestrian median refuge island at midblock crossings, overhead signing, lighting at crosswalk, and variable speed limit in school zones. Other treatments that have been installed are in-roadway warning lights, midblock pedestrian signals, and a split midblock pedestrian signal treatment. Figure J-6a is an example of a split midblock pedestrian signal, and Figure J-6b is an example of an overhead sign and median pedestrian refuge island at a marked crosswalk. Comments made during the meeting with agency representatives are: Had questions on using bulb outs with bike lanes. Will be using the advance stop bar because of concerns with multiple-threat problem. Encourage the location of bus stop at signals.
(a) Split Midblock Pedestrian Signal
(b) Overhead Sign and Pedestrian Median Refuge Island at a Marked Crosswalk Figure J-6. Examples of Treatments in Bellevue.
Seattle, Washington Typical treatments used in Seattle include intersection pedestrian signals (about 70 locations) and median pedestrian refuge islands. Other treatments that have been installed are inroadway warning lights and overhead crosswalk signs with flashers. Figure J-7 is an example of an intersection pedestrian signal. Comments made during the meeting with agency representatives follow: General comments Seattle has intersection pedestrian signal (commonly called half-signals) criteria which state that pedestrian volumes can be increased if information indicates that an immediate increase in actual pedestrian volume can be anticipated due to the installation of the treatment. They recently conducted an inventory of their crosswalks. Will be reviewing by corridor and will consider school, bus stop, major generator locations, etc., when deciding whether to remove, consolidate, or install marked crossings. 158
Appendix J: Survey of Providers City is focused on providing a pedestrian-friendly environment that includes traffic calming, sidewalks, etc., that is also balanced with traffic needs. Encourage enforcement and education to take place before increasing the level of control at a location. Sometimes the concern can be addressed with additional enforcement or education. Intersection Pedestrian Signal (Half-Signal) In-house data on intersection pedestrian signals show that they provide a safety benefit to both pedestrians and motorists. At the intersection pedestrian signal, the stop bar is 40 ft (12.2 m) from the crosswalk. Only one crosswalk across the major road is marked. The signal dwells in green, then goes to yellow, and then red. Usually gives 6 to 7 seconds of walk and then clearance based on walking speed and width.
Figure J-7. Example of an Intersection Pedestrian Signal in Seattle. Los Angeles, California Typical treatments used in Los Angeles include Smart Pedestrian Warnings and midblock pedestrian signals. Another treatment used in the area is to have trained staff available for traffic control at special events. Figure J-8a is an example of midblock pedestrian signal, H-8b is an example of a Smart Pedestrian Warning treatment, and H-8c is an example of the use of the yellow color for crosswalks near a school. Comments made during the meeting with agency representatives include: General comments Have criteria for: marking crosswalks, Smart Pedestrian Warnings, signals at intersections, and signals at midblock. Have educational program for school children. Attempt to visit each school every other year to educate how to get to school safely. Pavement markings for crossings near schools (within 600 ft [183 m]) are yellow. A pedestrian advisory group provides input on the selection of pedestrian treatments. Pedestrian safety is not just engineering, it also needs education and enforcement. Will be developing an education campaign on pedestrian safety. 159
TCRP/NCHRP: Improving Pedestrian Safety at Unsignalized Crossings Smart Pedestrian Warnings Is used as a measure when more control is needed, and the site does not meet signal warrant. Selection of sites is based on a point system developed by the city. Developed in 1998 and have installed about 15 to date. Midblock Pedestrian Signals Dwell in green arrow, are pedestrian activated (push button), and can be coordinated with other signals.
(b) Smart Pedestrian Warning
(a) Midblock Pedestrian Signal
(c) Marked Crosswalk near a School Figure J-8. Examples of Treatments in Los Angeles.
160
Appendix J: Survey of Providers Phoenix, Arizona A typical treatment used in Phoenix is the fluorescent yellow-green color at school crossings. Other treatments that have been installed are flashers and rumble strips. Figure J-9 is an example of flashers and fluorescent yellow-green at school crossings. Comments made during the meeting with agency representatives include: A major change for the city is light rail (start construction in 2004 and start service in 2006). Pedestrians will cross at signalized intersections (located every 0.25 mi [0.4 km] outside of downtown, every block in downtown). Signals will have a countdown indication.
Figure J-9. Example of Treatments Used near a Phoenix School. Tucson, Arizona Typical treatments used in Tucson include the HAWK and the split midblock pedestrian signal. These treatments frequently include countdown signal indications. Figure J-10a and J-10b are examples of instructions, while Figure J-10c and J-10d are examples of the HAWK treatment. Comments made during the meeting with agency representatives are: General comments Mobility expert groups provide the city input on pedestrian treatments. Citizens are asking for midblock median cuts at unmarked crossings. Are using pedestrian median refuge islands to decrease crossing exposure at large intersections. HAWK Have installed about 15 to 20 HAWKs. Usually not installed within 0.25 mi (0.4 km) of another signal. Transit spacing is also at 0.25 mi (0.4 km). 161
TCRP/NCHRP: Improving Pedestrian Safety at Unsignalized Crossings Are educating drivers about the difference between solid red (stop) and flashing red (stop and go). Are changing the display over time to address concerns.
(a) Sign use at a HAWK Crossing
(b) Instruction Sign at a Crossing
(d) HAWK (c) HAWK Figure J-10. Examples of Treatments in Tucson.
FOCUS GROUP OF BUS DRIVERS In order to obtain transit driver opinions on the behavior of transit patrons as they approach or walk away from the transit vehicle, TTI researchers conducted a discussion group with Sun Tran transit driver personnel in Tucson, Arizona. The discussion group was held on Wednesday, May 21, 2003, at the Sun Tran Station and lasted approximately 1 hour.
162
Appendix J: Survey of Providers Methodology The discussion group consisted of five sections: (a) Pre-discussion group survey, (b) Introductions, (c) Pedestrian hazards, (d) Handicapped pedestrian hazards, and (e) Closing suggestions. Pre-Discussion Group Survey To obtain background information and to help stimulate the group’s thinking on transit patron behaviors, a short survey was distributed as the participants arrived and was completed before the discussion group began. Table J-5 contains a summary of the survey responses. TABLE J-5. Participant Information. Part. # 1 2 3 4 5
Years Driving Motor Vehicle 45 27 42 30 38
Pedestrian Walks Inappropriately
Bus
in Front of Bus
Behind Bus
6 8 4 11 14
Always Very often Fairly often Always Fairly often
Very often Very often Fairly often Very often Fairly often
Percent of Pedestrians That Do Not Use Enough Caution Approaching Walking away from Bus Bus 26-50 51-75 26-50 26-50 26-50 51-75 51-75 26-50 26-50 26-50
Table J-5 shows that there were five Sun Tran transit drivers that attended the discussion group. The time that they have been driving a bus varied from 6 to 14 years. When asked how often did pedestrians inappropriately walk in front of or behind their transit vehicle each day, two individuals felt that they “always” walked in front of their transit vehicle inappropriately and “very often” walked inappropriately behind their transit vehicle. The remaining three members of the group found no difference between those pedestrians that walk in the front or behind the transit vehicle inappropriately (one responding “very often” and two “fairly often”) for either situation. Introductions Introductions were made to build rapport, establish the sense of a group, and to help the group to focus on the topic. With this in mind, the moderator asked each participant to state their first name and share with the group the number one hazard (or closest call) they had experienced with pedestrians while driving a transit vehicle. All of the participants in the group had experienced a hazard (or close call) with pedestrians walking in front of their transit vehicle while driving. Two members of the group explained that their incident was caused when a pedestrian forgot his/her bike on the transit vehicle rack and jumped in front of the transit vehicle to retrieve it as the transit vehicle was pulling away. The remaining three participants had close calls when a pedestrian suddenly darted in front of the transit vehicle from their blind side (the driver’s left side).
163
TCRP/NCHRP: Improving Pedestrian Safety at Unsignalized Crossings As a follow-up question the group was then asked “Do any of you have any suggestions that would improve the safety for any of the hazards mentioned?” The following responses were made: Give the public free seminars on how to ride a transit vehicle safely. Remind the patron that the bike belongs to them and is therefore their responsibility in loading and unloading from the transit vehicle. Place a sticker on the front of the transit vehicle near the transit vehicle rack reminding passengers to inform the transit driver that they have a bike on the transit vehicle rack. Questions Based on the initial one-on-one survey responses that were collected in Texas and Florida, questions were developed for use during the discussion group. These questions are as following: Pedestrian Hazards “Question 1. What is the most significant safety problem you have observed with pedestrians as they are approaching or walking away from the bus? How do you handle the situation? Question 2. Do you have any suggestions on how to solve the problems you have observed? Question 3. Do you feel like any of these problems could be solved by different pedestrian crossing designs? If so, explain. Question 4. Have you observed any significant difference in pedestrian behaviors at signalized vs. unsignalized crossing areas? Explain.” Disabled Pedestrian Hazards “Question 1. What is the most significant safety problem you have observed with handicapped pedestrians as they are approaching or walking away from the bus? How do you handle the situation? Question 2. Do you have any suggestions on how to solve the problems you have observed with handicapped pedestrians? Question 3. Do you feel like any of these problems could be solved by different pedestrian crossing designs for handicapped people? If so, explain.”
164
Appendix J: Survey of Providers Closing Suggestions A closing question was asked to allow the participants to make any type of recommendation and/or suggestion regarding the safety of pedestrians at unsignalized intersection. The closing question asked was “Question 1. Are there any suggestions or recommendations you would like to make regarding pedestrian safety at unsignalized intersections?” Summary of Responses The following is a summary of the responses to the above questions. Pedestrian Hazards The most significant safety problem identified was pedestrians crossing in front of the transit vehicle. Several drivers noted that it was a problem when the pedestrian stands off the curb or so close to the club that the driver has to stop short in order not to hit them with the transit vehicle’s fender or mirrors. The group felt that education would not help in stopping inappropriate pedestrian behavior. All of the drivers agreed that there were too many different types of crosswalk treatment designs. Several suggested using a typical traffic signal configuration (red, yellow, and green) with no flashing as the pedestrian crossing treatment design. Most of the participants reported that motorists are confused by the flashing red lights at pedestrian crossings. They think the lights mean caution and do not realize they are supposed to stop. One member felt that some drivers understand the signals, but just aren’t obeying. One member reported that there were too many crosswalks in general. When asked if moving the transit stop location would improve pedestrian safety, most didn’t feel it would help. The group did suggest that the transit stops should be located after the intersection, where pedestrians tend to walk behind instead of in front of the transit vehicle. All drivers agreed that pedestrians use more caution at signalized crossing areas than nonsignalized crossings. The group felt that law enforcement needs to start ticketing pedestrians when they cross against an indicated “DON’T WALK” signal and/or jaywalk. Disabled Pedestrian Hazards All members of the group remarked that there is a problem with individuals in wheelchairs riding in the bike lane and in the street. This makes it hard for transit vehicles that have to make a stop using only the curb lane. It was the perception of the group that there were not many problems with handicapped pedestrians and felt they conducted themselves better than the nonhandicapped patrons. 165
TCRP/NCHRP: Improving Pedestrian Safety at Unsignalized Crossings When asked if they had any problems with the visually impaired, the group reported that they were probably better informed than most passengers. There were no suggestions on how to solve any of the problems identified by the group. When asked their opinion on the audible crosswalk signals. All agreed that they have helped the hearing impaired. When asked if these problems could be solved by different pedestrian crossing designs for handicapped transit patrons, it was suggested that a national standard for pedestrian crossing signals should be developed. The group reported that several seniors complain that the crosswalk signals are not long enough for them to make it completely across the street. When asked “How do you feel about the split midblock pedestrian signal treatment” the responses were as follows: One member stated he liked the split midblock pedestrian signal treatment; however, two other members of the group complained that many drivers run that particular light, the drivers stop when it turns red and drive right through the light when it is flashing (it is supposed to be treated as a stop sign). One transit driver stated that he felt it was a good crosswalk treatment; it slows the pedestrian down for a moment as they maneuver through the median. They get their bearing in the median and they have a chance to check the traffic on the far side. At the Oracle Street location, the crosswalk is in front of where you get off the transit vehicle. Felt it was better when a crosswalk is located upstream of the transit stop so the pedestrian crosses behind the transit vehicle. Closing Suggestions In closing, the group members were asked if they had any suggestions or recommendations they would like to make regarding pedestrian safety at unsignalized intersections. The following were their responses: All agreed that the crosswalks should always be located upstream of the transit stop. All agreed there should not be a transit stop at an intersection with a STOP sign because the transit vehicle will obstruct the view of motorists; vehicles in other lanes do not see the STOP sign and could end up hitting a pedestrian crossing in front of the transit vehicle. There should be a national standard for pedestrian crossing treatments. Individuals in wheelchairs should be ticketed for riding along the road or bike path. Transit stops should be located after an intersection. This eliminates the problem of vehicles turning onto a side street and not realizing the transit vehicle is about to move away from the curb. These turning vehicles can inadvertently cut in front of the transit vehicle.
166
Appendix J: Survey of Providers Key Findings from Bus Driver Focus Group The following points summarize the main recommendations and suggestions that were gained through the dialog with the transit drivers: The number one safety concern reported by the transit drivers was pedestrians walking in front of the transit vehicles; however, they did not feel that education will improve this type of behavior. The group suggested having law enforcement officers start ticketing pedestrians to improve these problems. In regard to the pedestrian and handicap hazards, it was the consensus of the group that there needed to be a uniform type of crosswalk treatment nationally; this would eliminate a lot of confusion on the part of pedestrians in understanding the different types of crosswalk treatments being used. With regard to handicapped pedestrians, the group felt that in general the handicapped were better informed and used more caution than nonhandicapped pedestrians. However, the transit drivers did agree there was a hazard created by individuals in wheelchairs riding in the street, and some pedestrian crossing signals were not long enough for older and handicapped pedestrians. The group all felt that crosswalks should be located upstream of the transit stop.
167
TCRP/NCHRP: Improved Pedestrian Crossings at Unsignalized Locations
APPENDIX K ON-STREET PEDESTRIAN SURVEYS On-street pedestrian surveys were used to obtain the perspectives of pedestrians in regard to their experiences and needs at pedestrian crossing locations. A large sampling of crossing sites was identified from phone interviews and on-site visits. Seven sites with five different treatments were ultimately selected for study. Sites were selected based on pedestrian traffic volumes, pedestrian crossing treatment, and roadway characteristics. The selected sites reflected a wide range of crossing treatments in order to obtain greater perspective of pedestrian experiences. The five treatments included in the study were two marked crosswalk treatments, an inroadway warning light treatment, a HAWK treatment, two split midblock signal treatments, and a countdown pedestrian signal treatment at a signalized intersection. Table K-1 lists the selected sites, where they were located, and a summary of key characteristics of each site. SURVEY DESIGN The on-street pedestrian survey was divided into three different sections. The first section was to obtain pedestrians’ opinions of the crossing treatment. The second section asked general questions for demographic purposes only. The questions used were: Section 1 1. On a scale of 1 to 5 (with 1 being very safe and 5 not safe) how safe did you feel crossing this street? 2. Is there anything at this street crossing that was confusing or that you had a hard time understanding? If yes, explain. 3. What is the maximum amount of time a person should have to wait to cross this street?