Muhammad Tahir, Int. J. Eco. Res., 2013, v4i1, 1-7
ISSN: 2229-6158
IMPORT OPENNESS AND ECONOMIC GROWTH?: CROSSSECTIONAL EVIDENCE FROM OECD
Muhammad Tahir (PhD Candidate) Muhammad Tahir (PhD Candidate) Faculty of Business, Economics and Faculty of Business, Economics and Studies, Policy Studies, University BruneiPolicy Darussalam University of Brunei Darussalam, Jalan Tungku Link, Bandar Seri Begawan, BE-1410 The Core Residential College, Tower.2 Room 201/D. Mobile: +6738601952, Email:
[email protected] University Brunei Darussalam, Jalan Tungku Link, Bandar Seri Begawan, BE-1410. Abstract This paper has tested the relationship between import openness and economic growth for OECD economies. The endogeneity of import openness is addressed by instrumentation strategy based on geographical characteristics. Results show that both actual import openness and also instrumented import openness are significantly correlated with economic growth. Labour force and financial development are also positively and significantly related with per capita GDP. Further results show that population density and investment are statistically insignificant. Keywords: Growth, Import Openness, OECD, Endogeneity, Instrument, Regression.
1. Introduction The relationship between trade openness and economic growth is well debated and well researched topic in the trade-growth literature. There are sound arguments to believe that openness to foreign trade enhances economic growth. Foreign advanced technologies and essential inputs for the development of domestic industrial as well as agricultural sector can only be accessed through open trade policies. Trade openness enhances productivity and efficiency of the domestic producers by exposing them to constructive competition. Trade openness can also influence economic growth through the channel of investment. This paper tests the impact of import openness on per capita GDP in the context of OECD member economies. Rodrik (1999) argued that the benefits of trade openness lie on the import side instead of export side, and exports are just a means to finance imports. The author further classified imports into different groups such as ideas, goods and services, capital and institutions and argued that the impact of exports on growth is not greater than imports. The contribution of this paper to the literature is two-fold. Firstly, this paper has focussed on imports-growth relationship instead of trade-growth relationship for OECD economies.
IJER | JAN - FEB 2013 Available
[email protected]
Secondly, this study has constructed an instrument for import openness based on the gravity model of international trade following the seminal work of Frankel and Romer (1999). The constructed instrument has performed better in the cross-sectional analysis and hence can be used in future studies. This paper is organized as follows. The literature review is presented in section 2. Section 3 discusses the model and provides information about the sample and data sources. The issue of endogeneity is addressed by instrumentation in section 4. Growth regressions are estimated and discussed in the penultimate section. Conclusion Concluding remarks are presented in section 6. 2. Literature review Openness to international trade and its impact on economic growth is studied in the literature extensively. Influential studies conducted by Dollar (1992), Sachs and Warner (1995) Edwards (1998) and Frankel and Romer (1999) have provided a strong support to the hypothesis that increased trade openness leads to higher economic growth. Frankel and Romer (1999) have addressed the endogeneity problem of trade openness by regressing trade-GDP ratio on geographical
1
Muhammad Tahir, Int. J. Eco. Res., 2013, v4i1, 1-7
characteristics. Further their results show that both actual trade openness and also instrumented trade openness are positively related with per capita GDP. Bassanini and Scarpetta (2001) have conducted a panel study for OECD economies and displayed a positive and significant impact of trade openness on economic growth. Yanikkaya (2003) displayed a positive relationship between tariffs and economic growth in developing countries. Vamvakidis (2002) has conducted a comprehensive study on trade-growth relationship and documented that the positive trade growth relationship is observed only after 1970. However, in a comprehensive paper Rodrik and Rodriguez (2000) have critically evaluated influential papers (Dollar; 1992, Sachs and Warner; 1995, Edwards; 1998, Frankel and Romer; 1999) on the relationship between trade openness and economic growth and claimed that these studies have either measured the openness variable wrongly or have employed inappropriate econometric techniques. Dowrick and Golley (2004) demonstrated that most of the benefits of trade liberalization occurred in developed countries post 1980. Ulasan (2012) documented the debate on tradegrowth relationship is controversial and the available literatures have not provided a convincing and robust evidence. 3.1.1. Model specification The objective of this study is to link import openness to economic growth in the context of OECD economies. However, growth is a complex process and hence cannot be explained by a single factor such as import openness. Therefore, in cross-country growth equation, other determinants of economic growth such as investment, labour force and financial development measured by market capitalization of listed companies as a percentage of GDP are also incorporated. The following model is specified,
IJER | JAN - FEB 2013 Available
[email protected]
ISSN: 2229-6158
lpcyi = b1 + b2linvi + b3llabi + b4lopeni + b5ldeni + b6linti + Ui (1.1) The term stands for the dependent variable and it measures the growth of real per capita GDP in purchasing power parity. Domestic investment in the is approximated by gross economy fixed capital formation as a percentage of GDP. All quantities are in real terms. Labout force is measured by employment level as a percentage of working age population. Import openness refers to imports as a ratio of GDP
. However, this variable is
endogenous in the growth regression and hence should not be included in its crude form. Therefore, I have followed the seminal work of Frankel and Romer (1999) and have constructed an instrument for bilateral import openness. Population density is calculated by dividing total population on total area. The quality of financial institutions is captured through market capitalization of listed companies as a percentage of GDP. Natural logarithm is used in order to make the relationship linear between the independent variables and the dependent variable. 3.1.2. Instrument for bilateral import openness There is a close relationship between geographical factors and international trade as predicted by the gravity model of international trade. Bilateral imports among countries largely depend on geographical factors. Let us consider any two trading partners X and Y, which are engaged in bilateral trade (including imports). Imports between these two countries can be determined by their population densities. Densely populated economies are generally overpopulated and having less land for agricultural sector due to which they could not produce enough to meet the domestic demand of
2
Muhammad Tahir, Int. J. Eco. Res., 2013, v4i1, 1-7
the consumers and also input demand of the industrial sector. Therefore densely populated economies are expected to trade more (more imports). The same hypothesis is applied for a country’s partner as well. Bilateral distance between country X and Y can also affect their bilateral imports. The gravity model predicts that trade will be reduced and hence imports, if partners are located far away from each other. Generally, landlocked economies trade less (less imports) because of high transport cost. Countries with common borders import more from each other because of proximity and marginal transport cost. These arguments are consistent with the gravity model of international trade. Based on these theoretical arguments, the following equation is specified for instrumentation,
(1.2) Where stands for bilateral imports (imports as a ratio of GDP) between country X and its trading partner Y. and measures population density of country X and country Y respectively. is the distance between the capital city of country X and its trading is a dummy variable and partner Y. takes a value 1 if one of the partner or both the partners are landlocked and zero otherwise. is a dummy variable and takes a value 1 if partners have shared borders, and zero otherwise. 3.1.3 Sample and data This section shed some light on the sample and data sources. The OECD member economies are well developed in terms of technology and are very open to international as well as bilateral trade including imports. These economies are quite homogenous in terms of most of the economic parameters and are approximately at the same level of
IJER | JAN - FEB 2013 Available
[email protected]
ISSN: 2229-6158
development. In addition, these economies provide reliable data for analysis. Therefore OECD member economies are chosen for the analysis. Data on GDP, investment, and market capitalization of listed companies as a percentage of GDP are obtained from World Development Indicators (WDI, 2011). Real per capita GDP in purchasing power parity is obtained from Penn World Tables. Trade statistics such as exports and imports and labour force data are obtained from OECD website. Capital stock data (Nehru capital stock estimates) are obtained from Nehru et al., (1993). Statistics on geographical characteristics such as landlocked economies, bilateral distance, area and countries with share borders are obtained from CIA world Fact book (2011) and from other online sources. 4.1.1. Estimating methodology A typical year 2008 is selected as a reference year for empirical analysis, as for most of the variables of interest data are available for this year. Cross-sectional studies are important in the sense that one could get easily statistics for many variables for at least one year. GDP is adjusted for 29 countries for the fact that this trade is only within the OECD countries. Equation (1.2) is estimated to construct an instrument for import openness. The fitted values from equation (1.2) are expected not to be correlated with the error term of the equation and should be correlated with actual import openness. The White test detected heteroscedasticity because of the cross-sectional nature of the data. Heteroscedasticity does not change coefficients but invalidates the test of significance. Therefore, the model is estimated with ‘White heteroscedasticity consistent estimator’ which is more efficient than ordinary least square in the presence of heteroscedasticity. Instrumented regression equation with results is reported below,
3
Muhammad Tahir, Int. J. Eco. Res., 2013, v4i1, 1-7
(-1.39) (3.23)
(5.52)
(-9.50)
Adjusted R-squared= 0.36 S.E.R= 1.49
(2.34)
(-4.74)
F = 47.29
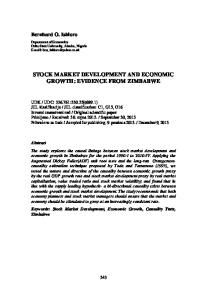
(Values in parenthesis show t-scores) 4.1.2. Instrumentation results Equation (1.2) is estimated using OLS. Results are consistent with the predictions of the gravity model of international trade and also with findings of Frankel and Romer (1999). All of the right hand side variables are significant with expected signs. Population densities of both the partner countries are significant at 1 percent level and report positive coefficients. This result is consistent with the theoretical arguments that densely populated economies usually trade more and hence imports more. The Distance variable and landlocked characteristic both entered to the regression equation with expected negative signs and are also statistically different from zero at 1 percent level. The dummy variable for shared borders is also statistically significant having expected positive coefficient which shows that bilateral imports would rise if partner are sharing borders. Adjusted Rsquared is 0.37 which shows that the fitted model can explain 37 percent variation in the dependent variable. The fitted values are collected from the estimated equation (1.2). Actual import openness and the constructed import openness are plotted in the following figure.1.
IJER | JAN - FEB 2013 Available
[email protected]
Figure 1. Relationship between Actual and Constructed Trade Share, (2008) 24
Constructed Imports Openness ( Percentage)
lopeni = –1.06 + 0.11denli + .39den2i – 0.72disti + 0.75DSBi –.78DLLi
ISSN: 2229-6158
20 16 12 8 4 0
0
4
8
12
16
20
24
28
32
Actual Imports Openness (Percentage)
Actual import openness is plotted on horizontal axis and instrumented import openness is plotted on vertical axis. The scatter shows a strong positive correlation between both the quantities. Both the quantities are in percentages. The dots are overlapping. The coefficient of correlation is 0.56 between actual import openness and instrumented import openness. 5.1.1. Estimating growth regressions The potential endogeneity of import openness is addressed through instrumentation strategy based on the gravity model of international trade in the previous section. Therefore equation (1.1) is estimated both with actual import openness as well as with instrumented import openness. Regression results are presented in Table. 1.
4
36
Muhammad Tahir, Int. J. Eco. Res., 2013, v4i1, 1-7
ISSN: 2229-6158
F= S.E.R =0.31 Note: The dependent variable is log of real per capita GDP in purchasing power parity. (***), (**) and (*) indicates 1%, 5% and 10% level of significance respectively.
economic growth. Other growth determinants such as labour force and quality of institutions are also statistically significant with expected positive signs. Population density does not have any significant impact on per capita GDP, but importantly reports a correct and expected positive coefficient. Surprisingly, the coefficient of investment is negative but is insignificant statistically at standard level. This could be either due to data issues, or the heterogeneous nature of investment among countries. Adjusted R-squared is 0.52, shows that more than 50 percent of variation in the dependent variable can be explained by the fitted model. F-statistic is also statistically significant at 1 percent level. Regression results with instrumented import openness are reported in the second column of Table (1). The geography based instrument for import openness entered to the growth regression with expected positive sign at 5 percent level of significance. The significance of both actual import openness as well as instrumented import openness confirms that import openness enhances economic growth. Further results show that Labour force is significant at 1 percent level and reports a positive coefficient. Well developed financial system is also positively and significantly correlated with economic growth. Population density again has only expected positive sign in the regression. The value of adjusted Rsquared is 0.54 which is good enough for a cross sectional study. The joint significance F-statistic is 8.3 and also statistically significant, showing the overall efficiency of the fitted model.
5.1.2. Results and Discussion Table (1) presents main regression results. The second column of Table (1) reports results with actual import openness. Import openness entered to the growth equation positively and significantly at 10 percent level. It shows that higher import openness is associated with higher
5.1.3. Why investment has a negative coefficient? Theoretical and empirical literature shows that Investment matters for economic growth. However, the coefficient of investment in both the growth regressions is negative but not statistically significant. This could be either due to measurement
Table. 1 Main Regression Results (Import Openness and Economic Growth) Variables
Method of Estimation Ordinary Instrumental Least Variable Method Square Constant 2.80 3.23 (c) (0.91) (1.05) Log of 0.12 0.11 openness (1.95)* (2.14)** ( Log of 0.03 0.004 density (0.68) (0.09) Log labour force
of 1.91 (3.50)***
1.92 (3.59)***
Log of -0.37 investment (-0.69)
-0.51 (-0.96)
Log of 0.19 institutions (1.82)*
0.23 (2.20)**
Adjusted R-squared
Adjusted Rsquared F= 7.38 S.E.R 7.04 =0.31
IJER | JAN - FEB 2013 Available
[email protected]
5
Muhammad Tahir, Int. J. Eco. Res., 2013, v4i1, 1-7
issues or may be the proxy being employed for capturing investment may be poor. In figure.2, gross fixed capital formation as percentage of GDP is plotted against the percentage change in capital stock for the year 2005 and 2009 to see whether the latter reflects the former. The scatter diagram shows a very weak relationship between changes in capital stock and investment proxied by gross fixed capital formation as a percentage of GDP. The dots are scattered in both the scatters, confirming that gross fixed capital formation as a ratio of GDP and changes in capital stock are weakly correlated. And hence this could be the possible reason that why investment has a negative coefficient in the growth regression. In other words, gross fixed capital formation as a ratio of GDP which is routinely being used in empirical works for capturing investment may be poor.
Percentage change in capital stock (1990)
6
Percentage change in capital stock (2005)
14 12 10 8 6
18
20
22
24
26
28
4
3
2
10
15
20
25
35
30
Gross fixed capital formation as % of GDP (1990)
16
16
5
1
Figure 2. Relationships between Change in Capital Stock and Investment (2005, 1990)
4
ISSN: 2229-6158
30
6. Conclusion This paper has tested the relationship between import openness and economic growth in the context of advanced OECD member economies. The empirical analysis is based on the data for the year 2008. Standard cross sectional econometric techniques are used in the empirical analysis. The endogeneity issue of import openness is addressed by instrumentation strategy based on the gravity model of international trade. The results have confirmed a positive relationship between import openness and economic growth. Imports are as much important as exports from growth perspective. Apart from import openness, labour force and financial development are also growth promoting determinants. The impact of labour force on per capita GDP is substantial. Well developed financial system also seems to be growth enhancing. Future research is required to find a suitable proxy for investment and should also test the imports-growth relationship for developing countries.
Gross fixed capital formation as % of GDP (2005)
IJER | JAN - FEB 2013 Available
[email protected]
6
Muhammad Tahir, Int. J. Eco. Res., 2013, v4i1, 1-7
7. References Bassanini, A. And Scarpetta, S. (2001). The Driving Forces of Economic Growth: Panel Data Evidence from the OECD Countries, OECD Economic Studies, No.33, 2001/2. Dollar, D. (1992). Outward Oriented Economies Really Do Grow More Rapidly? Evidence From 95 LDCs, 1976-85, Economic Development and Cultural Change; Apr 1992;40,3; ABI/ INFORM Global. Dowrick, S. And Golley, J. (2004). Trade Openness and Growth: Who Benefits? Oxford Review of Economic Policy, vol.20,No.1. Edwards, S. (1998). Openness, Productivity and Growth: What Do We Really Know? The Economic Journal, 108, pp-383-398. Frankel, A.J. and Romer,D. (1999). Does Trade Cause Growth? The American Economic Review,vol.89, No.3,pp-379399. Rodrik, D. (1999). The New Global Economy and Developing Countries: Making Openness Work,’ Policy Essay No. 24, Overseas Development Council.
IJER | JAN - FEB 2013 Available
[email protected]
ISSN: 2229-6158
Rodriguez,F. And Rodrik, D. (2000). Trade Policy and Economic Growth: A Skeptics Guide to the Cross-National Evidence, NBER Working Paper No. 7081. Sach, D. J. And Warner, A. (1995). Economic Reforms and The Process of Global Integration, Brooking Papers on Economic Activity; 1995;1; ABI/ INFORM GLOBAL. Yanikkaya, H. (2003). Trade Openness and Economic Growth: A CrossCountry Empirical Investigation, Journal of Development Economics 72(2003), pp- 57-89. Tanzi, V. And Davoodi, H. (1997). Corruption, Public Investment and Growth, International Monetary Fund, Working Paper No. 97/139. Ulasan, B. (2012). Openness to International Trade and Economic Growth: A Cross-Country Empirical Investigation’, The Open Access, Open Assesment E-Journal, No.2012/25. Vamvakidis, A. (2002). How Robust is the GrowthOpenness Connection? Historical Evidence, Journal of Economic Growth, vol.7, pp-57-80.
7