Psychophysiology, 36 ~1999!, 333 – 338. Cambridge University Press. Printed in the USA. Copyright © 1999 Society for Psychophysiological Research
Impedance pneumography: Noise as signal in impedance cardiography
JOHN M. ERNST, DANIEL A. LITVACK, DAVID L. LOZANO, JOHN T. CACIOPPO, and GARY G. BERNTSON Department of Psychology, Ohio State University, Columbus, USA
Abstract Thoracic impedance is modulated by events within the respiratory cycle, which represents a source of “noise” in impedance cardiography. Respiration itself, however, is a physiological rhythm of interest to psychophysiologists. We report here methods and validation for deriving impedance pneumographic measures of respiration from impedance cardiography signals, based on standard tetrapolar band electrodes. We recorded the change in impedance ~DZ!, the first derivative of the change in impedance ~dZ0dt!, output from a strain-gauge respirometer, and criterion spirometry from eight healthy adults during rest, paced breathing, abdominal breathing, thoracic breathing, and a mental arithmetic task. Transfer function analyses revealed that a DZd signal ~derived by integration of the dZ0dt signal! provided the best estimate of the criterion spirometric measure for all parameters ~coherence, phase, and gain!, accounting for almost 90% of the variance in respiratory waveform morphology. The results document the potential utility of impedance pneumography, as derived from standard impedance cardiography signals. Descriptors: Impedance pneumography, Respiration, Respirometry, Tetrapolar electrodes
time consuming for such devices because of nonlinearities and subject-to-subject variations in the relation between strain-gauge tension and lung volume. An alternative impedance pneumographic approach was developed by early physiologists, based on the relatively linear changes in thoracic impedance observed with changes in lung volume ~Allison, Holmes & Nyboer, 1964; Baker, Geddes, Hoff, & Chaput, 1966; Khalafalla, Stackhouse, & Schmitt, 1970; Kubicek, Kinnen & Edin, 1964!. With the increasing application of impedance cardiography in psychophysiological studies, this approach may be particularly useful if relevant respiratory measures could be derived from standard thoracic impedance signals. Although respiratory-related changes in thoracic impedance are recognized in impedance cardiography, they have been considered a source of noise to be extracted or otherwise dealt with ~Kelsey & Guethlein, 1990; Sherwood et al., 1990!. Rather than being a mere annoyance, however, the impedance pneumographic signal may offer a viable index of respiration. This possibility could be important for impedance cardiographic studies, especially ambulatory studies, because this index would allow measurement of respiration without additional sensors, A0D channels, and data storage capacity. In the present study, we evaluated the viability of impedance pneumographic measures of respiration using the standard electrode configurations and methods of impedance cardiography ~as specified in the Psychophysiology guidelines on impedance cardiography, Sherwood et al., 1990!. Because of the close correspondence between changes in lung volume and impedance, transthoracic impedance signals have received much attention for deriving indices of respiration ~Cohen et al., 1997; Kim, 1989!. Although the volume-impedance rela-
Respiration has been of interest historically to psychophysiologists. Although respiration has received little attention as a direct marker of psychological activity, it has been linked to information acquisition and emotion ~Lorig & Schwartz, 1990!. Moreover, its contribution to respiratory sinus arrhythmia ~RSA! is of considerable importance in deriving noninvasive measures of parasympathetic control from patterns of heart rate variability ~Berntson et al., 1997!. Unfortunately, direct spirometric measures of respiration require a mask or mouthpiece that may be intrusive in psychological studies, and the requisite equipment can be expensive. Consequently, various circumferential strain-gauge respirometers are used commonly in psychophysiological studies ~referred to here as respirometry!. This approach has several limitations. First, considerable variance may be introduced by inconsistencies in the placement or tension of a strain-gauge belt, and variations in chest size and configuration may also influence the measures. Moreover, a single belt may not capture abdominal ~diaphragmatic! and thoracic respiration equivalently. This difficulty has led to the application of dual respirometry belts, or even complete thoracic0 abdominal “wraps.” Calibration procedures can be complex and
John M. Ernst is now at the Department of Psychology, Illinois Wesleyan University. This study was supported in part by the John D. and Catherine T. MacArthur Foundation, and NHLBI grant HL54428. We thank Scott Hill and the Ohio State University Center for Wellness and Prevention for generous use of their space and spirometer. Address reprint requests to: Gary G. Berntson, Department of Psychology, Ohio State University, 1885 Neil Ave., Columbus, OH 43210-1222, USA. E-mail:
[email protected].
333
334 tionship has been found to be highly linear, the sensitivity and range of this relation is dependent on the particular electrode configuration. If thoracic impedance based on standard tetrapolar electrode configurations can provide accurate estimates of respiration, then researchers using impedance cardiography may derive respiratory measures directly from the acquired impedance signals. Although much has been written about impedance pneumography, no validation study has been published in which standard impedance cardiography tetrapolar band electrodes were used. In a representative study of impedance pneumography, Khalafalla et al. ~1970! examined a variety of transthoracic impedance electrode configurations for measuring respiration. Using pairs of spot electrodes ~one pair for the exciting current and one pair for measuring the output voltage! the investigators compared results with 14 orthogonal lead configurations to criterion spirometric measures. These authors concluded that ~a! highly replicable respiration measures could be obtained from impedance signals, ~b! sagittal relative to horizontal and vertical electrode placements yielded the most accurate signal, and ~c! the impedance pneumographic signal was independent of body weight, height, chest-toback distance, or subject age. To understand the underlying physiological origins of the impedance pneumography signal, Baker et al. ~1966! examined forced, spontaneous, diaphragmatic, and nondiaphragmatic breathing in dogs while measuring thoracic impedance using spot electrodes placed directly on the ribs. Results revealed that changes in the acquired impedance signal were sensitive to both rib cage movements ~thoracic breathing! and diaphragm movements ~abdominal breathing!, were closely related to change in lung volume irrespective of its origin ~see also Kubicek et al., 1964!, and that not all electrode placements gave equally strong signals. Because some electrode configurations are better for measuring respiration than others, the question arises as to whether the standard impedance cardiography electrode configuration can also index respiration accurately. An accurate index seems likely, as previous research on impedance pneumography has used electrodes somewhat similar to the standard tetrapolar configuration ~Allison et al., 1964!. In a recent investigation, de Geus, Willemsen, Klaver, and van Doornen ~1995! examined respiration measures derived from a common tetrapolar impedance cardiograph electrode configuration using spot rather than band electrodes. They compared respiration values based on impedance pneumography with results based on a single strain-gauge respirometer placed around the abdomen. Results revealed that respiration rate, inspiration time, and expiration time estimates were generally equivalent for the two measures. Unfortunately, this study did not include a spirometric criterion measure of respiration, so validity of the signals could not be evaluated. To assess the validity of impedance pneumographic measures derived from standard impedance cardiography methods, we compared signals collected with tetrapolar circumferential band electrodes, against criterion spirometric measures. For comparison, we also included a standard measure based on respirometry. Measures were obtained under baseline conditions, and during paced breathing, abdominal breathing, thoracic breathing, and a mental arithmetic task. Method Participants Participants were seven men and one woman. All participants were healthy and ranged in age from 24 to 41 years.
J.M. Ernst et al. Measures Transthoracic impedance was measured using a Minnesota model 304B Impedance Cardiograph ~Instrumentation for Medicine, Greenwich, CT!. Tetrapolar circumferential mylar-band electrodes were secured at standard cervical and thoracic sites ~Cacioppo et al., 1994; Sherwood et al., 1990!. The signals ~dZ0dt, Zo , DZ, and electrocardiograms @ECG#, with the Minnesota device set on autobalance! were digitized at 1000 Hz by a data acquisition computer system consisting of a custom developed Labview executable program, running on a Pentium-based notebook outfitted with a DaqCard-1200, 12-bit PCMCIA A0D adapter ~National Instruments, Austin, TX!. Respirometry measures were derived from an EZ-Resp belt and EZ-Amp ~EPM Systems, Midlothian, VA!. The belt consists of a piezoelectric transducer mounted on an elastic band. To monitor both thoracic and abdominal breathing, the respiratory belt was secured below the lower impedance electrode, at the level of the lower rib cage. Direct spirometric measures of respiration were obtained by means of a metabolic cart model Cardio2 ~Med Graphics, Minneapolis, MN! that provided an analog output proportional to the rate of flow of air through a mouthpiece. The system was calibrated prior to each session by means of a standard 3-liter syringe. Respiration and spirometry signals were digitized along with the impedance signals. The stimulus system used for respiratory pacing consisted of a Pentium-based notebook, which ran a custom-developed Labview application to provide a visual display of a synthesized timevarying respiratory pattern that the participant was instructed to follow. A cursor sweeping across this respiratory pacing display provided the tracking point for the participant’s respiration. Each respiratory cycle of the display signal was randomly selected from a set of 15 cycles having the following characteristics: ~a! one of five respiratory periods ~3, 4, 5, 6 or 7 s!, ~b! at one of three amplitudes ~75, 100, or 200% of a normal breath!. This sequence of pacing cycles yielded a quasi-white noise respiratory pacing series with a mean respiratory frequency and amplitude being at typical baseline levels ~see Berger, Saul & Cohen, 1989!. This “white-noise” approach sampled a range of respiratory parameters while minimizing potential hypoventilation or hyperventilation from extended segments of extreme respiratory parameters. Procedure Each participant was tested in a single session, consisting of a sequence of five time blocks as follows: ~a! 1-min baseline, ~b! 5-min paced breathing, ~c! 1-min abdominal breathing, ~d! 1-min thoracic breathing, and ~e! 1-min verbal arithmetic task. Verbal instructions were given between each segment, and the participant was permitted to take brief breaks at these junctures. Before each session, a spirometry-calibration epoch was acquired with a 3-liter inhale0exhale cycle of a calibration syringe. After this cycle, the spirometric transducer was connected to the subject mouthpiece, and a nose clip was placed over the nostrils to prevent nasal breathing. The participant was then given a practice period with the paced breathing condition until he or she was comfortable in following the display. After the practice regimen, formal testing began. For the initial baseline min, the participant was instructed to breathe at a natural rate and depth. For the next 5-min block, the participant was instructed to control breathing rate and depth by synchronously following the paced breathing stimulus. Next, the participant was instructed to breathe abdominally for 1 min, while
Impedance pneumography minimizing chest movement, and then to breathe thoracically for the subsequent minute, while minimizing abdominal movements. The last 1-min block entailed a mental arithmetic task. The participant was instructed to serially subtract a constant from an arbitrary 4-digit number announced by the experimenter. Responses were to be spoken aloud while wearing the mouthpiece. Signal Processing From the procedure described above we acquired four signals, each sampled at 1000 Hz and processed in 1-min segments: respirometry, spirometry, dZ0dt, and DZ. Because the DZ signal is coupled inductively to the output of the Minnesota impedance device, this signal is subject to low-frequency filtering and distortion. Consequently, we derived a measure of DZ ~DZ d ! by integrating the dZ0dt signal ~to reconstruct DZ undistorted by this inductive filtering!. The DZ d displayed a closer correspondence to direct spirometric measures of respiration than did the DZ output of the Minnesota device and was used for the primary analyses.1 After decimating each signal to 250 Hz, we applied a pointby-point integration to the dZ0dt signal and to the spirometry signal. All four signals ~respirometry, DZ, DZ d , and spirometry! were low pass filtered ~0.5 Hz!, using an interpolated finite impulse response filter ~Neuvo, Cheng-Yu, & Mitra, 1984!, to remove cardiac signals and high frequency noise. All signals were then linearly detrended and zero-meaned, and a power spectrum ~Fast Fourier Transform @FFT#! was calculated for each minute to decompose the signals in the frequency domain. This method provided descriptive characteristics of the respiration, and served as the basis for weighting of transfer functions as described below. In addition, a Hanning window was applied to each of the four signals, and transfer function analyses were used to compare DZ d , DZ, and respirometry ~outputs! to the criterion spirometry signal ~input!. Transfer function analyses were run on each 60-s epoch, and were based on seven 15-s overlapping windows to minimize problems of nonstationarity and to smooth the resulting functions ~Oppenheim & Schafer, 1989!. These analyses yielded estimates of the parameters of coherence ~similarly of waveform morphology!, gain ~amplitude ratio! and phase relations of the signals.2
1 Because dZ0dt is the derivative of DZ, integrating the dZ0dt output signal would precisely reconstruct DZ. In preliminary subjects, however, we found that DZ d and DZ were similar but not identical. Examination of the electrical schematic of the Minnesota device revealed an inductive coupling of the DZ signal to the device output. This coupling was implemented after the takeoff of the DZ signal for derivation of dZ0dt, and thus the dZ0dt signal was not distorted by this inductive coupling. Consequently, we made the a priori decision to use the integrated dZ0dt signal for primary analyses. In post hoc analyses, however, we also compared DZ d ~derived by integration of the dZ0dt signal! and the direct DZ output from the Minnesota impedance cardiograph. In accord with the inductive coupling of the DZ, and the associated signal distortion, the DZ d signal was found to be superior to DZ as an index of respiration. During the 5 min of paced breathing, for example, the mean overall coherence for DZ d was 0.90 6 0.15, compared with 0.74 6 0.12 for DZ; (t~7! 5 4.168, p , .005!. For impedance cardiographic devices that do not distort the DZ signal, this output would be expected to yield coherence with spirometry comparable to that obtained with the integrated dZ0dt signal. Even with the inductive coupling of the DZ output, this signal yielded a coherence with spirometry comparable to that obtained by strain-gauge respirometry ~see Results!. 2 Because the transfer function gives phase in radians, phase is unwrapped to eliminate discontinuities in the waveform that are greater or less than 1808.
335 The transfer functions provide parameter estimates over the entire range of frequencies within the analytical window ~0.05– 0.50 Hz!, whereas the distribution of respiratory power was more restricted. Because respiratory frequencies are not uniformly distributed across the frequency spectrum, the transfer functions were weighted using the output power spectrum. This method of weighting provided more meaningful summary statistics of these parameters, appropriately scaled by the actual frequency distribution of power ~for general rationale for the weighting procedure, see Porges et al., 1980!. The value of each point of the transfer function was multiplied by the relative amplitude of the power spectrum of the output signal at that frequency ~expressed as a proportion of total power!. This calculation yielded an overall average estimate of the transfer function parameter, appropriately weighted by the relative power of the specific respiratory frequency contributions to that estimate. Results Transthoracic Impedance as a Measure of Respiration Impedance pneumography derived from standard tetrapolar band electrodes was found to provide a highly accurate measure of respiration. As illustrated in Figure 1, the impedance signal ~DZ d ! showed a close correspondence to the criterion spirometric measure. The coherence estimates of the transfer functions between spirometry and DZ d , for each test condition, are illustrated in Table 1. Approximately 90% of the waveform variance of the spirometry signal was accounted for by the impedance signal, as evidenced by the overall coherence between these signals ~mean coherence for all participants and conditions 5 0.88!. As is apparent in Table 1, results were consistent over all conditions, although coherence was slightly lower for the verbal arithmetic task, possibly due to the relatively low amplitude of respiration during this condition. Comparison With a Standard Circumthoracic Respiratory Transducer The respiratory transducer also performed well, capturing approximately 80% of the variance of the respiratory fluctuations as measured by spirometry. Of further note was the fact that the single, centrally placed strain-gauge transducer provided a reason-
Table 1. Coherence Between Impedance Pneumography and Respirometry, Relative to Spirometry Impedance bands Task Baseline Paced breathing Abdominal breathing Thoracic breathing Mental arithmetic Overall values
Respiratory belt
M
SD
M
SD
0.86 0.90 0.89 0.91 0.79 0.88
0.14 0.15 0.17 0.09 0.17 0.12
0.91 0.79 0.71 0.80 0.71 0.78
0.08 0.14 0.26 0.12 0.17 0.10
Note: The values represent the 1-min epochs for baseline, abdominal breathing, thoracic breathing, and the math task; and the average of the five 1-min epochs for the paced breathing. The overall values represent the average of the nine 1-min epochs.
336
J.M. Ernst et al.
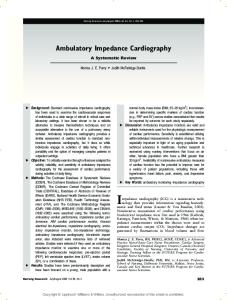
Figure 1. Impedance pneumography and spirometry traces obtained during baseline ~A! and paced breathing ~B! from a representative participant. Left panels illustrate the time-varying spirometric and impedance ~DZ d ! traces. Right panels depict the overall distribution of spectral power, based on Fast Fourier Transform analyses. Note: the selection criteria for this representative participant were that the coherence for DZ d to spirometry was at the median for the group, and that the breathing pattern included a range of frequencies and depths.
able representation of the spirometry waveform for both thoracic ~coherence 5 0.80! and abdominal ~coherence 5 0.71! breathing. As illustrated in Table 1, however, the impedance signal showed a greater overall coherence with the criterion spirometric measure than did respirometry. A 2 Measure ~impedance vs. respirometry! 3 5 Condition ~baseline, paced respiration, mental arithmetic, thoracic breathing, and abdominal breathing! repeated measures analysis of variance ~ANOVA! revealed a significant main effect of measure, reflecting the higher coherence values of the impedance signal, F~1,7! 5 22.3, p 5 .002. There were no significant main effects of condition, or interaction on this term.
in phase alignment with respiration than was the respirometry signal, impedance 5 28 6 17, respirometry 5 2928 6 15; t~7! 5 42.1, p , .001. There was also considerably less minute-to-minute variability in the phase relationship between spirometry and the impedance signal, compared with respirometry. To index this variability, the average absolute value of the phase lag was derived across the separate test conditions and minutes for each participant. This minuteto-minute variability in phase lag proved to be appreciably smaller for the impedance measure than for respirometry, impedance 5 78 6 9; respirometry 5 858 6 13; t~7! 5 11.3, p , .001. These results indicate that impedance pneumography may have advantages over respirometry for analyses that are phase sensitive.
Additional Analyses: Phase and Gain Phase. A desirable feature of the impedance signal was that it displayed no systematic phase lag with respiration. The overall mean phase lag between the impedance pneumographic and the spirometric signals did not differ from zero, 28 6 17 SD; t~7! 5 0.30, p , .77. Moreover, the impedance signal was more closely
Gain. The gain of the transfer function is a dimensionless ratio of the output ~impedance! to the input ~spirometry! signals. The absolute value of this parameter is not meaningful physiologically, because it reflects in part the characteristics of the recording system. When multiplied by an instrumentation calibration coefficient, however, the absolute value yields an estimate of sensitivity
Impedance pneumography of the impedance measure.3 Sensitivity of DZ d in the present study was 4.7 6 2.6 ohms0liter, which represents the slope of the function relating change in impedance to the change in lung volume. Analysis of the gain parameter suggests that the impedance signal may provide a more reliable and valid index of respiratory amplitude than does respirometry. Again, the absolute values of the gains of the impedance pneumography versus the respirometry signals are largely irrelevant, as any difference would be equated by the calibration coefficient ~see Footnote 3!. A more important consideration is the consistency of this parameter within- and between-subjects. For these analyses, the standard deviation of the gain across conditions was divided by the mean value, expressing variability in proportion to the mean level. Indices of withinsubjects variation for pneumographic and respirometric measures were based on the minute-by-minute variations in gain for individual subjects. Results revealed that within-subjects consistency of the gain parameter for the impedance signal was significantly higher than for the respirometry signal, impedance signal 5 0.20 6 .09 SD; respirometry signal 5 0.54 6 .27; t~7! 5 4.149, p , .005. In addition, the consistency of between-subjects gain estimates was indexed by the scaled standard deviation ~standard deviation0 mean! of the gain parameter between subjects ~collapsed over all task minutes for each participant!. Similar to results of withinsubjects analyses, the impedance signal evidenced greater betweensubjects concordance with spirometry than did the respirometry signal, impedance 5 0.32 6 .36 SD; respirometry 5 0.76 6 .56; t~7! 5 3.921, p , .05. Discussion The present results demonstrate that impedance cardiography signals, derived from a standard tetrapolar band electrode configura-
3 Gain is a dimensionless ratio, representing the relative transfer of the input to the output of a process. In typical recording contexts, the input ~spirometry! and output ~impedance pneumography! have dimensions of voltage, and these units cancel in the gain parameter. The value of this parameter has no absolute physiological meaning, as different impedance cardiographs and spirometry devices may give different voltage outputs for a given input. For this parameter to be meaningful in an absolute sense, a calibration coefficient must be derived that relates the recorded voltage change to the more meaningful units of liters of respiratory air exchange ~input! and ohms change of impedance ~output!. This calculation yields a parameter, generally referred to as sensitivity, which expresses gain scaled into physiologically meaningful units:
gain 5 output0input sensitivity 5 gain 3 cgain where cgain has the dimension of ohms0liter ~unit change in impedance per unit of respiratory air exchange!. This coefficient is derived from two calibration values: cgain 5 output0input 5 cspirometry 0cimpedance where cimpedance is the change in voltage output of the cardiograph device for a given change in thoracic impedance, expressed in volts0ohm, and cspirometry is the change in voltage output of the spirometry device for a given respiratory air exchange ~or integrated output if the spirometry device provides a flow rate rather than a volumetric output!, expressed in units of volts0liter. The dimensions of cgain are thus ohms0liter, as derived by substituting the dimensions of cimpedance and cspirometry : cgain 5 ~volts0liter!0~volts0ohm! 5 ~volts0liter!{~ohms0volt! 5 ohms0liter.
337 tion ~Sherwood et al., 1990!, can provide an accurate measure of respiration. Transfer function analysis revealed that impedance pneumography compares favorably to direct spirometric measures, accounting for almost 90% of the variance in waveform morphology of the spirometric signal. Impedance pneumography was found to yield a more accurate representation of respiration than a standard respirometry belt, with less phase lag and lower phase and gain variability. Respirometry also did surprisingly well, however, accounting for about 80% of the waveform variance in the spirometric signal. Respirometry is further limited, however, by the larger phase lag, phase lag variability, and by the greater within- and between-subjects variability in gain. Previous research has found that the electrode configuration can impact on the amplitude of the impedance pneumographic signal ~Baker et al., 1966; Khalafalla et al., 1970; Kubicek et al., 1964!. Khalafalla et al. ~1970! reported that sagittal placements of spot electrodes gave larger impedance changes than other configurations, such as the common cardiography spot-electrode arrangement that has been used in psychophysiological studies ~Sherwood, Royal, Hutcheson, & Turner, 1992!. Consequently, the present findings cannot be assumed to generalize to spot electrodes. In a recent ambulatory monitoring study, de Geus et al. ~1995! reported generally comparable respiratory measures with a respirometry belt and with impedance derived from spot electrodes in a tetrapolar impedance-cardiography configuration. Unfortunately, that study did not include direct spirometry, so comparison with a criterion measure was not possible. Preliminary findings from our laboratory suggest that the impedance pneumographic signal from spot electrodes may show reasonable coherence with spirometry ~mean coherence 5 .74!, but that this coherence may not be as high as with band electrodes. This issue warrants further research. An additional finding of the de Geus et al. ~1995! study was that the impedance pneumography signal, derived from spot electrodes, was somewhat more prone to movement artifact than was the respirometry belt. It is not clear whether band electrodes were also prone to movement artifact, as we did not explicitly evaluate movement sensitivity in the present study. Although movement sensitivity may not be a serious concern for controlled laboratory studies, the potential sensitivity to movement artifacts does warrant further attention, especially for ambulatory monitoring. The present study builds on earlier research that documented the linearity between lung volume and transthoracic impedance, and explored the impact of alternative electrode configurations ~e.g., Allison et al., 1964; Baker et al., 1966; Khalafalla et al., 1970; Kubicek et al., 1964!. Results demonstrate that standard tetrapolar band electrodes can provide viable respiratory monitoring in psychophysiological studies, over a wide range of respiratory amplitudes and frequencies. Although the linearity of the impedance–lung volume relation may break down at respiratory extremes ~peak inspiration and forced expiration; Allison et al., 1964!, the respiratory signal was captured accurately over a range of inspiratory volumes and frequencies representative of those ranges likely encountered in psychophysiological studies. Although the present study did not examine potential sex differences, previous studies have shown that the accuracy of impedance cardiographic signal is independent of body weight, height, chest-toback distances, or participant age ~Khalafalla et al., 1970!. Moreover, for the single female tested in the present study, the coherence between the impedance signal and spirometry was in the upper half of the overall distribution. Together, these finding suggest that impedance pneumography is applicable across a wide range of participants and conditions.
338
J.M. Ernst et al.
An additional advantage of the impedance pneumography approach, relative to respirometry, is the minimal phase lag with respiration and the low phase lag variability. This advantage is particularly important for phase-sensitive comparisons such as crosscorrelational analyses or the peak-to-trough method of deriving RSA ~Grossman, van Beek, & Wientjes, 1990!. Further, there appears to be minimal between-subjects variability in the gain relationship between impedance and respiration, as subject-to-subject variability does not appear to be appreciably greater than withinsubject variance ~see also Khalafalla et al., 1970!. Consequently, even without calibration, impedance values can be used to quantify relative respiratory parameters across subjects. Moreover, unlike with respirometry belts, calibration with impedance pneumography is relatively simple given the linearity of the impedance signal and the fact that the origin of lung volume changes is largely irrelevant ~e.g. abdominal, thoracic, artificial ventilation; Baker et al., 1966!. Calibration requires only a single large breath through
a spirometer, so that a scaling coefficient can be derived to relate the absolute value of the impedance change to a known inhalation volume ~see Footnote 3!. In summary, the standard impedance cardiography signal, recorded with tetrapolar band electrodes, can provide a viable measure of respiration. The impedance pneumographic signal can be readily derived from dZ0dt, by applying a 0.5-Hz low-pass filter and integration to yield a derived DZ. For some instruments, DZ may be useable directly, but the standard Minnesota impedance device inductively couples this signal to the output, which degrades its use in pneumography. Impedance pneumography may be especially valuable as ambulatory impedance cardiography devices are beginning to be used for field research ~e.g., Ernst et al., 1997; Willemsen, de Geus, Klaver, van Doornen, & Carroll, 1996!. Because the pneumographic signal is intrinsic to the impedance signal, respiratory measures can be obtained without the need for additional sensors, recording channels, and storage capacity.
REFERENCES Allison, R. D., Holmes, E. L., & Nyboer, J. ~1964!. Volumetric dynamics of respiration as measured by electrical impedance plethysmography. Journal of Applied Physiology, 19, 166–173. Baker, L. E., Geddes, L. A., Hoff, H. E., & Chaput, C. J. ~1966!. Physiological factors underlying transthoracic impedance variations in respiration. Journal of Applied Physiology, 21, 1491–1499. Berntson, G. B., Bigger, T., Jr., Eckberg, D. L., Grossman, P., Kaufmann, P. G., Malik, M., Nagaraja, H. N., Porges, S. W., Saul, J. P., Stone, P. H., & Maurits, W. V. ~1997!. Heart rate variability: Origins, methods, and interpretive caveats @Committee report#. Psychophysiology, 34, 623– 648. Berger, R. D., Saul, J. P., & Cohen, R. J. ~1989!. Assessment of autonomic response by broad-band respiration. IEEE Transactions on Biomedical Engineering, 36, 57– 60. Cacioppo, J. T., Berntson, G. B., Binkley, P. F., Quigley, K. Q., Uchino, B. N., & Fieldstone, A. ~1994!. Autonomic cardiac control. II. Noninvasive indices and basal response as revealed by autonomic blockades. Psychophysiology, 31, 597–598. Cohen, K. P., Ladd, W. M., Beams, D. M., Sheers, W. S., Radwin, R. G., Thompkins, W. J., & Webster, J. G. ~1997!. Comparison of impedance and inductance ventilation sensors on adults during breathing, motion, and simulated airway obstruction. IEEE Transactions on Biomedical Engineering, 44, 555–566. de Geus, E. J. C., Willemsen, G. H. M., Klaver, C. H. A. M., & van Doornen, L. J. P. ~1995!. Ambulatory measurement of respiratory sinus arrhythmia and respiration rate. Biological Psychology, 41, 205–227. Ernst, J. M., Kowalewski, R. B., Hawkley, L. C., Burleson, M. H., Lozano, D., Berntson, G. G., & Cacioppo, J. T. ~1997!. Validation of a new ambulatory impedance cardiograph. Psychophysiology, 34~Suppl. 1!, S32. Grossman, P., van Beek, J., & Wientjes, C. ~1990!. A comparison of three quantification methods for estimation of respiratory sinus arrhythmia. Psychophysiology, 27, 702–714. Kelsey, R. M., & Guethlein, W. ~1990!. An evaluation of the ensemble averaged impedance cardiogram. Psychophysiology, 27, 24–33.
Khalafalla, A. S., Stackhouse, S. P., & Schmitt, O. H. ~1970!. Thoracic impedance gradient with respect to breathing. IEEE Transactions on Biomedical Engineering, 17, 191–197. Kim, D. W. ~1989!. Detection of physiological events by impedance. Yonsei Medical Journal, 30, 1–11. Kubicek, W. G., Kinnen, E., & Edin, A. ~1964!. Calibration of an impedance pneumograph. Journal of Applied Physiology, 19, 557–560. Lorig, T., & Schwartz, G. E. ~1990!. The pulmonary system. In J. T. Cacioppo & L. G. Tassinary ~Eds.!, Principles of psychophysiology: physical, social, and inferential elements. ~pp. 580–598!. New York: Cambridge University Press. Neuvo, Y., Cheng-Yu, D., & Mitra, A. K. ~1984!. Interpolated finite impulse response filters. IEEE Transactions on Acoustics, Speech, and Signal Processing, 32, 563–570. Oppenheim, A. V., & Schafer, R. W. ~1989!. Discrete-time signal processing. Englewood Cliffs, NJ: Prentice Hall. Porges, S. W., Bohrer, R. E., Cheung, M. N., Drasgow, F., McCabe, P. M., & Keren, G. ~1980!. New time-series statistic for detecting rhythmic co-occurrence in the frequency domain: The weighted coherence and its applications to psychophysiological research. Psychological Bulletin, 88, 580–587. Sherwood, A., Allen, M. T., Fahrenberg, J., Kelsey, R. M., Lovallo, W. R., & Van Doornen, L. J. P. ~1990!. Methodological guidelines for impedance cardiography @Committee report#. Psychophysiology, 27, 1–23. Sherwood, A., Royal, S. A, Hutcheson, J. S., & Turner, J. R. ~1992!. Comparison of impedance cardiographic measurements using band and spot electrodes. Psychophysiology, 29, 734–741. Willemsen, G. H. M., de Geus, E. J. C., Klaver, C. H. A. M., van Doornen, L. J. P., & Carroll, D. ~1996!. Ambulatory monitoring of the impedance cardiogram. Psychophysiology, 33, 184–193.
~Received June 10, 1998; Accepted September 9, 1998!