NEW DRUGS AND TECHNOLOGIES IN CARDIOLOGY
Cardiology Journal 2012, Vol. 19, No. 5, pp. 550–556 10.5603/CJ.2012.0104 Copyright © 2012 Via Medica ISSN 1897–5593
Impedance cardiography: Recent advancements Gerard Cybulski 1, 2, Anna Strasz 2, Wiktor Niewiadomski 2, 3, Anna Gąsiorowska 1, 4 1
Institute of Metrology and Biomedical Engineering, Department of Mechatronics, University of Technology, Warsaw, Poland 2
Department of Applied Physiology, Mossakowski Medical Research Centre Polish Academy of Sciences, Warsaw, Poland
3
Department of Experimental and Clinical Physiology, Medical University of Warsaw, Poland 4
Laboratory of Preclinical Studies in Neurodegenerative Diseases, Nencki Institute of Experimental Biology, Warsaw, Poland
Abstract The aim of this paper is the presentation of recent advancements in impedance cardiography regarding methodical approach, applied equipment and clinical or research implementations. The review is limited to the papers which were published over last 17 months (dated 2011 and 2012) in well recognised scientific journals. (Cardiol J 2012; 19, 5: 550–556) Key words: impedance cardiography, hemodynamic parameters, non-invasive methods continuous measurement, stroke volume, systolic time intervals
Introduction
Limitation of the review
Stroke volume (SV) is one of the important hemodynamic parameters characterizing mechanical activity of the heart working as a pump. However it is not very often used by the clinicians. The accurate measurement could be performed invasively (at some risk) but when noninvasive methods are used clinicians have limited confidence in them. During the routine echocardiography examination the ejection fraction, cardiac contractility and the size of heart chambers are determined. But the volume of blood ejected during one cycle or over a minute is not very often evaluated, unless a research study is performed. SV and its changes in response to physiological tests or pharmacological stimuli are potentially an excellent tool for evaluation of the mechanical efficiency of the heart. Additionally, reliable measurement of SV during transient events (e.g. in atrial fibrillation or in the presence of extrasystole) could allow quantitative estimation of cardiac work when it is difficult or even impossible to apply other, wellestablished, “classical” methods.
During the period of interest (2011–2012) there were published 99 papers listed in Web of Science (Thomson-Reuters science citation database) under the key word “impedance cardiography”. In this review we decided to analyze only those published in the regular journals of high impact factor (excluding supplements and conference papers) which seemed to us the most important from the methodological or application points of view (n = 22). Among those 99 papers some were published on intrathoracic impedance technique but we did not focus on them in this review.
Impedance cardiography: The method foundations Impedance cardiography signal generation Impedance cardiography (ICG) is a diagnostic method based on measurement of the electrical properties of the biological tissues applied to the thorax region. The most popular method of gene-
Address for correspondence: Gerard Cybulski, Associate Professor, Institute of Metrology and Biomedical Engineering, Department of Mechatronics, University of Technology, ul. Św. Andrzeja Boboli 8, 02–525 Warszawa, Poland, e-mail:
[email protected];
[email protected]
550
www.cardiologyjournal.org
Gerard Cybulski et al., Impedance cardiography: Recent advancements
Q R1
ECG
A1
amp R2
ICG A2
PEP
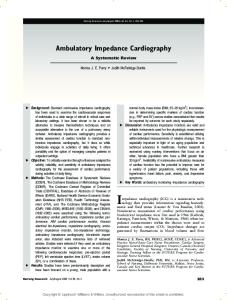
Figure 1. The scheme of the tetrapolar impedance measurement.
rating the ICG signal uses 4-electrode (tetrapolar) topology, when the application electrodes and receiving are separated. Figure 1 presents the scheme of the tetrapolar impedance measurement. The constant amplitude current oscillates between the application electrodes (A) and the voltage changes are detected on the receiving electrodes (R). This voltage due to the constant amplitude of current is proportional to the impedance of the tissue segment limited by the band electrodes. The voltage changes, are proportional to the impedance changes between receiving electrodes. Please note the distance between inner — receiving electrodes is described as L 0. The ECG electrodes are not presented. In some systems the same electrodes are used for detecting ECG and generating ICG signal. In several papers the mixed topology of the spot electrodes substituting band electrodes is used.
Impedance cardiography traces The typical ICG traces with simultaneously obtained one lead of ECG are presented on Figure 2. On the first channel from the top ECG is shown, on the second the first derivative of the impendance changes signal which is denoted dz/dt. In practice only ECG and the first derivative signal (dz/dt) are used to calculate the hemodynamic parameters. Another data essential to make those evaluations is the value of the base impedance (Z0), which is usually not changing very fast. So in some applications Z0 was stored as a only one value for several cycles.
The formulas for stroke volume calculation There are several different methods of calculation a SV and other hemodynamic parameters using impedance signal. These differences are the consequence of the different models used in describing the electrical properties of human chest.
ET
Figure 2. The typical impedance cardiography traces: the changes in the dz/dt (first derivative of the DZ) signal denoted as dz/dt (2nd channel), recorded simultaneously with one lead of ECG (1st channel). Please note the way of determination of PEP, ET (LVET) and (dz/ /dt)max, here marked as ”amp”.
Generally, all methods base on the characteristic points on the impedance waveform and parameters describing the physical dimension of the analysed part of the chest. Unfortunately, the usage of the different formulas may result in different values and different correlation with the reference methods. From the historical point of view the first who related the SV and the impedance changes was Kubicek [1, 2], who based on Nyboer works [3, 4]. His remains the most often used in the research for impedance cardiography: SV = r × L02× Z0–2×(dz/dt)max × ET where, SV — stroke volume [cm3], r — blood resistivity [W × cm]; L0 — distance between receiving electrodes [cm]; Z0 — basic impedance of the body segment limited by receiving electrodes [W], (dz/dt)max — the maximum of the first derivative of the impedance signal [W/s]; ET — ejection time [s], time of blood ejection from the left chamber, determined by selection of characteristic points on (dz/dt) trace. There were also other formulas: introduced by Sramek, Bernstein and Osypka or the formulas applied by the producers of Task Force Monitor or PhysioFlow which were described in the second part of the monograph on Ambulatory Impedance Cardiography [5]. Most of them are based on the so called “volume of electrically participating tissues” which describes the cone (or truncated cone) of the chest. The formulas applied by the producers of the equipment are usually not fully disclosed.
www.cardiologyjournal.org
551
Cardiology Journal 2012, Vol. 19, No. 5
The model One of the main problems regarding the ICG methodology is the lack of the proper model describing the origin of ICG traces. Despite some computer modelling of the impact of the organs on impedance signal it is still difficult to find the formula for SV calculations which will give the accepted accuracy regardless the condition of a patient. Thus, there are formulas using simplified cylindrical or the trunked cone models or some formulas which are not fully revealed to the public (created by the producers of the equipment). Rozenman et al. [6] mentioned in the letter to the Editor of “International Journal of Cardiology” about their earlier reports on methods and equipment which could be easily used to screen patients with left ventricular systolic dysfunction. They proposed a new index for detecting left ventricular systolic dysfunction. The index (Granoy Goor Index — GGI) combines systolic time interval and some impedance parameters derived from ICG signals. This index may be described as a product of (relative change in impedance, heart rate [HR] and time from R-ECG to the peak of impedance signal which they named a: GGI = (DR/R)× a× HR. They proved that for GGI cutoff value of 10 the sensitivity, specificity positive and negative predictive values are 86%, 100%, 100% and 96%, respectively, which were better than for any other parameters derived from ICG signals. The new index shows a tendency to abandon the usage of geometrical values (distance between the electrodes) or the body characterizing parameters (weight, height, body surface area etc.) in creating the dimensionless index describing cardiac performance. It is normalized change of impedance times the normalized time of the peak impedance. However, the task of calculating SV without geometrical and/or body parameters is still to be reached. Kuang et al. [7] performed a decomposition of the impedance signal to find the impact of the impedance change components of the blood vessels and ventricles in thorax from the mixed impedance signals detected on the chest surface. They extracted five components causing the change of the impendance: for the aorta, blood vessel in left lung, blood vessel in right lung, left ventricle, and right ventricle. Their experiments show that the waveform graphs of various components correspond with the physiological activities of the heart and blood vessels in a cardiac cycle. Also the main waveform of the ventricular components of left ventricle and right ventricle is contrary to that of the vascular components (from aorta, and both pulmonary ves-
552
sels), and the negative peak point of the waveform graphs of both ventricles are in phase with the second cardiac sound. Moreover, the results obtained in 80 normal adults show that the amplitude of aortic component is the largest and that left and right pulmonary vessels are the intermediate, while the components from left and right ventricles are the smallest. Their experiments confirmed the results obtained from mathematical modeling. In another paper from that group [8] they proposed new equation based on a parallel impedance model different from Nyboer’s equation is deduced. It was verified with the experiments in 100 healthy adults. Their equation shows that the thoracic impedance change (DZ) is directly proportional to the value of the volume change (DV) of the blood vessel, to the ratio of the basic impedance to the body height (Z0/H), while it is inversely proportional to the square of the chest circumference (C–2).
Validity of ICG Although the method was many times verified using invasive and noninvasive methods which was recently summarized in the forth chapter of the monograph [5] the new papers appear showing the validation of the method in a particular physiological/clinical stress/test or when the particular equipment from a producer (who offers a special formula for SV calculations) is used. Limper et al. [9] performed the study with the following aims: 1) to determine cardiac output (CO) by inert gas rebreathing (IGR) {CO(reb)} during transition into 0 G, in the standing position; and 2) to compare ICG and pulse contour method (PCM) with CO(reb) as a reference method. They measured baseline CO(reb) and HR on the ground, and CO(reb), CO(pcm), CO(icg) and HR in standing and supine positions in the transition to weightlessness in six subjects. The Bland and Altman analysis, and analysis of percentage error of each data set showed showed poor agreement for CO(pcm), and CO(icg) compared to CO(reb). They suggested that large bias for both comparisons indicated that both PCM and ICG underestimate the true CO value. Also they observed that paired CO values of individual subjects showed a better correlation between methods and a broad bias range, indicating a preponderant role for large between-subjects variability. They did not exclude ICG measurement to track CO dynamics during rapid changes of acceleration profiles, however suggested a repeated CO(reb) determinations for calibration in 1G acceleration. Petter et al. [10] compared the non-invasive thoracic electrical bioimpedance Aesculon tech-
www.cardiologyjournal.org
Gerard Cybulski et al., Impedance cardiography: Recent advancements
nique {TEB(Aesculon)} with thermodilution (TD) to evaluate whether TEB(Aesculon) may offer a reliable means for estimating CO in humans. They performed their study in 33 patients, with a mean age 59 ± 2.7 years, that underwent right heart catheterization for clinical investigation of pulmonary hypertension or severe heart failure. According to their report CO measured with TEB(Aesculon) correlate poorly with CO obtained by TD at rest (r = = 0.46, p < 0.001), during exercise (r = 0.35, p < 0.013) and NO inhalation (r = 0.41, p < 0.017). CO was higher for TEB(Aesculon) than TD with 0.86 ± 0.14 L/min at rest (p < 0.001) and 2.95 ± ± 0.69 L/min during exercise (p < 0.003), but similar during NO inhalation, with a tendency (p < 0.079) to be 0.44 ± 0.19 L/min higher for TEB(Aesculon) than TD. TEB(Aesculon) overestimated CO compared to TD with ~17% at rest and ~34% during exercise, but the techniques showed similar results during NO inhalation. Finally they concluded that TEB(Aesculon) may at present not replace TD for reliable CO measurements in humans. Osbak et al. [11] performed the comparison between CO values obtained in 127 atrial fibrillation patients and in 24 with sinus rhythm using IGR device and ICG system against echocardiography, as reference. They noticed that IGR showed larger intra-patient variation than ICG (0.11 vs. 0.054). Also, they observed that ICG and IGR both underestimated CO compared to echocardiography. They also found that variation between the IGR and the reference method for atrial fibrillation patients was less than desired. Finally they concluded that ICG was superior to IGR and showed acceptable agreement with echocardiography and variability similar to echocardiography. Since this study was performed in one body position this last conclusion seems to have some limitations. The similar study of a comparative evaluation of electrical velocimetry and IGR was published by Trinkmann et al. [12]. They wanted to evaluate whether hemodynamic parameters calculated using an algorithm (electrical velocimetry) proposed by Osypka and Bernstein [13] and implemented in thoracic electrical bioimpedance Aesculon device {TEB(Aesculon)} can be used interchangeably with IGR parameters in the clinical setting. They found an acceptable agreement between IGR and ICG as well as a high reproducibility, which was significantly higher for ICG. They noted that for CO values exceeding the physiological range a statistically significant difference was observed. Thus in conclusion they stated that values of cardiac function determined by either method should not be used interchangeably in the clinical setting.
An interesting study was performed by Tomsin et al. [14] on diurnal and position-induced variability of ICG measurements in healthy subjects. They concluded that in healthy subjects under standardized conditions, reproducibility of means of multiple ICG measurements is high for most of the indices based on SV and CO. However, knowing the natural variation of those indices they were not able to draw conclusions on trends in diseased subjects. Tonelli et al. [15] tried to evaluate the accuracy and precision of ICG (PhysioFlow PF-05) as a method for noninvasive hemodynamic monitoring of patients with pulmonary hypertension. They performed a prospective and blinded study of patients who underwent right heart catheterization. They noted that in patients with pulmonary hypertension ICG had good accuracy and fair precision for CO determination when compared with thermodilution. In conclusion, they stated that ICG may provide information about the preload status and has the potential to become a cost-effective and noninvasive method for the follow-up of patients with pulmonary hypertension. Also Taylor et al., [16] used PhysioFlow to evaluate the measurement of cardiac output obtained by continuous electrical bioimpedance cardiography to compare with a simultaneous direct Fick measurement of CO in children with congenital heart disease. In conclusion of their study performed on 56 patients they said that compared with measurements made by direct Fick method, CO measured using the PhysioFlow device was unreliable in anesthetized children with congenital heart disease. It seems that in children impedance method creates some problems with accurate measurement of hemodynamic parameters. Ballestero et al. [17] using another device (Nicom) noted that the CI measured by bioreactance in children (with no hemodynamic disturbances) varies with the age and weight of the patients and is lower than the normal range in a large percentage of measurements. They concluded that this method is not useful for evaluating CI in small children. However, the most important limitation of their study was the lack of comparison between the cardiac values obtained with bioreactance and those obtained using other reference methods. They only characterized the internal consistency of the results, their correlation with age and body characterizing indices. Certainly, the above papers showed some limitations of the method. In our opinion, until the model and formula derived from the model does not properly reflect the mechanics of the circulation in
www.cardiologyjournal.org
553
Cardiology Journal 2012, Vol. 19, No. 5
the chest we should only use the impedance results in test when the patient is the reference for himself and avoid the comparisons of the result between the patients. In many cases observing trends and reactions to the tests provide clinically useful information about the cardiovascular dynamics.
Research and clinical applications We presented below several applications of ICG which, according to our opinion, could be used in the future, despite the methodological uncertainties. In those applications patient remains the reference for himself and the immediate changes or short-term or long-term trends might be observed. Also some negative experiences with ICG application were reviewed.
Postural stress The application of ICG may be useful for explanation of orthostatic syncope mechanism. Tahvanainen et al. [18] thanks to the application of ICG observed a major decrease in systemic vascular resistance in subjects with presyncope during 0.25 mg nitroglycerin-stimulated tilt-table test, in the absence of changes in cardiac output. These findings indicated that even a small dose of nitroglycerin significantly decreased arterial resistance and cardiac afterload. In the paper of Limper et al. [9] mentioned in the earlier section they found that ICG could be used (in limited form) for monitoring the hemodynamic response to the acceleration stress. DeMarzo [19] noticed that hypertensive patients have diverse cardiovascular abnormalities that can be quantified by ICG. He tried to show how ICG waveform analysis with postural change can be used to detect subclinical cardiovascular disease in patients with high blood pressure. He suggested that by stratifying patients with ventricular, vascular, and hemodynamic abnormalities, treatment could be customized basing on the abnormal underlying mechanisms with the potential to rapidly control blood pressure, prevent progression of cardiovascular disease, and possibly reverse remodeling.
Cardiac rehabilitation It seems that ICG could be the useful method in quantitative monitoring of cardiac rehabilitation process. Gielerak at al. [20] studied the effects of cardiac rehabilitation on hemodynamic parameters measured by ICG in 50 patients with heart failure (NYHA class II and III, left ventricular ejection fraction £ 40%) who underwent 8-week cardiac reha-
554
bilitation program. They performed clinical and hemodynamic assessment before and after cardiac rehabilitation and noticed that ICG revealed a significant change in diastolic to systolic wave ratio and a significant change in the hemodynamic profile of the left ventricular blood ejection. This findings lead them to conclude that ICG revealed beneficial effects of cardiac rehabilitation, manifested by reduced fluid retention and a reduced effect of preload on left ventricular relaxation and ejection.
Pacemaker optimization Inappropriate programming of the atrio-ventricular delay (AVd) decreases cardiac output significantly. ICG could be used in quantitative evaluation of the optimal settings for the pacemakers. Khan et al. [21] used ICG cardiac output measurement (NICOM) for optimization of cardiac resynchronization therapy (CRT) devices. They compared the effect of NICOM-based optimization to no optimization (empiric settings) on CRT outcomes in 203 patients divided into several groups. The empiric group (n = 54) was programmed to “out of the box” settings with a fixed AVd of 120 ms and a VV delay of 0 ms; and the optimization group (n = 149) underwent adjustments of both the AV and VV delays according to the greatest improvement in resting CO. In their study the primary endpoints were improvements in left ventricular volumes and function from baseline at 6 months. Secondary endpoints were change in NYHA class, quality of life score, and 6-min walk test performance. They concluded that device optimization using noninvasive measures of CO is associated with better clinical and echocardiographic response compared to empiric settings.
Sleep studies Impairment of autonomic nervous system dynamics may result in cardiovascular activity disorders. Balachandran et al. [22] used heart rate variability (HRV) and pre-ejection period (PEP) derived from ICG traces, to estimate autonomic activity. The hypothesis of their study was that even in a cohort of patients with mild, asymptomatic obstructive sleep apnoea without overt cardiovascular disease, daytime HRV metrics and ICG measurements of pre-ejection period would demonstrate increased sympathetic and decreased parasympathetic modulation compared to matched controls. They used PEP since it has been previously noted to correlate with cardiac sympathetic tone. However in their study, the presence of obstructive sleep apnoea was not associated with a significant change in PEP.
www.cardiologyjournal.org
Gerard Cybulski et al., Impedance cardiography: Recent advancements
De Zambotti et al. [23] intended to compare cardiovascular and autonomic responses before and after falling asleep in eight insomniacs and eight normal sleepers. They obtained HR, SV, CO and PEP by ICG during a night of polysomnographic recording. They found the decrements in HR and CO and increases in SV in both groups after sleep onset compared with wakefulness. However, PEP (related inversely to sympathetic beta-adrenergic activity) showed increases after sleep onset in controls, but remained unchanged in insomniacs. PEP was also significantly lower in insomniacs than in normal sleepers in both conditions.
Pregnancy monitoring Moertl et al. [24] intended to evaluate ICG derived SV and CO reliability during pregnancy. They determined thoracic impedance Z0, left ventricular ejection time and the maximum value of the first derivative of the impedance waveform (dZ/ /dt)(max) beat-to-beat. They noticed that the two main components of non-invasive SV estimation, left ventricular ejection time and (dZ/dt)(max), decreased in week 35 relative to week 12 by 7.6% ± ± 4.8% and by 36.0% ± 14.0%, respectively, based on a decrease in R-R interval of 9.9% ± 9.7%, whereas changes in Z0 did not play a significant role. Furthermore, the decrease of (dZ/dt)(max) was greater in the third compared to the second trimester of pregnancy. Taking into account an 18.2% ± 6.8% body weight increase, the calculated SV decreased in week 35 relative to week 12 by 19.2% ± 14.3%. The normalized term ((dZ/dt)(max))/Z(0) explained 85–94% of the variance of SV change after week 20. These results were confirmed for fixed R-R interval at a constant value across the repeated measurements. Based on beat-to-beat analysis of the main components of non-invasive SV estimation by ICG, measured repeatedly throughout normal pregnancy, they concluded that SV calculations render invalid data. Their findings strongly suggest that CO cannot be reliably assessed with ICG in pregnant women. However, San-Frutos et al. [25] used ICG to monitor hemodynamic changes during pregnancy and postpartum in 18 subjects from 12th week of gestation until 6th month of postpartum period. They observed statistically significant decrease in end-diastolic volume, SV, CO and ejection fraction until 48 h after delivery. They concluded that ICG may be the most appropriate and accurate technique to measure normal hemodynamic changes during pregnancy and postpartum. Tomsin et al. [26] tried to evaluate pulse transit time (PTT), equivalent to pulse wave velocity, as
the time interval between corresponding characteristics of electrocardiography and Doppler waves, corrected for HR, at the level of renal interlobar veins, hepatic veins, and arcuate branches of uterine arteries. They also used ICG to measure PTT at the level of the thoracic aorta. In normal pregnancy, all PTT increased gradually (p £ 0.01). PTT was shorter in late-onset preeclampsia (p < 0.05) and also in early-onset preeclampsia, with exception for hepatic veins and thoracic aorta (p > 0.05). Their results indicated that PTT is an easy and highly accessible measure for vascular reactivity in both arterial and venous sites of the circulation. Their observations correlate well with known gestational cardiovascular adaptation mechanisms. This lead them to conclusion that PTT could be used as a new parameter in the evaluation and prediction of preeclampsia.
Holter-type monitoring of impedance cardiography signals Another field of the possible applications of ICG measurements seems to be associated with the ambulatory, Holter type recordings of the signal, which was explored in the first monograph on that matter [5]. Some possible clinical applications, such as monitoring of hemodynamics in cardiac arrhythmia, pacemaker optimisation or control (e.g. pacemaker syndrome) were discussed in the chapter 5 of that monograph [5]. Others, including monitoring of dynamics of pharmacological treatment (inotropic, chronotropic or antihypertensive) are also suggested there. There are several Holter-type systems for monitoring central hemodynamics available for research applications. In December 2010, one of them, received Food and Drug Administration clearance which might help in bringing the method to the clinical practice, but probably will not finish the discussion about the reliability of ICG. Thus technically, ambulatory monitoring of ICG signals is possible. Is it possible to introduce non-invasive ambulatory hemodynamic monitoring to clinical practice? In our opinion the non-invasive, Holter-type ambulatory hemodynamic monitoring can yield additional quantitative data that are useful in clinical practice. However final decision will be undertaken by the clinicians who spot the benefit from using the method to the patients.
Conclusions and prospects for impedance cardiography The controversies around the verification of ICG resulted in a sceptical approach by health au-
www.cardiologyjournal.org
555
Cardiology Journal 2012, Vol. 19, No. 5
thorities to this technique. However, since July 1st, 1999, Medicare and Medicaid Services decided to allows limited coverage of cardiac monitoring using electrical bioimpedance. They also issued the list of applications excluded from reimbursement, which reflects inadequacy of that method in particular clinical situation. Thus, not covered is the use of such a device for any monitoring of patients with proven or suspected disease involving severe regurgitation of the aorta, or for patients with minute ventilation sensor function pacemakers, since the device may adversely affect the functioning of that type of pacemaker. Moreover, these devices do not render accurate measurements in cardiac bypass patients when they are on a cardiopulmonary bypass machine though they do provide accurate measurements prior to and post bypass pump. Their detailed description may be found at http:// new.cms.hhs.gov/manuals/downloads/Pub06_ PART_50. pdf. Following the decision of Medicare and Mediaid Services in USA the respective national health institutions in other countries decided to allow refunding the ICG diagnosis, initially in a very limited areas, e.g. Intensive Care Units only (e.g. in Poland, since 2010). Certainly, these decisions could stimulate the producers of the ICG equipment and affect the development of the hemodynamic monitoring systems in both, stationary and ambulatory, versions. Simultaneous recording of both ECG and a signal that reflects central hemodynamics activity might provide additional diagnostic data. It appears that electrical ICG, a simple method that allows for continuous, noninvasive determination of SV, maximum velocity of ejection and systolic time intervals, could be used to supply such a signal for stationary and ambulatory applications [11, 12]. However, the standardisation of the electrodes topography and the measurement procedure is highly needed. Conflict of interest: none declared
6.
7.
8.
9.
10.
11.
12.
13.
14.
15.
16.
17.
18.
19.
20.
21.
22.
References 23. 1. Kubicek WG, Karnegis JN, Patterson RP, Witsoe DA, Mattson RH. Development and evaluation of an impedance cardiac output system. Aerospace Med, 1966; 37: 1208–1212. 2. Kubicek WG, Patterson RP, Witsoe DA. Impedance cardiography as a non-invasive method for monitoring cardiac function and other parameters of the cardiovascular system. Ann NY Acad Sci, 1970; 170: 724–732. 3. Nyboer J, Bango S, Barnett A et al. Radiocardiograms. J Clin Invest, 1940; 19: 773–778. 4. Nyboer J. Plethysmography. Impedance. In: Glasser O ed. Medical physics. Vol. 2. Year Book Pub., Chicago, 1950: 736–743. 5. Cybulski G. Ambulatory impedance cardiography. The systems and their applications. Series: Lecture notes in electrical engi-
556
24.
25.
26.
neering, Vol. 76. 1st Ed. Springer-Verlag Berlin and Heidelberg GmbH & Co. KG (http://www.springer.com/engineering/ /biomedical+engineering/book/978-3-642-11986-6). Rozenman Y, Rotzak R, Patterson RP. Detection of left ventricular systolic dysfunction using a newly developed, laptop based, impedance cardiographic index. Int J Cardiol, 2011; 149: 248–250. Kuang MX, Xiao QJ, Kuang NZ, Cui CY, Hu AR. Studies on separating the impedance change components of blood vessels and ventricles in thorax from mixed impedance signals on chest surface. Med Phys, 2011; 38: 3270–3278. Qiu-Jin X, Zhen W, Ming-Xing K, Ping W, Pei L, Jian-Feng J. Thoracic impedance change equation deduced on the basis of parallel impedance model and Ohm’s law. Med Phys, 2012; 39: 1042–1045. Limper U, Gauger P, Beck LEJ. Upright cardiac output measurements in the transition to weightlessness during parabolic flights. Aviat Space Environ Med, 2011; 82: 448–454. Petter H, Erik A, Björn, E, Göran R. Measurement of cardiac output with non-invasive Aesculon® impedance versus thermodilution. Clin Physiol Funct Imag, 2011; 31: 39–47. Osbak PS, Henriksen JH, Kofoed KF, Jensen GB. Non-invasive measurements of cardiac output in atrial fibrillation: inert gas rebreathing and impedance cardiography. Scand J Clin Lab Invest, 2011; 71: 304–313. Trinkmann F, Berger M, Hoffmann U, Borggrefe M, Kaden JJ, Saur J. A comparative evaluation of electrical velocimetry and inert gas rebreathing for the non-invasive assessment of cardiac output. Clin Res Cardiol, 2011; 100: 935–943. Bernstein D, Osypka M. Apparatus and method for determining an approximation of the stroke volume and the cardiac output of the heart. US Patent, 2003; 6: 511,438 B2. Tomsin K, Mesens T, Molenberghs G, Gyselaers W. Diurnal and position-induced variability of impedance cardiography measurements in healthy subjects. Clin Physiol Funct Imag, 2011; 31: 145–150. Tonelli AR, Alnuaimat H, Li N, Carrie R, Mubarak KK. Value of impedance cardiography in patients studied for pulmonary hypertension. Lung, 2011; 189: 369–375. Taylor K, La Rotta G, McCrindle BW, Manlhiot C, Redington A, Holtby H. A comparison of cardiac output by thoracic impedance and direct fick in children with congenital heart disease undergoing diagnostic cardiac catheterization. J Cardiothorac Vasc Anesth, 2011; 25: 776–779. Ballestero Y, López-Herce J, Urbano J et al. Measurement of cardiac output in children by bioreactance. Pediatr Cardiol, 2011; 32: 469–472. Tahvanainen A, Koskela J, Leskinen M et al. Reduced systemic vascular resistance in healthy volunteers with presyncopal symptoms during a nitrate-stimulated tilt-table test. Br J Clin Pharmacol, 2011; 71: 41–51. DeMarzo AP. Using impedance cardiography with postural change to stratify patients with hypertension. Ther Adv Cardiovasc Dis, 2011; 5: 139–148. Gielerak G, Piotrowicz E, Krzesiński P, Kowal J, Grzęda M, Piotrowicz R. The effects of cardiac rehabilitation on haemodynamic parameters measured by impedance cardiography in patients with heart failure. Kardiol Pol, 2011; 69: 309–317. Khan FZ, Virdee MS, Hutchinson J et al. Cardiac resynchronization therapy optimization using noninvasive cardiac output measurement. Pacing Clin Electrophysiol, 2011; 34: 1527– –1536. Balachandran JS, Bakker JP, Rahangdale S et al. Effect of mild, asymptomatic obstructive sleep apnea on daytime heart rate variability and impedance cardiography measurements. Am J Cardiol, 2012; 109: 140–145. De Zambotti M, Covassin N, De Min Tona G, Sarlo M, Stegagno L. Sleep onset and cardiovascular activity in primary insomnia. J Sleep Res, 2011; 20: 318–325. Moertl MG, Schlembach D, Papousek I, Hinghofer-Szalkay H, Weiss EM, Lang U, Lackner HK. Hemodynamic evaluation in pregnancy: Limitations of impedance cardiography. Physiol Meas, 2012; 33: 1015–1026. San-Frutos L, Engels V, Zapardiel I et al. Hemodynamic changes during pregnancy and postpartum: A prospective study using thoracic electrical bioimpedance. J Matern Fetal Neonatal Med, 2011; 24: 1333–1340. Tomsin K, Mesens T, Molenberghs G, Gyselaers W. Venous pulse transit time in normal pregnancy and preeclampsia. Reprod Sci, 2012; 19: 431–436.
www.cardiologyjournal.org